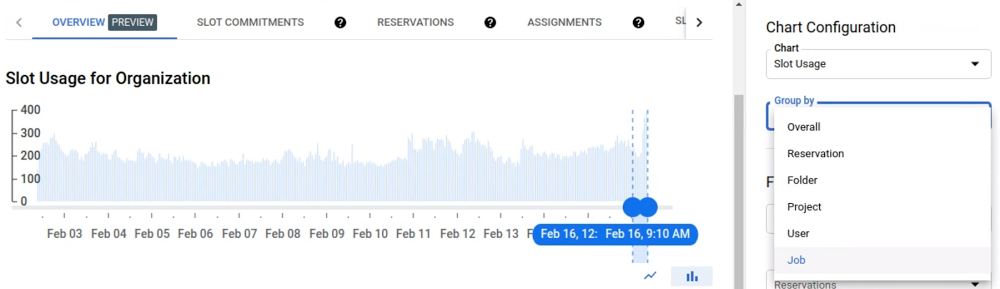
When doing analytics at scale with BigQuery, understanding what is happening and being able to take action in real-time is critical. To that end, we are happy to announce Resource Charts for BigQuery Administrator. Resources Charts provide a native, out-of-the-box experience for real-time monitoring and troubleshooting of your BigQuery environments. Resource Charts make it easy to understand your historical patterns across slot consumption, job concurrency and job performance, allowing you to take actions to ensure your BigQuery environment continues to run smoothly. Specifically, it can help you:Determine how your resources are being consumed across several dimensions like projects, reservations and users, so you can take remediating actions like pausing a troublesome query. Manage capacity by allowing you to understand how your resources are being consumed over time and helping you optimize your BigQuery environment’s slot capacity.Taking Resource Charts for a spinLet’s say you start the morning with a hot coffee in hand and suddenly several colleagues complain their queries are running slower than expected. You open up Resource Charts and immediately see there was a spike in slot usage. But, what caused the spike? You zoom into the time range when the spike happened and group by different dimensions.When looking at the job dimension, you see that a new scheduled query job has been eating up a significant portion of your slot resources for the past 10 minutes.You find the query in Job history, click Cancel Job and your BigQuery environment returns to normal. You just diagnosed your BigQuery environment, identified the outlier and remediated the situation… all before you had a chance to put your coffee cup down.You just diagnosed your BigQuery environment, identified the outlier and remediated the situation… all before you had a chance to put your coffee cup down.Resource Charts leverages BigQuery’s INFORMATION_SCHEMA tables to render these visuals. This means all the data is also available for you to query directly, allowing you to create your own dashboards and monitoring processes. To help you get started, you can find example INFORMATION_SCHEMA queries on GitHub that show an organization’s slot and reservation utilization, job execution and job errors. You can also view Google Data Studio dashboard templates built from these queries.Resource Charts for BigQuery Administrator is available today in Public Preview for customers using Reservations and we hope it makes it easier for you to manage your BigQuery environments. You can learn more about how to use Resource Charts here.Related ArticleInventory management with BigQuery and Cloud RunBuilding a simple inventory management system with Cloud Run and BigQueryRead Article
Quelle: Google Cloud Platform
Published by