Posted by Sharat Shroff, Product Manager, Google Cloud Platform
Stackdriver Debugger is already a popular tool for troubleshooting issues in production applications. Now, based on customer feedback, we’re announcing a new feature: logs panel integration.
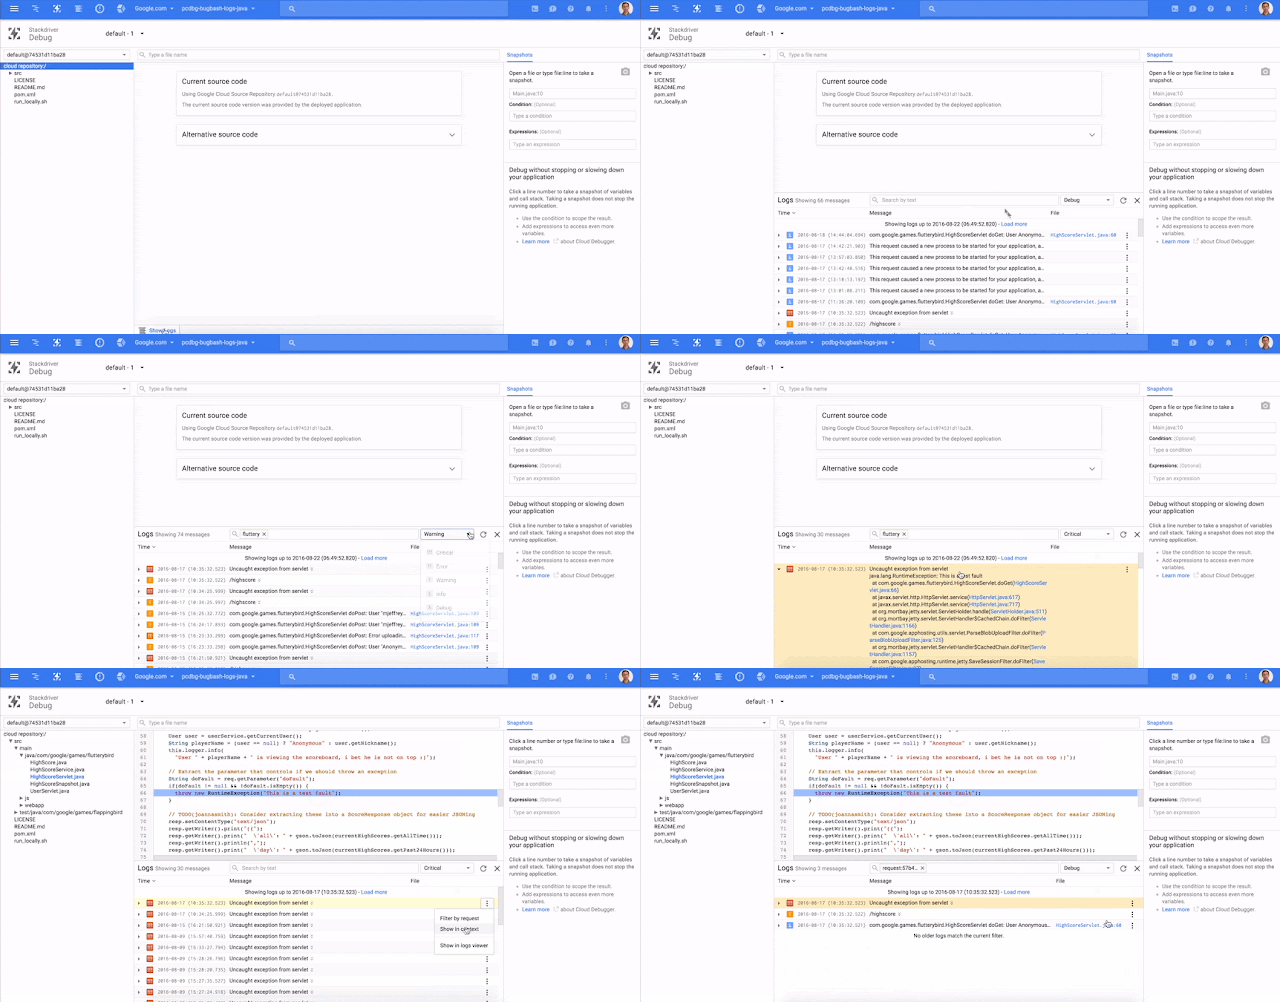
With logs panel integration, not only can you gather production application state and link to its source, but you can also view the associated raw logs associated with your Google App Engine projects — all on one page.
We’ve integrated several useful features. For instance, you can:
Display log messages, flat in chronological order, for easy access, without having to expand the request log to see text.
Easily navigate to the log statement in source code directly from the log message.
Quickly filter by text, log level, request or source file
Show all logs while highlighting your log message of interest with the “Show in context” option.
For easier collaboration, simply copy/paste the URL to your team. The link highlights your log message of interest, as well as including your logs panel filter. You can also save this URL and reuse it later for easy retrieval with your tracking system.
We’re working hard to make Stackdriver Debugger an easy and intuitive tool for diagnosing application issues directly in production (check out our new feature that allows you to dynamically add log statements without having to write and re-deploy code). Start using the integrated Debugger and log panel functionality today by navigating to the cloud console Debug page — and be sure to send us your feedback and questions!
Quelle: Google Cloud Platform

Published by