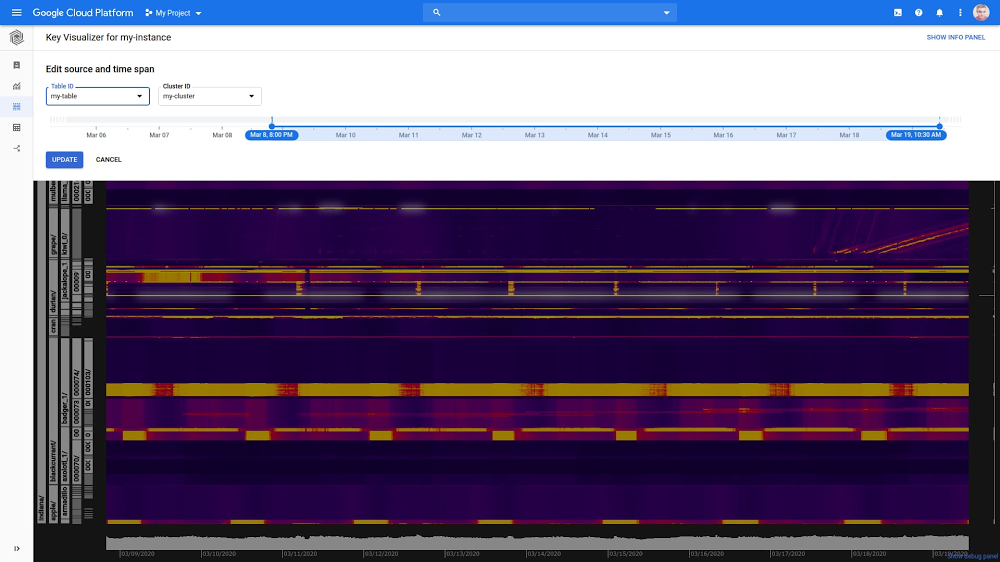
Cloud Bigtable is Google Cloud’s petabyte-scale NoSQL database service for demanding, data-driven workloads that need low latency, high throughput, and scale insurance. If you’ve been looking for more ways to monitor your Bigtable performance more easily, you’re in luck: Key Visualizer is now directly integrated into the Bigtable console. No need to switch to a Cloud Monitoring dashboard to see this data; you can now view your data usage patterns at scale in the same Bigtable experience. Best of all, we’re lowering the eligibility requirements for Key Visualizer usage, making it easier for customers to use this tool.If you aren’t yet familiar with Key Visualizer, it generates visual reports for your tables based on the row keys that you access. It’s especially helpful for iterating on the early designs of a schema before going to production. You can also troubleshoot performance issues, find hotspots, and get a holistic understanding of how you access the data that you store in Bigtable. Key Visualizer uses heatmaps to help you easily determine whether your reads or writes are creating hotspots on specific rows, find rows that contain too much data, or see whether your access patterns are balanced across all of the rows in a table. Here’s how the integration looks:Beyond bringing Key Visualizer into Bigtable, there are several other improvements to highlight: Fresher data. Where Key Visualizer used to serve data that was anywhere from seven to 70 minutes old, Key Visualizer in Bigtable can now show data that is approximately between four and 30 minutes old. To do that, Bigtable scans the data every quarter of the hour (10:00, 10:15, 10:30, 10:45), and then takes a few minutes to analyze and process that performance data.Better eligibility. We dropped the requirement on the number of reads or writes per second in order to make the eligibility criteria to scan data simpler: Now, you just need at least 30 GB of data in your table. This will lower the barrier for developers who want to fine-tune their data schema. Time range. It’s now easier to select the time range of interest with a sliding time range selector. Performance data will be retained for 14 days.The new version of Key Visualizer is available at no additional charge to Bigtable customers, and does not cause any additional stress on your application. If you’re ready to dig in, head over to Bigtable and choose “Key Visualizer” in the left navigation.For more ideas on how Key Visualizer can help you visualize and optimize your analytics data, read more about Key Visualizer in our user guide, or check out this brief overview video and this presentation on how Twitter uses Bigtable.
Quelle: Google Cloud Platform
Published by