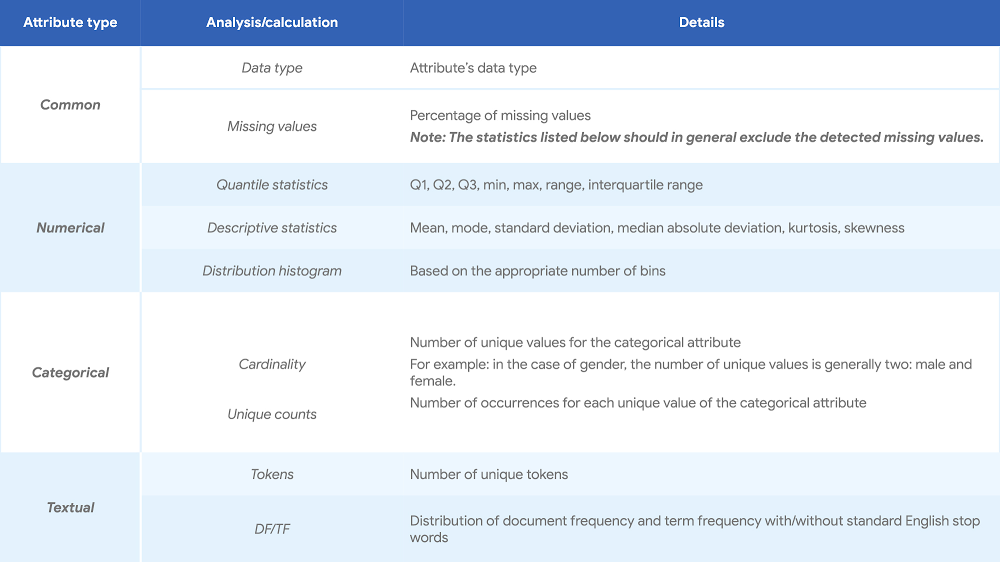
When you’re getting started with a machine learning (ML) project, one critical principle to keep in mind is that data is everything. It is often said that if ML is the rocket engine, then the fuel is the (high-quality) data fed to ML algorithms. However, deriving truth and insight from a pile of data can be a complicated and error-prone job. To have a solid start for your ML project, it always helps to analyze the data up front, a practice that describes the data by means of statistical and visualization techniques to bring important aspects of that data into focus for further analysis. During that process, it’s important that you get a deep understanding of: The properties of the data, such as schema and statistical properties;The quality of the data, like missing values and inconsistent data types;The predictive power of the data, such as correlation of features against target.This process lays the groundwork for the subsequent feature selection and engineering steps, and it provides a solid foundation for building good ML models. There are many different approaches to conducting exploratory data analysis (EDA) out there, so it can be hard to know what analysis to perform and how to do it properly. To consolidate the recommendations on conducting proper EDA, data cleaning, and feature selection in ML projects, we’ll summarize and provide concise guidance from both intuitive (visualization) and rigorous (statistical) perspectives. Based on the results of the analysis, you can then determine corresponding feature selection and engineering recommendations. You can also get more comprehensive instructions in this white paper.You can also check out the Auto Data Exploration and Feature Recommendation Tool we developed to help you automate the recommended analysis, regardless of the scale of the data, then generate a well-organized report to present the findings. EDA, feature selection, and feature engineering are often tied together and are important steps in the ML journey. With the complexity of data and business problems that exist today (such as credit scoring in finance and demand forecasting in retail), how the results of proper EDA can influence your subsequent decisions is a big question. In this post, we will walk you through some of the decisions you’ll need to make about your data for a particular project, and choosing which type of analysis to use, along with visualizations, tools, and feature processing.Let’s start exploring the types of analysis you can choose from. Statistical data analysisWith this type of analysis, data exploration can be conducted from three different angles: descriptive, correlation, and contextual. Each type introduces complementary information on the properties and predictive power of the data, helping you make an informed decision based on the outcome of the analysis.1. Descriptive analysis (univariate analysis)Descriptive analysis, or univariate analysis, provides an understanding of the characteristics of each attribute of the dataset. It also offers important evidence for feature preprocessing and selection in a later stage. The following table lists the suggested analysis for attributes that are common, numerical, categorical and textual.Click to enlarge2. Correlation analysis (bivariate analysis)Correlation analysis (or bivariate analysis) examines the relationship between two attributes, say X and Y, and examines whether X and Y are correlated. This analysis can be done from two perspectives to get various possible combinations:Qualitative analysis. This performs computation of the descriptive statistics of dependent numerical/categorical attributes against each unique value of the independent categorical attribute. This perspective helps intuitively understand the relationship between X and Y. Visualizations are often used together with qualitative analysis as a more intuitive way of presenting the result.Click to enlargeQuantitative analysis. This is a quantitative test of the relationship between X and Y, based on hypothesis testing framework. This perspective provides a formal and mathematical methodology to quantitatively determine the existence and/or strength of the relationship.Click to enlarge3. Contextual analysisDescriptive analysis and correlation analysis are both generic enough to be performed on any structured dataset, neither of which requires context information. To further understand or profile the given dataset and to gain more domain-specific insights, you can use one of two common contextual information-based analyses: Time-based analysis: In many real-world datasets, the timestamp (or a similar time-related attribute) is one of the key pieces of contextual information. Observing and/or understanding the characteristics of the data along the time dimension, with various granularities, is essential to understanding the data generation process and ensuring data qualityAgent-based analysis: As an alternative to the time, the other common attribute is the unique identification (ID, such as user ID) of each record. Analyzing the dataset by aggregating along the agent dimension, i.e., histogram of number of records per agent, can further help improve your understanding of the dataset. Example of time-based analysis:The following figure displays the average number of train trips per hour originating from and ending at one particular location based on a simulated dataset.From this, we can conclude that peak times are around 8:30am and 5:30pm, which is consistent with the intuition that these are the times when people would typically leave home in the morning and return after a day of work.Feature selection and engineeringThe ultimate goal of EDA (whether rigorous or through visualization) is to provide insights on the dataset you’re studying. This can inspire your subsequent feature selection, engineering, and model-building process. Descriptive analysis provides the basic statistics of each attribute of the dataset. Those statistics can help you identify the following issues: High percentage of missing valuesLow variance of numeric attributesLow entropy of categorical attributesImbalance of categorical target (class imbalance)Skew distribution of numeric attributesHigh cardinality of categorical attributesThe correlation analysis examines the relationship between two attributes. There are two typical action points triggered by the correlation analysis in the context of feature selection or feature engineering:Low correlation between feature and targetHigh correlation between featuresOnce you’ve identified issues, the next task is to make a sound decision on how to properly mitigate these issues. One such example is for “High percentage of missing values.” The identified problem is that the attribute is missing in a significant proportion of the data points. The threshold or definition of “significant” can be set based on domain knowledge. There are two options to handle this, depending on the business scenario:Assign a unique value to the missing value records, if the missing value, in certain contexts, is actually meaningful. For example, a missing value could indicate that a monitored, underlying process was not functioning properly. Discard the feature if the values are missing due to misconfiguration, issues with data collection or untraceable random reasons, and the historic data can’t be reconstituted. You can check out the whitepaper to learn more about the proper ways of addressing the above issues, recommended visualization of each analysis and a survey of the existing tools that are most suitable.A tool that helps you automateTo further help you speed up the process of preparing data for machine learning, you can use our Auto Data Exploration and Feature Recommendation Tool to automate the recommended analysis regardless of the scale of the data, and generate a well-organized report to present the findings and recommendations. The tool’s automated EDA includes:Descriptive analysis of each attribute in a dataset for numerical, categorical; Correlation analysis of two attributes (numerical vs. numerical, numerical vs. categorical, and categorical vs. categorical) through qualitative and/or quantitative analysis.Based on the EDA performed, the tool makes feature recommendations and generates a summary report, which looks something like this:We look forward to your feedback as we continue adding features to the tool.Thanks to additional contributors to this work: Dan Anghel, cloud machine learning engineer and Barbara Fusinska, cloud machine learning engineer
Quelle: Google Cloud Platform
Published by