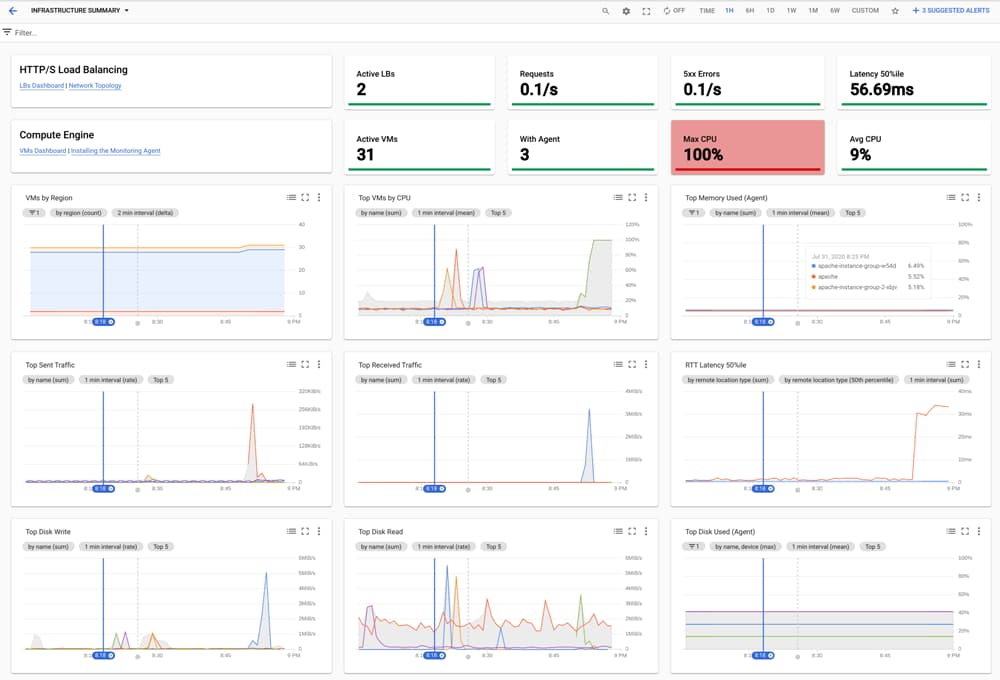
Cloud Monitoring has always provided comprehensive visibility and management into individual Compute Engine virtual machines (VMs). But many Google Cloud customers have hundreds, thousands, or tens of thousands of VMs that they need to manage. Cloud Monitoring now gives you zero-config, out-of-the-box visibility into your entire Compute Engine VM fleet, with quick access to advanced Monitoring features such as installing the Cloud Monitoring agent and configuring fleetwide alerts. Our new Infrastructure Summary dashboard and expanded VM Instances dashboard jump-start your troubleshooting with no setup required!Monitor your VM fleet’s health with infrastructure summaryThe new single-pane-of-glass Infrastructure Summary dashboard lets you see aggregate fleet-wide statistics at a glance, and provides insight into the top VMs for a select group of key CPU, disk, memory, and network metrics. You can use the quick links in the top left to jump into detailed troubleshooting dashboards for load balancers, network, and VM instances. The filter bar enables you to narrow your view if you want to see a specific subset of VMs.Troubleshoot issues with VM instances fleet-wide viewYou’ve always been able to view and filter all your VM instances in Cloud Monitoring, and now you can do much more. The VM Instances dashboard now includes agent visibility and installation, and its new tabs let you see fleet-wide information across key metrics.View top VMs across key metrics for CPU, disk, memory, and networkDedicated tabs for CPU, disk, memory, and network show you outlier VMs for key metrics in each category, so you can visually inspect for anomalies and quickly drill into problem areas and VMs. Filtering allows you to narrow down the set of VMs being displayed in any tab for detailed analysis.View Monitoring agent status and install in the UIThe per-VM status of the Cloud Monitoring agent is now available in the main inventory page, and you can install the agent on a VM using our built-in wizard. Use the agent to track specified system and application metrics, including: Memory and disk metricsAdvanced system metricsMetrics for workloads like MySQL, Apache, Java virtual machine, and othersIf you want to install and manage the agent across multiple VMs at once, you can use our new Ops Agent Policies.Understand your advanced metricsThe “Explore” tab gives you insight into the advanced metrics you’re currently collecting in Cloud Monitoring, and quick links to information on how to send additional metrics, so you can see even more metrics in one place.Enable recommended alertsWe’ve made it easy to enable predefined recommended alerts across your whole VM fleet. With one click, you can ensure that all the VMs in your fleet are continuously monitored for excessive utilization (memory, disk, network, etc), and receive alert notifications across a variety of channels (email, SMS, Slack, PagerDuty, Cloud Console mobile app, Cloud Pub/Sub, and webhooks). You can also override recommended alert thresholds based on your needs.A fleet of new capabilitiesAs with all our operations tools, we want Cloud Monitoring to include everything you need to manage your environment, whether it consists of one VM or thousands. To get started with Cloud Monitoring, check out this demo.Related ArticleHigh-resolution user-defined metrics in Cloud MonitoringNow you can write custom and Prometheus metrics for Cloud Monitoring every 10 secondsRead Article
Quelle: Google Cloud Platform
Published by