If you have been using Docker for some time, after the initial phases of building Dockerfiles and running a container here and there, the real work begins in building, deploying and operating multi-container applications in a production environment. Are you operationally ready to take your application to production? Docker Datacenter provides an integrated management framework for your Dockerized environment and applications and when coupled with clear strategies in approaching and resolving anomalies, IT ops teams can be assured in successfully operationalizing Docker.
Let’s use a sports metaphor to approach troubleshooting:
Pre-Game will cover the planning phase for your applications
Game Time will cover troubleshooting tools available in Docker Datacenter
Post-Game will discuss complementary tools to aid in ongoing insights
Pre-Game
Whether or not you are sports fan, you can appreciate the importance of the planning out any task. This is no different than what you would do for your applications. Health checks are a great way to provide a deeper level of insight into how your application is performing. Since Docker 1.12 there is a new HEALTHCHECK directive. We can use this directive to signal to the Docker Engine whether or not the application is healthy.
There are a two ways to implement the HEALTHCHECK directive. The first way is use the directive in the Dockerfile. I prefer this method since the app and the health check are coupled together. Here is an example of a Dockerfile with the HEALTHCHECK directive :
FROM alpine
RUN apk -U upgrade && apk add python curl &&
apk add py-pip &&
pip install –upgrade pip &&
pip install flask redis pymongo &&
rm -rf /var/cache/apk/*
WORKDIR /code
ADD . /code
EXPOSE 5000
HEALTHCHECK CMD curl -f http://localhost:5000/ || exit 1
CMD [“python”, “app.py”]
The second way is using the docker run command. https://docs.docker.com/engine/reference/run/#/healthcheck. Here is an example of the run command :
docker run –name=test -d –health-cmd=’stat /etc/passwd || exit 1′ –health-interval=2s busybox sleep 1d
This method can actually supersede the Dockerfile method. Both methods are very useful. Here is an example output with the heatlh :
clemenko13:orientation clemenko$ docker ps
CONTAINER ID IMAGE COMMAND CREATED STATUS PORTS NAMES
4cbabba22d31 clemenko/orient_flask “python app.py” 15 minutes ago Up 15 minutes (healthy) 0.0.0.0:5000->5000/tcp orientation_app_1
You can even write wrappers to report this back.
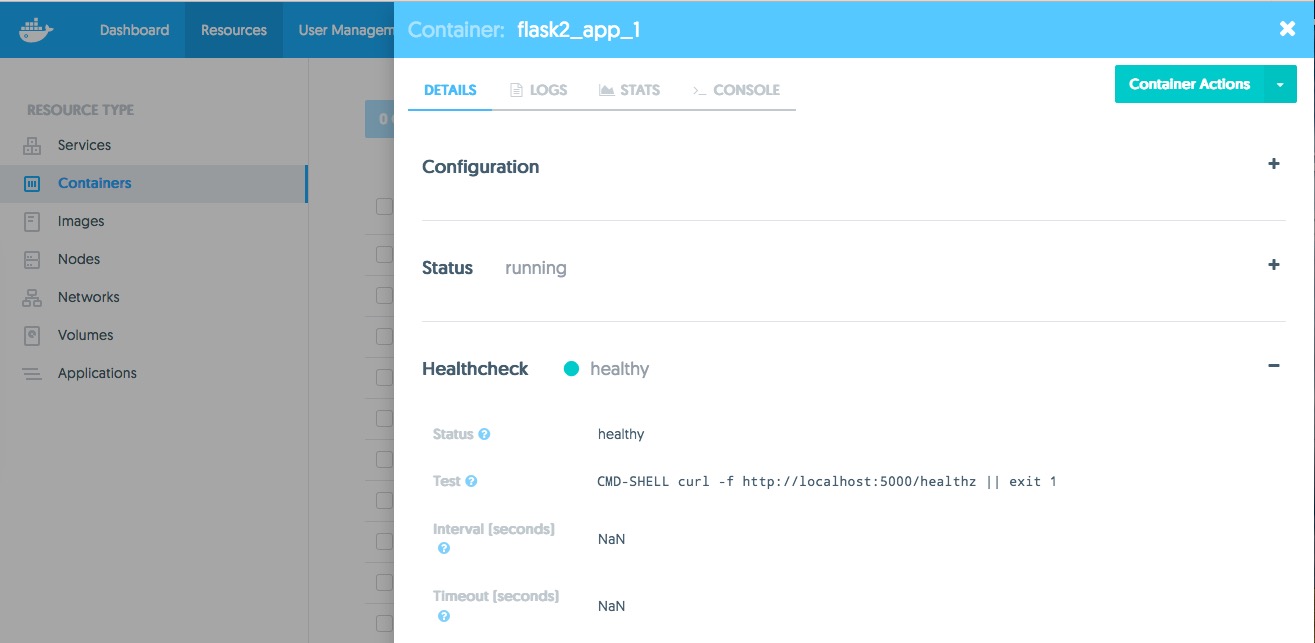
And in the image below, you can see that Docker Datacenter has a visual for the HEALTHCHECK within the container info itself.
Game Time
Whether or not you have the healthz endpoint setup, Docker Datacenter has some great troubleshooting tools built right in.
Let’s start with the container details.
In Docker Datacenter, you can click on the container to bring up the details and other items. There is a ton of good details here like Status, Healthcheck, Node, Networks and Ports. Here is an example with an active Healthcheck.
Moving on to logging.
With Docker Datacenter you have a few choices with logging. You can let Docker Datacenter handle it for you, or send all the logs remotely for the whole engine. In the Docker Datacenter UI, you are able to drill into each container’s logs.
If you want to use something like the syslog driver for remote logging you can modify the logging configuration from the Docker Datacenter admin settings. More info on the log drivers can be found here.
Next we can dive into the container itself.
Docker Datacenter has the ability to attach to a console session of the container remotely. You can use the console to dive into the running container. This is very useful if you need to check files, processes, settings or even ports. The trick with the console UI is that you need to have a shell inside your image. Most images will have sh or bash as part of their base image. Similar to viewing the container logs you will see a “Console” tab on the container’s info page. Notice it will try and use sh by default :
NOTE: By using the RBAC feature in Docker Datacenter you can configure access in many ways. For example you can give developers access through the GUI but not through SSH.
Next we need to talk about networking.
Issues can arise once your application is live and running. If you run into networking related issues, there are two good ways to troubleshoot through the containers console or the sidekick method. The console method should be the first step. Simply console into the container and curl/ping around. What if you don’t have curl in your image. Well simple docker run a base image attached to the same network overlay. With that base image you should be able to add ANY binaries that are needed for troubleshooting the network. You can even pre-build one for use within your infrastructure.
It is worth noting that the same container info page also has stats. The stats tab only displays the current stats for CPU, MEMORY, and NETWORK. However this can be useful is seeing if there are any bottlenecks.
Post Game and Wrap-up.
Start with the HEALTHCHECK endpoint. Check the logs, either remotely or locally. Then move onto the console to introspect the running container. Aggregating your logs can give you insight into all your apps and hosts at the same time. Remote logging to external systems like ELK or Splunk can give you that aggregate view. Stats can also be good for aggregation. CAdvisor or Sysdig’s containers can be plumbed up for combined historical metrics.
Hopefully you have a much better understanding of how to troubleshoot your running Dockerized applciations.
More resources for you:
See What’s New and Learn more about Docker Datacenter
Sign up for a free 30 day trial
Check out the Docker knowledge base for more tips
Tips for troubleshooting apps in production #DockerDatacenterClick To Tweet
The post Tips for Troubleshooting Apps in Production with Docker Datacenter appeared first on Docker Blog.
Quelle: https://blog.docker.com/feed/
Published by