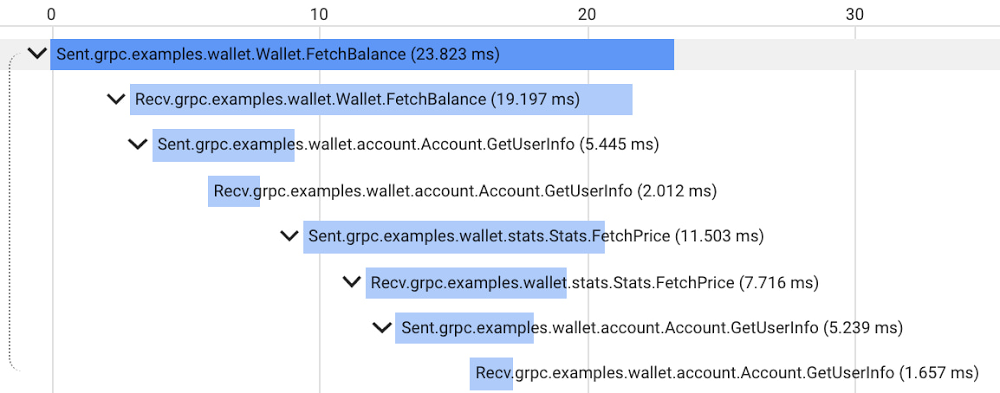
Proxyless gRPC applications in a service mesh now support many of the same features as deployments with a sidecar Envoy proxy, but in the past it has been difficult to get application-level insight into problems with specific nodes in the mesh. Today, we are happy to announce new tools, examples, and documentation to make it easier to debug your Proxyless gRPC applications. Proxyless gRPC now includes an admin API to allow live debugging of nodes in your mesh, and support for the xDS CSDS protocol to dive deeper into per-node control plane configurations to identify and resolve any issues. Further, we provide documentation and sample code illustrating how to add OpenCesus instrumentation to your gRPC clients and servers to send metric and tracing data to Cloud Monitoring and Cloud Trace.As a network library, gRPC provides some predefined admin services to make debugging easier. For example, there is a channel tracing service named Channelz (see gRPC blog). With Channelz, you can access the metrics about the requests going through each channel, like how many RPCs have been sent, how many succeeded or failed, and much more. Each existing admin service is packaged as a separate library, and the documentation of the predefined admin services is usually scattered. It can be time consuming to get the dependency management, module initialization, and library import right for each one of them. Recently, gRPC introduced admin interface APIs, which provide a convenient way to create a gRPC server to expose admin services. With this, any new admin services that you may add in the future are automatically available via the admin interface just by upgrading your gRPC version.Debugging a large service mesh can be a complex task. Unexpected routing behaviors could be due to a misconfiguration, unhealthy backends or issues in the control or data plane. As part of the admin interface API, gRPC can now expose the xDS configuration, the service mesh configuration that Traffic Director, our fully-managed service mesh, sends to gRPC applications. This configuration is exposed via the CSDS service, which you can easily start by using the admin interface APIs. Our grpcdebug CLI tool prints human-readable output based on the information it fetches from a target gRPC application.You can now also instrument gRPC C++, Go, and Java clients and servers with the OpenCensus library to send metrics and tracing to Cloud Monitoring and Cloud Trace. While gRPC’s OpenCensus integration has been available for a long time, our user guide and example code demonstrate clearly how to configure OpenCensus instrumentation in the context of a service mesh and ensure that traces are compatible across both Proxyless gRPC and Envoy-sidecar applications. After instrumenting your Proxyless gRPC application, you’ll be able to view traces such as the following example of our gRPC Wallet mesh:For more information about using gRPC with Traffic Director and these new features, see the following links:Traffic Director with proxyless gRPC services overviewRelated ArticleTraffic Director and gRPC—proxyless services for your service meshWith the addition of xDS API support, you can now use Traffic Director with proxyless gRPC services.Read Article
Quelle: Google Cloud Platform
Published by