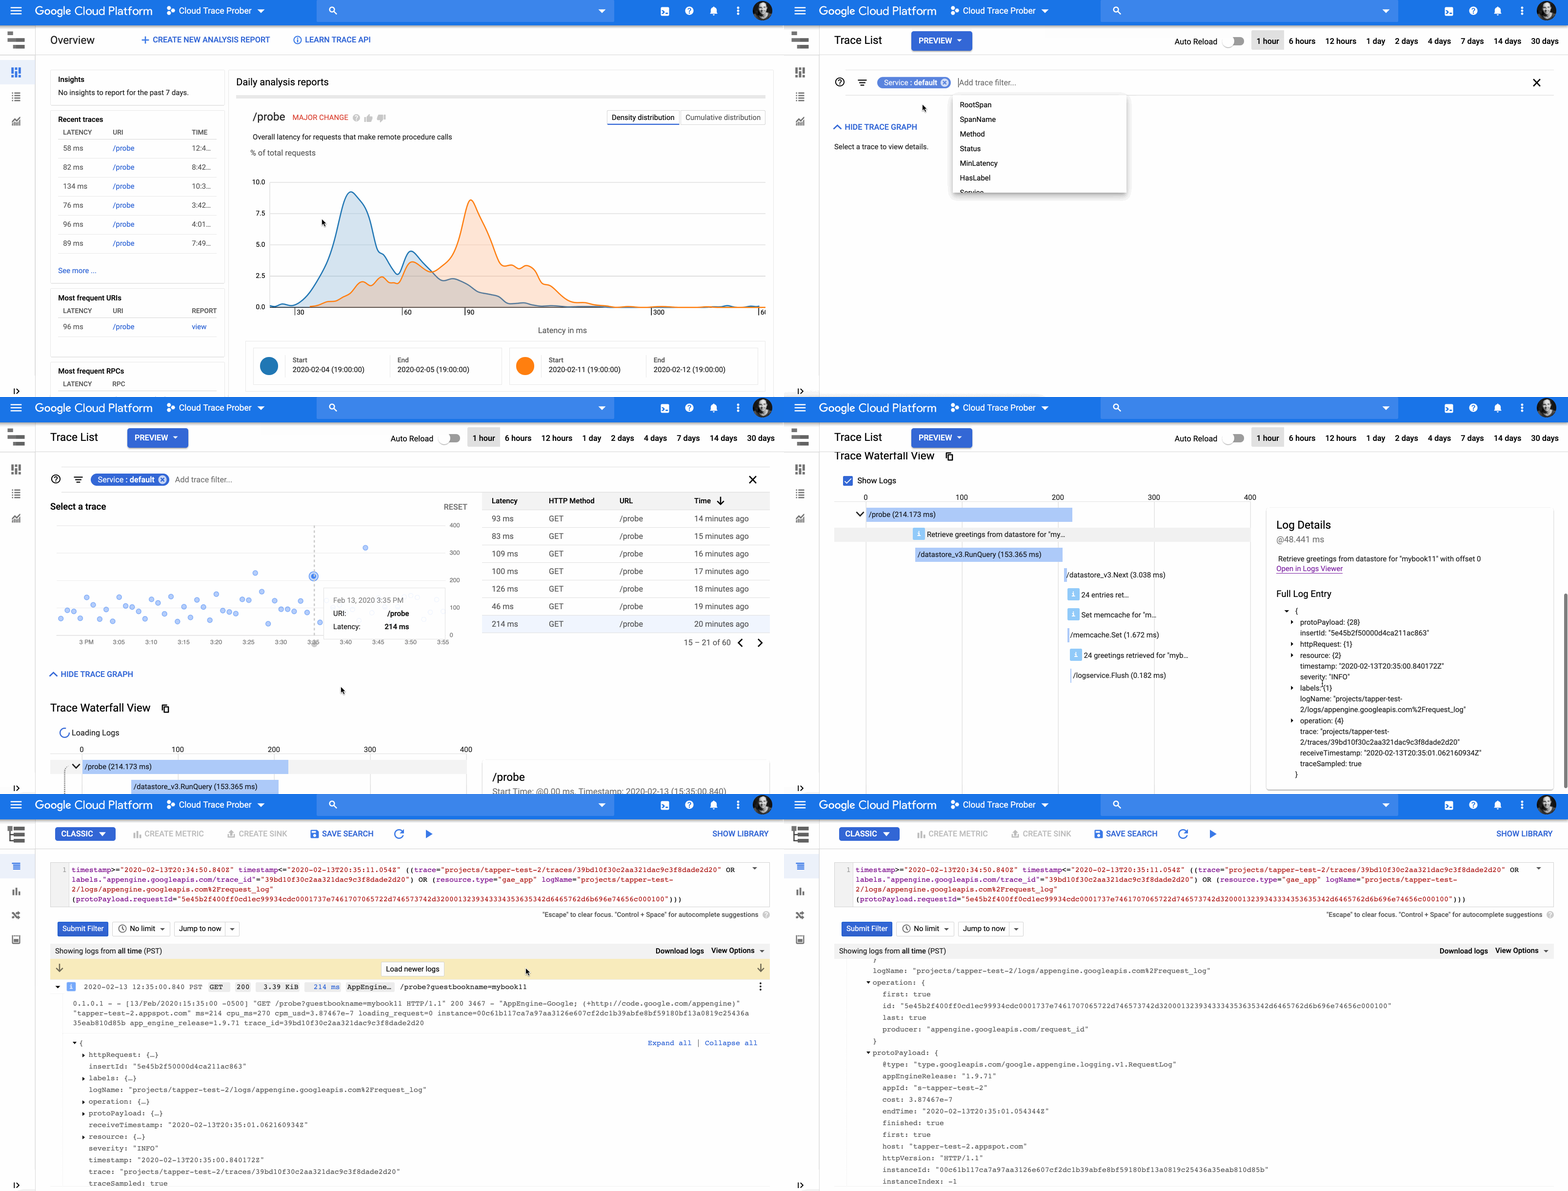
Meet Stackdriver Logging, a gregarious individual who loves large-scale data and is openly friendly to structured and unstructured data alike. Although they grew up at Google, Stackdriver Logging welcomes data from any cloud or even on-prem. Logging has many close friends, including Monitoring, BigQuery, Pub/Sub, Cloud Storage and all the other Google Cloud services that integrate with them. However, recently, they are looking for a deeper relationship to find insight.Now meet Stackdriver Trace, a brilliant and organized being. Trace also grew up at Google and is a bit more particular about data, making sense out of the chaos of distributed systems. Logging and Trace were brought together by mutual friends, such as Alex Van Boxel, cloud architect at Veepee. “Tracking down performance issues is like solving a murder mystery, having tracing and logging linked together is a big help for the forensics team,” he says. With a strong union, Trace and Logging are a match made in heaven: Developers are able to see exactly what is happening with their code, and how it fits within other services in the ecosystem. By embedding logs, Trace is able to show detail of what happened during a particular service call. Added to Trace’s ability to show the complete request, the user has full stack observability. By adding Trace IDs to logs, Logging is able to filter for logs within a trace, and link into end-to-end Traces. You can see not only how your code functions, but the context in which it does. What Trace loves most about Logging“Logging, you complete me“ — Trace Complete your workflow by showing logs inline for each service call. In the Trace UI, you can understand logs in context by showing logs in line as events for each service call.Drill into the logs that relate to a particular service in the logs view. You can understand how your code is operating at a deeper level by linking from the Trace UI right into the relevant log entry in Stackdriver Logging.Search across the entire request. In the Trace UI, you can filter for labels on any service in the trace, showing logs for a downstream service when an upstream condition is true.What Logging loves most about Trace“Trace, you help me be a better platform.” — LoggingSee logs from the entire request. In the logs viewer, filtering by Trace ID shows you all logs for that specific request.Drill into a trace of the complete request. In the logs viewer, you can drill into the trace of the complete request right from the log entry of interest, which helps understand richer and more complete context. Diagnose the root cause of errors. In the Trace UI, you can search for error traces, and easily see which downstream service is responsible for the error.Here’s how you can share the happy couple’s love: Explore the hidden superpowers of Stackdriver LoggingGet started with Stackdriver TraceGet started with LoggingAdd log Trace IDs to your application logs
Quelle: Google Cloud Platform

Published by