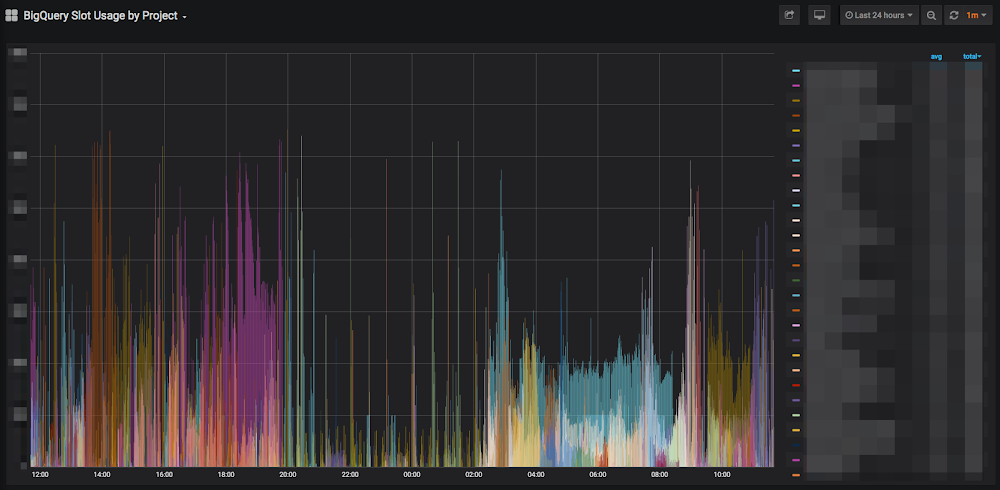
Editor’s note: We’re hearing today from DoiT International, a Google Cloud Premier and MSP partner, and two-time International Partner of the Year. They recently built a Grafana plugin for BigQuery, making it easier to visualize your data. Read on for details.At DoiT International, we see data problems of all shapes and sizes. From complexity analysis to large-scale system design, there are a variety of tools that can help solve our clients’ technology and analytical needs. But sometimes there’s a tool that seems so necessary that we create and share it ourselves.Which is why we built the Grafana plugin for BigQuery.We love BigQuery for its unparalleled capability to execute queries very fast over very large datasets, and often encourage our customers to use it. We also see how much our customers love using Grafana to visualize their time-series data for monitoring, alerts, analysis, or some combination thereof. The two seem like a natural match, yet until recently, there wasn’t a way to bring them together.Fortunately, Aviv Laufer, senior cloud engineer at DoiT International, found a way. Already familiar with the BigQuery API, he dug into the Grafana documentation and had a working prototype within a few weeks, and released a beta version shortly thereafter. After about a month, we’d solved the major bugs, become production-ready, and have been fielding feature requests from the community ever since.Monitoring big data operationsHundreds of companies are already taking advantage of the plugin so they can use both tools to their fullest extent. King, for instance, is using it to monitor the company’s big data operations. The mobile game developer, which famously brought the world Candy Crush Saga back in 2012, runs their data warehouse entirely in Google Cloud and uses BigQuery’s flat-rate subscription model. As King’s usage grew to support hundreds of projects, they were having trouble measuring slot utilization at the reservation or project level. They needed a better way to assess their usage patterns and query efficiency than scraping metrics from the Stackdriver API and consolidating those into yet another project to analyze with Grafana.Since King was already piloting an alpha of the flat-rate usage export into BigQuery, and was familiar with using Grafana with Stackdriver, the plugin let them tap into the best of both worlds. For example, the following short standard SQL query obtains slot usage by project:With the Grafana plugin, King was able to visualize the results of this query and get a clear picture of the activity across their more than 1,000 projects. Different projects use different amounts of slots, and the more dominant colors indicate which projects are using more slots than the others.Grafana visualization in dark modeAnother short query allows King to monitor their global slot usage. Below, they have a clear window into a 24-hour period:Grafana visualization in dark modeUsing the plugin to visualize BigQuery monitoring its own usage is just the beginning of how King may use the plugin in the future. King is now displaying BigQuery utilization on digital signage across all its offices to help the company interpret its usage data, ask new questions about it, and find ways to write queries (and manage its data warehouse) more efficiently. Visualizing billingAnother company benefiting from the one-two punch of BigQuery and Grafana is Travix, a global online travel company with operations in 39 countries. Travix is also a heavy user of BigQuery and Grafana, and when the plugin came out, they jumped on the opportunity to streamline their workflow.One of the critical areas Travix needs to monitor is SKUs. By exporting their billing information into BigQuery, Travix can analyze all their billing data. With a quick query and the Grafana plugin, Travix can see their top 10 GCP products and the associated costs on a given time frame.This lets them monitor how much they spend on Google Cloud and perform their own cost optimizations, and drill down into the costs of individual applications.Grafana visualization in light modeTravix is also using the plugin to measure their network traffic at 15-minute intervals. By defining events from Cloudflare logs as ingress and egress, they can see what their network traffic patterns are like, and monitor for any new trends or anomalies.Grafana visualization in light modeTravix also analyzes their access logs for slowly increasing response times, which would be invisible if looking at shorter periods of time. Using the Grafana pluginUsing BigQuery and Grafana together can apply to countless applications: dashboards analyzing logs, billing data, sales metrics, traffic analysis, tracking digital marketing campaigns, and probably many more we haven’t thought of yet. Getting started is as easy as downloading the plugin from the Grafana website, or cloning the open-source Github repository. We welcome your feedback on this plugin via Github, and we respond quickly to bugs and feature requests. We look forward to seeing what you can do!
Quelle: Google Cloud Platform
Published by