GKE best practices: Exposing GKE applications through Ingress and Services

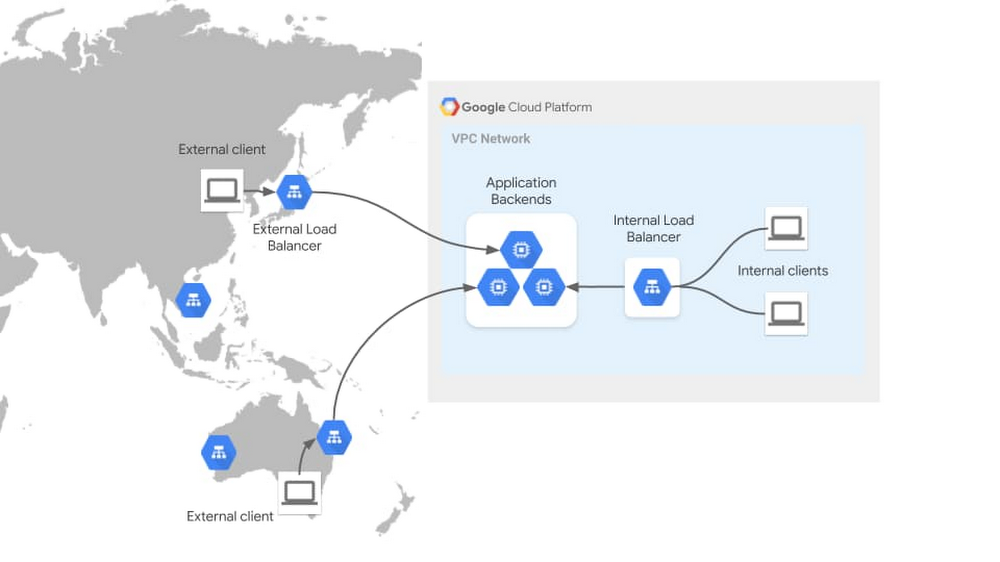
One critical part of designing enterprise applications running on Google Kubernetes Engine (GKE) is considering how your application will be consumed by its clients. This could be as simple as exposing your application outside the cluster, to be consumed by other internal clients, or might involve routing traffic to your application from public clients across the globe.How you should do this depends on many factors. Is the client from the internet or an internal network? Which networking protocols does the application speak? Is the application hosted in a single region or cluster, or is it deployed globally? Determining which solution to use to expose your application requires considering your application requirements in a few key areas. These requirements shouldn’t be assessed in isolation—you should look at them holistically to determine the most appropriate networking solution to expose your application.Let’s walk through the different factors that should be considered when exposing applications on GKE, explain how they impact application exposure, and highlight which networking solutions each requirement will drive you toward. Assuming you’re familiar with Kubernetes concepts such as Deployments, Services, and Ingress resources, we’ll differentiate between different exposure methods from internal, to external, to multi-cluster, and more.Understanding application exposureExposing an application to external clients involves three key elements, which together allow you to route traffic to your application: Frontend: The load balancer frontend defines the scope in which clients can access and send traffic to the load balancer. This is the network location that is listening for traffic—a network, a specific region or subnet within the network, one or more IPs in the network, ports, specific protocols, and TLS certificates presented to establish secure connections. Routing and load balancing: Routing and load balancing define how traffic is processed and routed. Traffic can be routed to services based on parameters such as protocol, HTTP headers, and HTTP paths. Depending on the load balancer you use, it may balance traffic across multiple zones or regions to provide lower latency and increased resiliency to your customers. Backends: Backends are defined by the type of endpoints, application platform, and backend service discovery integration. Specific application environments such as GKE are aided by service discovery integration, which updates load balancer backends dynamically as GKE endpoints come up and down. The following diagram illustrates these concepts for two very different types of traffic flows—external and internal traffic. The External HTTP(S) Load Balancer is listening for traffic on the public internet through hundreds of Google points of presence around the world. This global frontend allows traffic to be terminated at the edge, close to clients, before it load balances it to its backends in a Google data center. The Internal HTTP(S) load balancer depicted here listens within the scope of your VPC network, allowing private communications to take place internally. These load balancer properties make them suited for different kinds of application use cases.GKE load balancing through Ingress and Service controllersTo expose applications outside of a GKE cluster, GKE provides a built-in GKE Ingress controller  and GKE Service controller which deploy Google Cloud Load Balancers (GCLBs) on behalf of GKE users. This is the same VM load balancing infrastructure, except its lifecycle is fully automated and controlled by GKE. The GKE network controllers provide container-native Pod IP load balancing via opinionated, higher-level interfaces that conform to the Ingress and Service API standards. The following diagram illustrates how the GKE network controllers automate the creation of load balancers: An infrastructure or app admin deploys a declarative manifest against their GKE cluster. Ingress & Service controllers watch for GKE networking resources (such as Ingress or MultiClusterIngress objects) and deploy Cloud load balancers (plus IP addressing, firewall rules etc) based on the manifest. The controller continues managing the LB and backends based on environmental and traffic changes. Thus, GKE load balancing becomes a dynamic and self-sustaining load balancer with a simple and developer-oriented interface.Factors that influence application exposureThere are numerous factors that will influence choosing a method for exposing your application in GKE. There are a few core factors that live at the base of your decision tree and will help narrow down the set of networking solutions. These factors are client network, protocol, and application regionality.Client network refers to the network from where your application clients are accessing the application. This influences where the frontend of your load balancer should be listening. For example, clients could be within the same GKE cluster as the application. In this case, they would be accessing your application from within the cluster network, allowing them to use Kubernetes native ClusterIP load balancing. Clients could also be internal network clients, accessing your application from within the Google Cloud VPC or from your on-premises network across a Google Cloud Interconnect. Clients could also be external, accessing your application from across the public internet. Each type of network dictates a different load balancing topology.Protocol is the language your clients speak to the application. Voice, gaming, and low-latency applications commonly speak directly on top of TCP or UDP, requiring load balancers that have granular control at L4. Other applications speak HTTP, HTTPS, gRPC, or HTTP2, and require load balancers with explicit support of these protocols. Protocol requirements further define which kinds of application exposure methods are the best fit. Application regionality refers to the degree that your application is distributed across more than one GCP region or GKE cluster. Hosting a single instance of an application has different requirements than hosting an active-passive application across two independent GKE clusters. Hosting a geographically distributed application across five GKE clusters to place workloads closer to the end user for lower latency requires even more multi-cluster and multi-regional awareness for the load balancer.There may be additional factors that will influence your networking design that aren’t covered below—things like latency requirements, source IP address preservation, or high bandwidth. This list is not intended to be exhaustive, but should help you narrow down your solution options and increase your understanding of the trade-offs between requirements.Application exposure through Ingress and ServicesFortunately, GKE’s suite of native Ingress and Service controllers makes exposing applications seamless, secure, and production-ready by default. These network controllers are tightly integrated with GCLBs, allowing Kubernetes-native interfaces to deploy GCLBs that load-balance natively to container IPs. The following table breaks down all of the GKE Ingress and Service types and details their primary characteristics. For a more detailed comparison of all the GKE and Anthos Ingress capabilities see Ingress Features.There are many native options, all with different capabilities from a protocol, network access, and regional perspective. The following section categorizes these networking solutions by the factors discussed above. Client networkLoad balancers in GKE can broadly be categorized as internal and external load balancers. Internal refers to the VPC network which is an internal private network not directly accessible from the internet. External refers to the public internet. Note that ClusterIP Services are internal to a single GKE cluster so they are scoped to an even smaller network than the VPC network.*Public GKE clusters provide public and private IPs to each GKE node and so NodePort Services can be accessible internally and externally.ProtocolLoad balancers are often categorized as Layer 4, which route traffic based on network information like port and protocol, and Layer 7, which have awareness of application information like client sessions. GKE load balancers can also be categorized as L4 and L7, with specific protocol support in the table below.Application regionalityThe regionality of GKE load balancing solutions can be broken down into two areas:Backend scope (or cluster scope) refers to whether a load balancer can send traffic to backends across multiple GKE clusters. Ingress for Anthos (or multi-cluster Ingress) has the ability to expose a single VIP that directs traffic to pods from different clusters and different Google Cloud regions.Frontend scope refers to whether a load balancer IP listens within a single region or across multiple regions. All of the external load balancers listen on the internet, which is inherently multi-region, but some internal load balancers listen within a single region only.The table below breaks down the GKE load balancing solutions across these two dimensions.While these don’t cover every aspect of application networking, working through each of the factors above can help triangulate which solutions are best for your applications. Most GKE environments host many different types of applications, all with unique requirements, so it’s likely that you’ll be using more than one in any given cluster. For detailed information about their capabilities, check out some of the following resources:Ingress FeaturesMulti-Cluster Ingress (Ingress for Anthos)External IngressInternal IngressExternal LoadBalancer ServicesInternal LoadBalancer ServicesOther solutions for GKE application exposureThe Kubernetes ecosystem is vast, and the above solutions are not the only ones available for exposing applications. The solutions below may also be viable replacements or complements to the native GKE load balancers.In-cluster IngressIn-cluster Ingress refers to software Ingress controllers which have their Ingress proxies hosted inside the Kubernetes cluster itself. This is differentiated from Cloud Ingress controllers, which host and manage their load balancing infrastructure separately from the Kubernetes cluster. These third-party solutions are commonly self-deployed and self-managed by the cluster operator. istio-ingressgateway and nginx-ingress are two examples of commonly used and open source in-cluster Ingress controllers. The in-cluster Ingress controllers typically conform to the Kubernetes Ingress specification, and provide varying capabilities and ease of use. The open-source solutions are likely to require closer management and a higher level of technical expertise, but may suit your needs if they provide specific features your applications require. There is also a vast ecosystem of Enterprise Ingress solutions built around the open-source community which provide advanced features and enterprise support.Standalone NEGsGKE Ingress and Service controllers provide automated, declarative, and Kubernetes-native methods of deploying Google Cloud Load Balancing. There are also valid use cases for deploying load balancers manually for GKE backends, for example having direct and more granular control over the load balancer, or load balancing between container and VM backends. Standalone NEGs provide this ability by updating Pod backend IPs dynamically for a Network Endpoint Group (NEG), but allowing the frontend of the load balancer to be deployed manually through the Google Cloud API. This provides maximum and direct control of the load balancer while retaining dynamic backends controlled by the GKE cluster.Service meshService meshes provide client-side load balancing through a centralized control plane. While the Istio project introduced L7 service meshes to Kubernetes for internal communications, the service mesh ecosystem has rapidly expanded in scope and capabilities. Traffic Director and Anthos Service Mesh power the ability to load balance internal traffic across GKE clusters, across regions, and also between containers and VMs. This blurs the line between internal load balancing (east-west traffic) and application exposure (north-south traffic). With the flexibility and reach of modern service mesh control planes, it’s more likely than ever to have both the client and server within the same service mesh scope. The above GKE Ingress and Service solutions generally deploy middle-proxy load balancers for clients that do not have their own sidecar proxies. However, if a client and server are in the same mesh, then traditional application exposure can be handled via the mesh rather than middle-proxy load balancing.GKE at your serviceDepending on your use case, Google Cloud supports many different ways of exposing a GKE application as a service. We hope that it’s evident that GKE provides the most comprehensive support for all of your container use cases. If this blog post has helped you better understand how to architect application access, feel free to share it so that you can help others understand too.
Quelle: Google Cloud Platform

Updates to our Partner Advantage program help partners differentiate and grow their businesses

Our partners play an important role in all that we do, and we are always looking for ways to showcase and help them differentiate themselves in the market. Last year, we launched the Google Cloud Partner Advantage program to help them do exactly that. Since then, we’ve added new certifications,expanded our Expertise areas to cover new priority solutions, and added new specializations. According to our most recent Forrester study, certification, expertise, and specializations are three of the top areas partners talk about when it comes to growing their business—and it’s why all three play a key role in our program.Click to enlargeAs we look ahead to the second half of 2020, we wanted to share updates to the Partner Advantage program across several core areas.CertificationsRecognition as a certified professional on Google Cloud or G Suite is the first major step an individual can take to demonstrate their level of skill and knowledge on Google Cloud. We offer several learning and training opportunities of which you can take advantage:Use the certification interest form to get started on certifications.Take proctored exams online or at a local testing center. Click here to register.Consider learning opportunities such as Partner Certification Kickstart (PCK) programs that allow you to take accelerated, self-paced courses and hands-on training in six weeks or less. PCK Sprint, in particular, enables technical partners on GCP products through a mix of virtual classes, SME sessions and CloudHero games. Or Google Courses powered by Qwiklabs, which provides a central location for on demand training and hands on labs.Join upcoming webinars, such as the “Why Certify Now?” webcast on Wednesday, August 5. We’re also launching the Professional Machine Learning Engineer certification in October, so you can also register to learn more about the Professional Machine Learning Engineer certification.Customer successCustomer success is the driving force behind a partner’s entire differentiation journey. Highlighting your customer wins and showcasing what you do in the market along the way builds credibility. Customer success stories also help you meet eligibility requirements for Expertise (one public story required) and Specialization (at least three required). To help you easily share your customer wins, we’ve introduced a new customer success story tool to accelerate and simplify highlighting your phenomenal stories—find it on the Partner Advantage portal. While you can find a wealth of partner customer showcases on the Google Cloud Partner Directory, here are a few of the many great examples of customer success from our partners:Mondelēz and MightyHive: Personalizing CPG sales and marketing on a global scaleDxTerity and Pluto7: Using data-driven precision medicine to combat autoimmune diseaseMitsubishi Motors and Aeris Communications: Fueling customer engagement with the connected carExpertisePartner Expertise demonstrates your early customer success at a more granular level across products, priority solutions, and/or industries segments, based on a defined set of requirements, including customer evidence. All partners are welcome to apply for Partner Expertise, no matter the business model.New Expertise areas for which Partners can apply:Google MeetMainframe ModernizationMicrosoft on Google CloudMigrate Oracle Workloads to Google CloudOur partners continue to showcase their commitment via Expertise in solutions and industries:NORTHAM: Maven Wave, Pluto7 Consulting Inc, Softserve Inc., SpringMLEMEA: Ancoris, Cloudreach, Fourcast, PA Consulting GroupAPAC: Cloud Comrade, CloudMile Limited, Pluto Seven Business Solutions Private Limited, SearceLATAM: Colaborativa, Dedalus Prime, Qi Network, Safetec InformaticaJAPAN: Cloud Ace, Inc., EnisiasSpecializationPartner Specialization remains the highest level of achievement within the partner journey. It represents the strongest signal of proficiency and experience with Google Cloud, while helping you maintain a consistent practice that delights the customer. Congratulations to all of our partners who have achieved this milestone or renewed in 1H 2020:Application DevelopmentInfogain Corporation | PA CONSULTING GROUP | Qvik Ltd | SpringMLCloud Migration CLOUD COMRADEData AnalyticsAtosEducationCLOUDPOINT OY | Deploy Learning | Five-Star Technology Solutions | Foreducation EdTech | Gestion del conocimiento digital ieducando | NUVEM MESTRA | OPENNETWORKS | STREET SMART Inc.InfrastructureAppsbroker Limited | Cloudbakers | CLOUDPILOTS | Cognizant | Opticca Consulting Machine LearningiKala | NT ConceptsMarketing AnalyticsAliz Technologies | SingleViewTrainingJellyfish Training | LearnQuestWork TransformationCloudypedia | eSource Capital | Huware Srl | Intelligence Partner | NGC (New Generation Cloud) | Softline | TS CloudWork Transformation EnterpriseDavinci Technologies | NextNovate|  Nubalia | S&E Cloud Experts | Safetec Informática|  Softline  Vodafone | Wipro LimitedAnnouncing two new Specialization areasWe are also pleased today to announce two new Specialization areas: SAP on Google Cloud and Data Management. Congratulations to our launch partners who are blazing the trail in these new areas.Data Management Cognizant | Deloitte | DoIt | PythianSAP on Google CloudAccenture | Deloitte | HCL | ManageCore  | Tech MahindraTake the journey with us! For our partners who want to accelerate their Partner Advantage Differentiation journey today, please fill out this form and we will contact you directly. Looking for a partner in your region who has achieved an expertise and/or specialization? Search our global Partner Directory. Not yet a Google Cloud partner? Visit Partner Advantage and learn how to become one today!
Quelle: Google Cloud Platform

GKE best practices: Designing and building highly available clusters

Like many organizations, you employ a variety of risk management and risk mitigation strategies to keep your systems running, including your Google Kubernetes Engine (GKE) environment. These strategies ensure business continuity during both predictable and unpredictable outages, and they are especially important now, when you are working to limit the impact of the pandemic on your business.In this first of two blog posts, we’ll provide recommendations and best practices for how to set up your GKE clusters for increased availability, on so-called Day 0. Then, stay tuned for a second post, which describes high availability best practices for Day 2, once your clusters are up and running. When thinking about the high availability of GKE clusters, Day 0 is often overlooked because many people think about disruptions and maintenance as being part of ongoing Day 2 operations. In fact, it is necessary to carefully plan the topology and configuration of your GKE cluster before you deploy your workloads.Choosing the right topology, scale, and health checks for your workloadsBefore you create your GKE environment and deploy your workloads, you need to decide on some important design points. Pick the right topology for your clusterGKE offers two types of clusters: regional and zonal. In a zonal cluster topology, a cluster’s control plane and nodes all run in a single compute zone that you specify when you create the cluster. In a regional cluster, the control plane and nodes are replicated across multiple zones within a single region.Regional clusters consist of a three Kubernetes control planes  quorum, offering higher availability than a zonal cluster can provide for your cluster’s control plane API. And although existing workloads running on the nodes aren’t impacted if a control plane(s) is unavailable, some applications are highly dependent on the availability of the cluster API. For those workloads, you’re better off using a regional cluster topology. Of course, selecting a regional cluster isn’t enough to protect a GKE cluster either: scaling, scheduling, and replacing pods are the responsibilities of the control plane, and if the control plane is unavailable, that can impact your cluster’s reliability, which can only resume once the control plane becomes available again.You should also remember that regional clusters have redundant control planes as well as nodes. In a regional topology, nodes are redundant across different zones, which can cause costly cross-zone network traffic.Finally, although regional cluster autoscaling makes a best effort to spread resources among the three zones, it does not rebalance them automatically unless a scale up/down action occurs.To summarize, for higher availability of the Kubernetes API, and to minimize disruption to the cluster during maintenance on the control plane, we recommend that you set up a regional cluster with nodes deployed in three different availability zones—and that you pay attention to autoscaling.Scale horizontally and verticallyCapacity planning is important, but you can’t predict everything. To ensure that your workloads operate properly at times of peak load—and to control costs at times of normal or low load—we recommend exploring GKE’s autoscaling capabilities that best fit your needs.Enable Cluster Autoscaler to automatically resize your nodepool size based on demand.Use Horizontal Pod Autoscaling to automatically increase or decrease the number of pods based on utilization metrics.Use Vertical Pod Autoscaling (VPA) in conjunction with Node Auto Provisioning (NAP a.k.a., Nodepool Auto Provisioning) to allow GKE to efficiently scale your cluster both horizontally (pods) and vertically (nodes).VPA automatically sets values for CPU, memory requests, and limits for your containers. NAP automatically manages node pools, and removes the default constraint of starting new nodes only from the set of user created node pools.The above recommendations optimize for cost. NAP, for instance, reduces costs by taking down nodes during underutilized periods. But perhaps you care less about cost and more about latency and availability—in this case, you may want to create a large cluster from the get-go and use GCP reservations to guarantee your desired capacity. However, this is likely a more costly approach.Review your default monitoring settingsKubernetes is great at observing the behavior of your workloads and ensuring that load is evenly distributed out of the box. Then, you can further optimize workload availability by exposing specific signals from your workload to Kubernetes. These signals, Readiness and Liveness signals, provide Kubernetes additional information regarding your workload, helping it determine whether it is working properly and ready to receive traffic. Let’s examine the differences between readiness and liveness probes.Every application behaves differently: some may take longer to initiate than others; some are batch processes that run for longer periods and may mistakenly seem unavailable. Readiness and liveness probes are designed exactly for this purpose—to let Kubernetes know the workloads’ acceptable behavior. For example, an application might take a long time to start, and during that time, you don’t want Kubernetes to start sending customer traffic to it, since it’s not yet ready to serve traffic yet. With a readiness probe, you can provide an accurate signal to Kubernetes for when an application has completed its initialization and is ready to serve your end users.Make sure you set up readiness probes to ensure Kubernetes knows when your workload is really ready to accept traffic. Likewise, setting up a liveness probe tells Kubernetes when a workload is actually unresponsive or just busy performing CPU-intensive work.Finally, readiness and liveness probes are only as good as they are defined and coded. Make sure you test and validate any probes that you create.Correctly set up your deploymentEach application has a different set of characteristics. Some are batch workloads, some are based on stateless microservices, some on stateful databases. To ensure Kubernetes is aware of your application constraints, you can use Kubernetes Deployments to manage your workloads. A Deployment describes the desired state, and works with the Kubernetes schedule to change the actual state to meet the desired state.Is your application stateful or not?If your application needs to save its state between sessions, e.g., a database, then consider using StatefulSet, a Kubernetes controller that manages and maintains one or more Pods in a way that properly handles the unique characteristics of stateful applications. It is similar to other Kubernetes controllers that manage pods like ReplicaSets and Deployments. But unlike Deployments, Statefulset does not assume that Pods are interchangeable.To maintain a state, StatefulSet also needs Persistent Volumes so that the hosted application can save and restore data across restarts. Kubernetes provides Storage Classes, Persistent Volumes, and Persistent Volume Claims as an abstraction layer above Cloud Storage.Understanding Pod affinityDo you want all replicas to be scheduled on the same node? What would happen if that node were to fail? Would it be ok to lose all replicas at once? You can control the placement of your Pod and any of its replicas using Kubernetes Pod affinity and anti-affinity rules.To avoid a single point of failure, use Pod anti-affinity to instruct Kubernetes NOT to co-locate Pods on the same node. For a stateful application, this can be a crucial configuration, especially if it requires a minimum number of replicas (i.e., a quorum) to run properly.For example, Apache ZooKeeper needs a quorum of servers to successfully commit mutations to data. For a three-server ensemble, two servers must be healthy for writes to succeed. Therefore, a resilient deployment must ensure that servers are deployed across failure domains. Thus, to avoid an outage due to the loss of a node, we recommend you preclude co-locating multiple instances of an application on the same machine. You can do this by using Pod anti-affinity.On the flip side, sometimes you want a group of Pods to be located on the same node, benefitting from their proximity and therefore from less latency and better performance when communicating with one another. You can achieve this using Pod affinity.For example, Redis, another stateful application, may be providing in-memory cache for your web application. In this deployment, you would want the web server to be co-located with the cache as much as possible to avoid latency and boost performance.Anticipate disruptionsOnce you’ve configured your GKE cluster and the applications running on it, it’s time to think about how you will respond in the event of increased load or a disruption. Going all digital requires better capacity planningRunning your Kubernetes clusters on GKE frees you up from thinking about physical infrastructure and how to scale it. Nonetheless, performing capacity planning is highly recommended, especially if you think you might get increased load.Consider using reserved instances to guarantee any anticipated burst in resources demand. GKE supports specific (machine type and specification) and non-specific reservations. Once the reservation is set, nodes will automatically consume the reservations in the background from a pool of resources reserved uniquely for you.Make sure you have a support planGoogle Cloud Support is a team of engineers around the globe working 24×7 to help you with any issues you may encounter. Now, before you’re up and running and in production, is a great time to make sure that you’ve secured the right Cloud Support plan to help you in the event of a problem. Review your support plan to make sure you have the right package for your business.Review your support user configurations to make sure your team members can open support cases.Make sure you have GKE Monitoring and Logging enabled on your cluster; your technical support engineer will need these logs and metrics to troubleshoot your system.If you do not have GKE Monitoring and Logging enabled, consider enabling the new beta system-only logs feature to collect only logs that are critical for troubleshooting.Bringing it all togetherContainerized applications are portable, easy to deploy and scale. GKE, with its wide range of cluster management capabilities, makes it even easier to run your workloads hassle-free. You know your application best, but by following these recommendations, you can drastically improve the availability and resilience of your clusters. Have more ideas or recommendations? Let us know! And stay tuned for part two of this series, where we talk about how to respond to issues in production clusters.
Quelle: Google Cloud Platform

Bringing multi-cloud analytics to your data with BigQuery Omni

Today, we are introducing BigQuery Omni, a flexible, multi-cloud analytics solution that lets you cost-effectively access and securely analyze data across Google Cloud, Amazon Web Services (AWS), and Azure (coming soon), without leaving the familiar BigQuery user interface (UI). Using standard SQL and the same BigQuery APIs our customers love, you will be able to break down data silos and gain critical business insights from a single pane of glass. And because BigQuery Omni is powered by Anthos, you will be able to query data without having to manage the underlying infrastructure.A recent Gartner research survey on cloud adoption revealed that more than 80% of respondents using the public cloud were using more than one cloud service provider (CSP)1. While data is a critical component of decision making across organizations, for many, this data is scattered across multiple public clouds. BigQuery Omni is an extension of our continued innovation and commitment to multi-cloud, bringing you the best analytics and data warehouse technology, no matter where your data is stored. How BigQuery Omni works The cost of moving data between cloud providers isn’t sustainable for many businesses, and it’s still difficult to seamlessly work across clouds. BigQuery Omni represents a new way of analyzing data stored in multiple public clouds, which is made possible by BigQuery’s separation of compute and storage. By decoupling these two, BigQuery provides scalable storage that can reside in Google Cloud or other public clouds, and stateless resilient compute that executes standard SQL queries. Until now, though, in order to use BigQuery, your data had to be stored in Google Cloud. While competitors will require you to move or copy your data from one public cloud to another, where you might incur egress costs, this is not the case with BigQuery Omni. The same BigQuery interface on Google Cloud will let you query the data that you have stored in Google Cloud, AWS and Azure without any cross-cloud movement or copies of data. BigQuery Omni’s query engine runs the necessary compute on clusters in the same region where your data resides. For example, you can use BigQuery Omni to query Google Analytics 360 Ads data that’s stored in Google Cloud, and also query logs data from your e-commerce platform and applications that are stored in AWS S3. Then, using Looker, you can build a dashboard that allows you to visualize your audience behavior and purchases alongside your advertising spend. BigQuery Omni runs on Anthos clusters that are fully managed by Google Cloud, allowing you to securely execute queries on other public clouds. Our Anthos hybrid and multi-cloud application platform allowed us to build, deploy, and manage the BigQuery query engine (Dremel) on multiple clouds. When developing BigQuery Omni, we knew that a consistent and unified operations experience was critical to supporting our customers. Here’s what the architecture looks like:With BigQuery Omni, you can:Break down silos and gain insights on data. Power your business across clouds with a flexible, multi-cloud analytics solution. There’s no need to move or copy data from other public clouds into Google Cloud for analysis. Tap into the power of BigQuery to cost-efficiently break down data silos and make analytics work for you. Get a consistent data experience across clouds. Enjoy a unified analytics experience across your datasets, in Google Cloud, AWS and Azure (coming soon). Use standard SQL and BigQuery’s familiar interface to write queries and build dashboards across your data. Quickly answer questions and share results from a single interface.Enable flexibility powered by Anthos. Securely run analytics to another public cloud with a fully managed infrastructure, powered by Anthos. This means that you can query data without worrying about the underlying infrastructure. Compute resources run in the same cloud region data is stored, allowing you to have a completely seamless data analysis experience.Getting started with an already familiar interface in BigQuery OmniStart in the BigQuery UI on Google Cloud, choose the public cloud region where your data is located, and run your query. There’s no need to format or transform your data—BigQuery Omni supports Avro, CSV, JSON, ORC, and Parquet. You don’t need to move or copy your raw data out of the other public cloud, manage clusters, or provision resources. Computation occurs within BigQuery’s multi-tenant service running on the AWS region where the data is currently located.Behind the scenes, BigQuery’s query engine is running on our Anthos clusters within the BigQuery managed service. BigQuery gets the data from data storage within your account once you’ve authorized permissions via your other public clouds’ IAM roles. Note that data is moved temporarily within AWS from your data storage to the BigQuery clusters running on Anthos to execute queries.Choose to have the query results returned to Google Cloud to see them in the BigQuery UI.Or, you can export the results directly back to your data storage, with no cross-cloud move of results or data.BigQuery Omni is currently in private alpha. If you’re interested in trying it out, fill out this form. And check out our Google Cloud Next ‘20: OnAir session in August: Analytics in a multi-cloud world.1. Gartner, The Future of Cloud Data Management is Multicloud, December 2019
Quelle: Google Cloud Platform

Compliance without compromise: Introducing Assured Workloads for Government

As U.S. government agencies and the enterprises that serve them adopt cloud technologies, security and compliance requirements around data locality and personnel access are key considerations. To meet these requirements, many cloud providers have built separate environments, with standalone data centers, to run government workloads. But these “government clouds” don’t come with the technology and benefits that a modern commercial cloud provides, and often require users to operate two distinct application and operation supply chains, adding cost, complexity, and risk.At Google Cloud, we believe that compliance shouldn’t require compromising functionality or service availability. Today, we’re introducing Assured Workloads for Government, currently in private beta, to help you serve your government workloads without the compromises of traditional “government clouds.” This service simplifies the compliance configuration process and provides seamless platform compatibility between government and commercial cloud environments. With Assured Workloads for Government, Google Cloud customers can quickly and easily create controlled environments where U.S. data location and personnel access controls are automatically enforced in any of our U.S. cloud regions. Assured Workloads for Government helps government customers, suppliers, and contractors meet the high security and compliance standards set forth by the Department of Defense (i.e., IL4), the FBI’s Criminal Justice Information Services Division (CJIS), and the Federal Risk and Authorization Management Program (FedRAMP), while still having access to all the latest features in our portfolio.At Deloitte, our goal is to enable our clients to modernize, adopt new technologies, and innovate quickly. For our regulated government customers, Assured Workloads for Government provides a differentiated ‘government cloud’ capability that reduces the friction of compliance while providing access to Google Cloud’s latest technologies. DeloitteHow it worksTo help you take advantage of our best-in-class infrastructure and services, while supporting your compliance needs, Assured Workloads gives you access to the following features:Automatic enforcement of data location: Meet U.S. government compliance requirements by choosing to store data at rest in U.S. regions.  Personnel access: At Google Cloud, we do not access customer data for any reasons other than in accordance with our contracts with you. With Assured Workloads, you’ll be able to limit Google support personnel access based on predefined attributes such as citizenship, a particular geographical access location, and background checks.Built-in security controls: Reduce the risk of accidental misconfigurations by choosing from available platform security configurations—we’ll help put the controls in place.Automatic enforcement of product deployment location: Restrict the deployment of new resources to specific Google Cloud regions based on Organization Policy.Assured Workloads Support (coming in Q4): Receive Premium Support from a U.S. Person, in a U.S. Location, 24/7, with 15-minute target SLOs for P1 cases, to help meet compliance requirements. (This requires additional support services purchase.) Configure a new Assured Workloads environment in alignment with your compliance needs.Compliance with confidenceAssured Workloads for Government helps reduce the risk and toil of running compliant workloads, without sacrificing functionality, so you can focus on all the other important tasks your business deals with every day. We look forward to making Assured Workload generally available, with Beta features, this fall. To learn more about how Assured Workloads for Government can help your organization, click here.
Quelle: Google Cloud Platform

Announcing C2C, an independent community to serve, educate and connect Google Cloud customers

Over the last several months, I’ve seen first-hand how the power of knowledge-sharing and community has galvanized our customers in the face of an unprecedented global pandemic. Our customers are asking important questions, forging partnerships, and creating real solutions to today’s most challenging problems by harnessing the power of the cloud, and each other. It’s been nothing short of inspiring. We know from experience that when we support our customers and expand their access to insights and community, there’s no limit to what they can achieve.That’s why we’re excited today to launch a new, independent community for our customers, C2C (Customer to Community). C2C is a platform that will bring together IT executives, developers, and other cloud professionals from Google Cloud customers across the globe. By building a community where our customers can learn, connect, and share knowledge, we can harness our collective power to create an even better cloud to address customer needs.Customers who join C2C will receive exclusive networking opportunities, as well as visibility into the Google Cloud ecosystem, with benefits such as:Opportunities to make connections and learn from other customers, including sharing knowledge and best practices through virtual and in-person events;Expanded access to Google Cloud experts and content, such as knowledge forums, white papers, and methodologies;Early and exclusive access to Google Cloud product roadmaps, with opportunities to provide feedback and act as customer-advisors.Today, we’re inviting all customers in North America and EMEA to join C2C, and we look forward to expanding the community to more regions and more customers in the coming weeks and months. So click here to join us today and, together, let’s shape the future of the cloud.
Quelle: Google Cloud Platform

Google Cloud Next ‘20: OnAir—Accelerating digital transformation in the cloud

Today, I am excited to welcome you to Google Cloud Next ‘20: OnAir, our first digital event series that gives our community an opportunity to learn from top industry leaders and get inspired by our latest cloud innovations. As we’ve all experienced, the COVID-19 pandemic has fundamentally changed how we live and work—for citizens, communities and organizations. At Google Cloud, we’ve been touched by how heroically and graciously people and organizations everywhere have stepped up to the challenge, and we have been humbled by the opportunity to support them during this period of profound change. Remote work, telemedicine, digital banking and distance learning have all become new standards in today’s environment. As we face a period of gradual recovery, we see organizations shifting to digital models to sell to and service customers, to deliver products and services and even to design and manufacture products. These changes have driven many organizations to modernize their technology infrastructure rapidly using the cloud to pivot quickly, optimize costs and prepare for the future. Our mission at Google Cloud is to accelerate our customers’ ability to digitally transform and reimagine their businesses through data-powered innovation. We offer three primary capabilities to help you: global-scale distributed infrastructure as a service, a digital transformation platform, and industry-specific solutions powered by Google’s AI and machine learning advances. We continue to see organizations across various industries place their trust in Google Cloud because of the differentiated technology we provide to help them solve real business problems. This includes several leading global companies we’ve recently announced such as Deutsche Bank, FOX Sports, Procter & Gamble, Group Renault, Telefónica and Verizon—to name just a few.Over the past year, we’ve made many significant advances in our technology and we have several important updates to share with you as we kick off Next OnAir. Here are just a few of the important areas where we are introducing new capabilities:Infrastructure enhancements: We continue to expand our global footprint, opening several new regions over the last year, with plans for many more. We have introduced new capabilities in compute with expanded availability of our Bare Metal solution; in storage with our high scale file solutions; and in new networking with enhancements to our CDN, Cloud Armor, and Network Intelligence Center solutions. We have also introduced important new machine learning-powered capabilities to make our infrastructure significantly easier for you to use.Multi-cloud application modernization: We continue to see rapid uptake of Anthos and have introduced new capabilities that bring Anthos to bare metal hybrid environments, and to other clouds including Microsoft Azure and AWS. We also continue to build tools to help you migrate and modernize a broad array of enterprise workloads to Google Cloud. Multi-cloud analytics: We are introducing BigQuery Omni, our new multi-cloud analytics solution—powered by Anthos—which extends our analytics platform to other public clouds, allowing you to use BigQuery’s familiar interface to break down data silos and create actionable business insights, all from a single pane of glass. We are also introducing new capabilities to make analytics significantly easier with new natural language interfaces and enhancements to Looker, our enterprise analytics offering.More control over data: Also new today is Confidential VMs, the first product in our Confidential Computing portfolio, which lets you run workloads in Google Cloud while ensuring your data is encrypted, not only at rest and in transit, but while it’s being processed as well. This helps remove cloud adoption barriers for customers in highly-regulated industries.Additional compliance controls: We are also announcing Assured Workloads for Government, which allow you to automatically apply controls to your workloads, making it easier for customers to comply with things like data location and personnel access requirements. Industry-specific solutions: We continue to enhance our roadmap for industry-specific solutions across retail, financial services, communications, healthcare and manufacturing. One important example is the new capabilities we have introduced to help you harness 5G as a business services platform. Our Global Mobile Edge Cloud strategy will deliver a portfolio and marketplace of 5G solutions built jointly with telecommunications companies; an open cloud platform for developing these network-centric applications; and a global distributed edge for optimally deploying these solutions. These are only a few of the new product innovations and customer stories we’re showcasing over the course of Next OnAir. Throughout the next nine weeks, we’ll be exploring in detail all the ways we’re building on these and other announcements with an aim toward supporting you no matter where you are in your cloud journey. Our Sales, Customer Engineering, and Customer Service teams are here to support you with industry knowledge and technology expertise to meet your needs. We are also grateful for the broad network of partners who help us create and deliver new solutions to our customers. Together, with all of the Googlers who help support our customers each and every day, I invite you to join us as we kick off Next OnAir.
Quelle: Google Cloud Platform

Next OnAir as it happens: All the announcements in one place

Across our keynote presentations and breakout sessions over the nine weeks of Google Cloud Next ‘20: OnAir, we’ll be sharing a wealth of news and updates on all things cloud. And we want to make sure you don’t miss a thing. Check back in with this blog each week to see a running list of what’s happened—and what’s to come.Week 1From major customer news, to solutions for every industry, to first-of-its-kind product announcements, week one of Next OnAir kicked off with a bang.After an inspiring intro from Alphabet and Google CEO Sundar Pichai, Next OnAir kicked off with Google Cloud CEO Thomas Kurian sharing an overview of our strategy and how we’re helping businesses grow and transform digitally. Read Thomas’ blog post or watch the keynote.We shared a number of new customer stories including our work with Deutsche Bank, FOX Sports, Procter & Gamble, Group Renault, Telefónica and Verizon.We announced BigQuery Omni, in private alpha, a flexible, multi-cloud analytics solution, powered by Anthos, that allows you to cost-effectively access and securely analyze data stored across Google Cloud, AWS, and Azure (coming soon), all without leaving the familiar BigQuery user interface. We announced our first Confidential Computing product—Confidential VMs (beta)—a breakthrough technology which encrypts data in-use—while it is being processed. We announced Assured Workloads for Government (in private beta) to help US government agencies, and the enterprises that serve them, serve government workloads without the compromises of traditional “government clouds.” We’re launching C2C, a new, independent community where our customers can learn, connect, and share knowledge. We announced the Google Cloud ISV/SaaS Center of Excellence (CoE), a new resource to help independent software vendor (ISVs) transform their applications with open, cloud-agnostic architectures, improve user experience through AI/ML and voice, and deliver intelligent insights from their applications by providing rich analytics to business users.You’re invited to join usGoogle Cloud Next ‘20 OnAir is running now through Sep 8, 2020, offering nine full weeks of programming to help you solve your toughest business challenges in the cloud. And the best part is you can join in, for free, no matter where you are, and at a time that works for you. Haven’t yet registered? Get started at g.co/cloudnext.
Quelle: Google Cloud Platform

AutoML Tables: end-to-end workflows on AI Platform Pipelines

AutoML Tables lets you automatically build, analyze, and deploy state-of-the-art machine learning models using your own structured data. It’s useful for a wide range of machine learning tasks, such as asset valuations, fraud detection, credit risk analysis, customer retention prediction, analyzing item layouts in stores, solving comment section spam problems, quickly categorizing audio content, predicting rental demand, and more.To help make AutoML Tables more useful and user friendly, we’ve released a number of new features, including:An improved Python client libraryThe ability to obtain explanations for your online predictionsThe ability to export your model and serve it in a container anywhereThe ability to view model search progress and final model hyperparameters in Cloud LoggingThis post gives a tour of some of these new features via a Cloud AI Platform Pipelines example that shows end-to-end management of an AutoML Tables workflow. Cloud AI Platform Pipelines provides a way to deploy robust, repeatable machine learning pipelines along with monitoring, auditing, version tracking, and reproducibility, and delivers an enterprise-ready, easy to install, secure execution environment for your ML workflows. About our example pipelineThe example pipeline creates a dataset, imports data into the dataset from a BigQuery view, and trains a custom model on that data. Then, it fetches evaluation and metrics information about the trained model, and based on specified criteria about model quality, uses that information to automatically determine whether to deploy the model for online prediction. Once the model is deployed, you can make prediction requests, and obtain prediction explanations as well as the prediction result.The example also shows how to scalably serve your exported trained model from your Cloud AI Platform Pipelines installation for prediction requests.You can manage all the parts of this workflow from the Cloud Console Tables UI, as well, or programmatically via a notebook or script. But specifying this process as a workflow has some advantages: the workflow becomes reliable and repeatable, and Pipelines makes it easy to monitor the results and schedule recurring runs.For example, if your dataset is updated regularly—say once a day— you could schedule a workflow to run daily, each day building a model that trains on an updated dataset. (With a bit more work, you could also set up event-based triggering pipeline runs, for example when new data is added to a Google Cloud Storage bucket.)About our example dataset and scenarioThe Cloud Public Datasets Program makes available public datasets that are useful for experimenting with machine learning. To stay consistent with our previous post, Explaining model predictions on structured data, for our examples, we’ll use data that is essentially a join of two public datasets stored in BigQuery: London Bike rentals and NOAA weather data, with some additional processing to clean up outliers and derive additional GIS and day-of-week fields. Using this dataset, we’ll build a regression model to predict the duration of a bike rental based on information about the start and end rental stations, the day of the week, the weather on that day, and other data. If we were running a bike rental company, we could use these predictions—and their explanations—to help us anticipate demand and even plan how to stock each location.While we’re using bike and weather data here, as we mentioned above you can use AutoML Tables for a wide variety of tasks.Using Cloud AI Platform Pipelines to orchestrate a Tables workflowCloud AI Platform Pipelines, now in Beta, provides a way to deploy robust, repeatable machine learning pipelines along with monitoring, auditing, version tracking, and reproducibility. It also delivers an enterprise-ready, easy to install, secure execution environment for your ML workflows. AI Platform Pipelines is based on Kubeflow Pipelines (KFP) installed on a Google Kubernetes Engine (GKE) cluster, and can run pipelines specified via both the KFP and TFX SDKs. See this blog post for more detail on the Pipelines tech stack.You can create an AI Platform Pipelines installation with just a few clicks. After installing, you access AI Platform Pipelines by visiting the AI Platform Panel in the Cloud Console. (See the documentation as well as the sample’s README for installation details.)Upload and run the Tables end-to-end PipelineOnce a Pipelines installation is running, we can upload the example AutoML Tables pipeline. Click on Pipelines in the left nav bar of the Pipelines Dashboard, then on Upload Pipeline. In the form, leave Import by URLselected, and paste in this URL: https://storage.googleapis.com/aju-dev-demos-codelabs/KF/compiled_pipelines/tables_pipeline_caip.py.tar.gz. The link points to the compiled version of this pipeline, specified using the Kubeflow Pipelines SDK. The uploaded pipeline will look similar to this:The uploaded Tables “end-to-end” pipeline.Next, click the +Create Run button to run the pipeline. You can check out the example’s README for details on configuring the pipeline’s input parameters. You can also schedule a recurrent set of runs, instead. If your data is in BigQuery—as is the case for this example pipeline—and has a temporal aspect, you could define a view to reflect that, e.g. to return data from a window over the last N days or hours. Then, the AutoML pipeline could specify ingestion of data from that view, grabbing an updated data window each time the pipeline is run, and building a new model based on that updated window.The steps executed by the pipelineThe example pipeline creates a dataset, imports data into the dataset from a BigQuery view, and trains a custom model on that data. Then, it fetches evaluation and metrics information about the trained model, and based on specified criteria about model quality, uses that information to automatically determine whether to deploy the model for online prediction. In this section, we’ll take a closer look at each of the pipeline steps and how they’re implemented. You can also inspect your custom model graph in TensorBoard and export it for serving in a container, as described in a later section.Create a Tables dataset and adjust its schemaThis pipeline creates a new Tables dataset, and ingests data from a BigQuery table for the “bikes and weather” dataset described above. These actions are implemented by the first two steps in the pipeline—the automl-create-dataset-for-tables and automl-import-data-for-tables steps.While we’re not showing it in this example, AutoML Tables supports ingestion from BigQuery views as well as tables. This can be an easy way to do feature engineering: leveraging BigQuery’s rich set of functions and operators to clean and transform your data before you ingest it.When the data is ingested, AutoML Tables infers the data type for each field (column). In some cases, those inferred types may not be what you want. For example, for our “bikes and weather” dataset, several ID fields (like the rental station IDs) are set by default to be numeric, but we want them treated as categorical when we train our model. In addition, we want to treat the loc_cross strings as categorical rather than text.We make these adjustments programmatically, by defining a pipeline parameter that specifies the schema changes we want to make.Then, in the automl-set-dataset-schema pipeline step, for each indicated schema adjustment , we call update_column_spec:Before we can train the model, we also need to specify the target column—what we want our model to predict. In this case, we’ll train the model to predict rental duration. This is a numeric value, so we’ll be training a regression model.In the Tables UI, the result of these programmatic adjustments looks like this:Train a custom model on the datasetOnce the dataset is defined and its schema is set properly, the pipeline will train the model. This happens in the automl-create-model-for-tables pipeline step. Via pipeline parameters, we can specify the training budget, the optimization objective (if not using the default), and which columns to include or exclude from the model inputs. You may want to specify a non-default optimization objective depending upon the characteristics of your dataset. This table describes the available optimization objectives and when you might want to use them. For example, if you were training a classification model using an imbalanced dataset, you might want to specify use of AUC PR (MAXIMIZE_AU_PRC), which optimizes results for predictions for the less common class.View model search information via Cloud LoggingYou can view details about an AutoML Tables model via Cloud Logging. Using Logging, you can see the final model hyperparameters as well as the hyperparameters and object values used during model training and tuning.An easy way to access these logs is to go to the AutoML Tables page in the Cloud Console. Select the Models tab in the left navigation pane and click on the model you’re interested in, then click the Model link to see the final hyperparameter logs. To see the tuning trial hyperparameters, simply click the Trials link.Viewing a model’s search logs from its evaluation information.For example, here’s a look at the Trials logs a custom model trained on the “bikes and weather” dataset, with one of the entries expanded in the logs:The “Trials” logs for a “bikes and weather” model.Custom model evaluation Once your custom model has finished training, the pipeline moves on to its next step: model evaluation. We can access evaluation metrics via the API. We’ll use this information to decide whether or not to deploy the model. These actions are factored into two steps. The process of fetching the evaluation information can be a general-purpose component (pipeline step) used in many situations; and then we’ll follow that with a more special-purpose step that analyzes that information and uses it to decide whether or not to deploy the trained model. In the first of these pipeline steps—the automl-eval-tables-model step—we’ll retrieve the evaluation and global feature importance information.AutoML Tables automatically computes global feature importance for a trained model. This shows, across the evaluation set, the average absolute attribution each feature receives. Higher values mean the feature generally has greater influence on the model’s predictions.This information is useful for debugging and improving your model. If a feature’s contribution is negligible—if it has a low value—you can simplify the model by excluding it from future training. The pipeline step renders the global feature importance data as part of the pipeline run’s output:Global feature importance for the model inputs, rendered by a Kubeflow Pipeline step.For our example, based on the graphic above, we might try training a model without including bike_id.In the following pipeline step—the automl-eval-metrics step—the evaluation output from the previous step is grabbed as input and parsed to extract metrics that we’ll use with pipeline parameters to decide whether or not to deploy the model. One of the pipeline input parameters allows you to specify metric thresholds. In this example, we’re training a regression model, and we’re specifying a mean_absolute_error (MAE) value as a threshold in the pipeline input parameters:The pipeline step compares the model evaluation information to the given threshold constraints. In this case, if the MAE is < 450, the model will not be deployed. The pipeline step outputs that decision and displays the evaluation information it’s using as part of the pipeline run’s output:Information about a model’s evaluation, rendered by a Kubeflow Pipeline step.(Conditional) model deploymentYou can deploy any of your custom Tables models to make them accessible for online prediction requests. The pipeline code uses a conditional test to determine whether to run the step that deploys the model, based on the output of the evaluation step described above:Only if the model meets the given criteria, will the deployment step (called automl-deploy-tables-model) be run, and the model be deployed automatically as part of the pipeline run:You can always deploy a model later, via the UI or programmatically, if you prefer.Putting it together: The full pipeline executionThe figure below shows the result of a pipeline run. In this case, the conditional step was executed—based on the model evaluation metrics—and the trained model was deployed. Via the UI, you can view outputs and logs for each step, run artifacts and lineage information, and more. See this post for more detail.Execution of a pipeline run in progress. You can view outputs and logs for each step, run artifacts and lineage information, and more.Getting explanations about your model’s predictionsOnce a model is deployed, you can request predictions from that model, as well as explanations for local feature importance: a score showing how much (and in which direction) each feature influenced the prediction for a single example. See this blog post for more information on how those values are calculated.Here’s a notebook example of how to request a prediction and its explanation using the Python client libraries.The prediction response will have a structure like this. (The notebook above shows how to visualize the local feature importance results using matplotlib.)It’s easy to explore local feature importance through the Cloud Console’s AutoML Tables UI,as well. After you deploy a model, go to the TEST & USE tab of the Tables panel, select ONLINE PREDICTION, enter the field values for the prediction, and then check the Generate feature importance box at the bottom of the page. The result will show the feature importance values as well as the prediction. This blog post gives some examples of how these explanations can be used to find potential issues with your data or help you better understand your problem domain.The AutoML Tables UI in the Cloud ConsoleWith this example we’ve focused on how you can automate a Tables workflow using Kubeflow pipelines and the Python client libraries.All of the pipeline steps can also be accomplished via the AutoML Tables UI in the Cloud Console, including many useful visualizations, and other functionality not implemented by this example pipeline—such as the ability to export the model’s test set and prediction results to BigQuery for further analysis.Export the trained model and serve it on a GKE clusterTables also has a feature that lets you export your full custom model, packaged so that you can serve it via a Docker container. This lets you serve your models anywhere that you can run a container. For example, this blog post walks through the steps to serve the exported model using Cloud Run. Similarly, you can serve your exported model from any GKE cluster, including the cluster created for an AI Platform Pipelines installation. Follow the instructions in the blog post above to create your container. Then, you can create a Kubernetes deployment and service to serve your model, by instantiating this template.Once the service is deployed, you can send it prediction requests. The sample’s README walks through this process in more detail. View your custom model’s graphYou can also view the graph of your custom model using TensorBoard. This blog postgives more detail on how to do that.You can view the model graph for a custom Tables model using TensorBoard.Summary and what’s nextIn this post, we highlighted some of the newer AutoML Tables features, including an improved Python SDK, support for explanations of online predictions, the ability to export your model and serve it from a container anywhere, and the ability to track model search progress and final model hyperparametersin Cloud Logging. In addition, we showed how you can use Cloud AI Platform Pipelines to orchestrate end-to-end Tables workflows: from creating a dataset, ingesting your structured data, and training a custom model on your data; to fetching evaluation data and metrics on your model and determining whether to deploy it based on that information. The sample code also shows how you can scalably serve an exported trained model from your Cloud AI Platform Pipelines installation. You may also be interested to try a recently-launched BigQuery ML Beta feature: the ability to train an AutoML Tables model from inside BigQuery.A deeper dive into the pipeline codeSee the sample’s README for a more detailed walkthrough of the pipeline code. The new Python client library makes it very straightforward to build the Pipelines components that support each stage of the workflow.
Quelle: Google Cloud Platform

Setting SLOs: a step-by-step guide

Are you responsible for a customer-facing service? If you are, you know that when that service is unavailable, it can impact your revenue. A lengthy outage could drive your customers to competitors. How do you know if your customers are generally happy with your service? If you follow site reliability engineering (SRE) principles, you can measure customer experience with service-level objectives (SLOs). SLOs allow you to quantifiably measure customer happiness, which directly impacts the business.   Instead of creating a potentially unbounded number of monitoring metrics, we suggest using a small number of alerts grounded in customer pain—i.e., violation of SLOs. This lets you focus alerts on scenarios where you can confidently assert that customers are experiencing, or will soon experience, significant pain.Here we’ll walk through a hands-on approach for coming up with SLOs for a service and creating real dashboards and alerts.Setting SLOs for an example serviceWe’re going to be creating SLOs for a web-based e-commerce app called “Online Boutique” that sells vintage items. The app is composed of 10 microservices, written in a variety of languages and deployed on an Istio-installed Google Kubernetes Engine (GKE) cluster.Here’s what our architecture looks like:This shop has a front end that exposes an HTTP server to serve the website, a cart service, product catalog, checkout, and various other services. Our service is pretty complex and we can easily get into the weeds trying to figure out what metrics we need to monitor. Fortunately for us, using SLOs, we can drill down to monitor the most important aspects of our service using an easy step-by-step approach. Here’s how to determine good SLOs:SLO process overviewList out critical user journeys and order them by business impact.Determine which metrics to use as service-level indicators (SLIs) to most accurately track the user experience.Determine SLO target goals and the SLO measurement period.Create SLI, SLO, and error budget consoles.Create SLO alerts.Step 1: List out critical user journeys and order them by business impactThe first step in SLO creation is listing critical user journeys for this business. A critical user journey describes a set of interactions a user has with a service to achieve some end result. So let’s look at a few of the actions our customers will be taking when they use the service:Browse productsCheck outAdd to cartNext, let’s order these items by business impact. In this case, as an e-commerce shop, it’s important that customers can complete their purchases. Look at user journeys that directly affect their ability to do so.So the newly prioritized list is going to look like this:Check outAdd to cartBrowse productsYou may be wondering why “browse products” is at the bottom of this list. Shouldn’t it be a dependency of the other two items, thus making it more important? You would be correct; it is a dependency of the other two items. However, users can come to your site and browse products all day long, but that doesn’t mean they want to buy anything. When they go through the checkout flow, you now have a stronger indicator of an intent to make a purchase, so this portion of your service is very important to your business.For the rest of this example, we’ll use the “Checkout” critical user journey as the basis for SLOs. Once you know how the process works, you can apply the same techniques to other critical user journeys. Step 2: Determine which metrics to use as SLIs to most accurately track the user experienceThe next step is to figure out which metrics to use as SLIs that will most accurately track the user experience. SLIs are the quantifiable measurements that indicate whether or not the service is working. We can choose from a wide range of indicators, such as availability (i. e., how many requests are succeeding), latency (i.e., how long a request takes), throughput, correctness, data freshness, etc.The SLI equation can help quantify the right SLI for the business:The SLI equation is the number of good events divided by the total number of valid events, multiplied by 100 to keep it a uniform percentage.Let’s look at the SLIs we want to measure for the “Checkout” critical user journey. Picture the journey your customers take to buy a product from the store. First, they spend time browsing, researching items, adding the item to cart (maybe letting it sit there so they can think about it some more), then finally, when they are ready, they decide to check out. If you get this far with your customer, you can assume you’ve succeeded in gaining their business, so it is absolutely critical that customers are able to check out.Here are the SLIs to consider for this user journey.Availability SLIWe want the checkout functionality of our service to be available to our users, so we’ll choose an availability SLI. What we’re looking for is a metric that will tell us how well our service performs in terms of availability. In this case, we want to monitor how many users tried to check out and how many of those requests succeeded, so the number of successful requests is the ”good” metric. It’s important to detail what specifically we’re going to measure and where we plan on measuring it, so the availability SLI should look something like this:The proportion of HTTP GET requests for /checkout_service/response_counts that do not have 5XX status (3XX and 4XX excluded) measured at the Istio service mesh.Why are 3XX and 4XX status codes excluded? We don’t want to count events that don’t indicate a failure with our service because they will throw our SLI signals off, so we exclude 3XX redirects and 4XX client errors from our “total” value.Latency SLIYou’ll also want to make sure that when a customer checks out, the order confirmation will be returned within an acceptable window. For this, set a latency SLI that measures how long a successful response takes. Here we’ll set a value of 500ms for a response to be returned, assuming that this is an acceptable threshold for the business. So the latency SLI would look like this:The proportion of HTTP GET requests for /checkout_service/response_counts that do not have 5XX status (3XX and 4XX excluded) that send their entire response within 500 ms measured at the Istio service mesh. Step 3: Determine SLO target goals and SLO measurement periodOnce we have SLIs, it’s time to set an SLO. Service-level objectives are a target of service-level indicators during a specified time window. This helps to measure whether the reliability of a service during a given duration—for example, a month, quarter, or year—meets the expectations of most of its users. For example, if there are 10,000 HTTP requests within one calendar month and only 9,990 of those return a successful response according to the SLI, that translates to 9,990/10,000 or 99.9% availability for that month.It’s important to set a target that is achievable so that alerts are meaningful. Normally, when choosing an SLO, it’s best to start from historical trends and assume if enough people are happy with the service now, you’re probably doing OK. Eventually, it’s ideal to converge those numbers with aspirational targets that your business may want you to meet. We can say that our SLO will be 99.9%, according to the historical data trends. Next, it’s time to put these words into real tangible dashboards and alerts. Step 4: Create SLI, SLO, and error budget consolesAs engineers, we need to be able to see the state of the service at any time, which means we need to create monitoring dashboards. For customer-focused monitoring, we want to see graphs for SLIs, SLOs, and error budgets.Most monitoring frameworks operate in very similar ways, so it’s up to you to decide which one to use. The basic components are generally the same. Breaking down the Checkout Availability SLI to generic monitoring fields would most likely look like this:Metric Name: /checkout_service/response_countsFilter: Good filter: http_response_code=200Total filter: http_response_code=500 OR http_response_code=200Aggregation: CumulativeAlignment Window: 1-minute intervalWith a lot of elbow grease, you can calculate the right definitions needed to create SLI and SLO graphs. But this process can be pretty tedious, especially when you have multiple services and SLOs to create. Fortunately, the Service Monitoring component of Cloud Operations can automatically generate these graphs. Because we are using Istio service mesh integration in this example, observability into the system is even more accessible. Here’s how to set up a dashboard with Service Monitoring:1. Go to the Monitoring page in Cloud Console and select Services2. Since we’re using Istio, our services are automatically exposed to Cloud Monitoring, so you just need to select the checkout service.3. Select Create an SLO4. Select Availability and Request-based metric unit.Now you can see the SLIs as well as details into what metrics we are using.5. Select the compliance period. Here we’ll use a rolling window and a target of 30 days. Rolling windows are more closely aligned with user experience, but you can use calendar windows if you want your monitoring to align with your business targets and planning.6. Select the previously set SLO target of 99.9%. Service Monitoring also shows your historical SLO achievements if you have existing data.That’s it! Your monitoring dashboard is ready.Once we’re done, we end up with nice graphs for SLIs, SLOs, and error budgets.You can then repeat the process for the Checkout Latency SLI using the same workflow. Step 5: Create SLO alertsAs much as we love our dashboards, we won’t be looking at them every second of the day, so we want to set up alerts to notify us when our service is in trouble. There are varying preferences for which thresholds to use when creating alerts, but as SREs, we like using the error budget burn-based alerting. Service Monitoring lets you set alerting policies for this exact situation.1. Go to the Monitoring page in Cloud Console and select Services.2. Select Set up alerting policy for the service you want to add an alerting policy for.3. Select SLO burn rate and fill in the alert condition details.Here, we set a burn rate alert that will notify us when we burn our error budget at 2x the baseline rate, where the baseline is the error rate that, if consistent throughout the compliance period, would exactly use up the allotted error budget.4. Save the alert condition.If you run a customer-facing service, following this process will help you define initial SLIs and SLOs. One thing to keep in mind is that your SLOs are never set in stone. It’s important to periodically review your SLOs every six to twelve months and make sure they still align with your users’ expectations and business needs or if there are other ways you can improve your SLOs to more accurately reflect your customer’s needs. There are many factors that can affect your SLOs, so you need to regularly iterate on them. If you want to learn more about implementing SLOs, check out these resources for defining and adopting SLOs. One final note: while we used the Service Monitoring UI to help us create SLIs and SLOs, at the end of the day, SLIs and SLOs are still configurations. As engineers, we want to make sure that our configurations are source-controlled to improve reliability, scalability, and maintainability. To learn more about how to use config files with Service Monitoring, check out the second part of this series at Setting SLOs: observability with custom metrics.
Quelle: Google Cloud Platform