How fleet management gets easier with smart analytics on Google Cloud

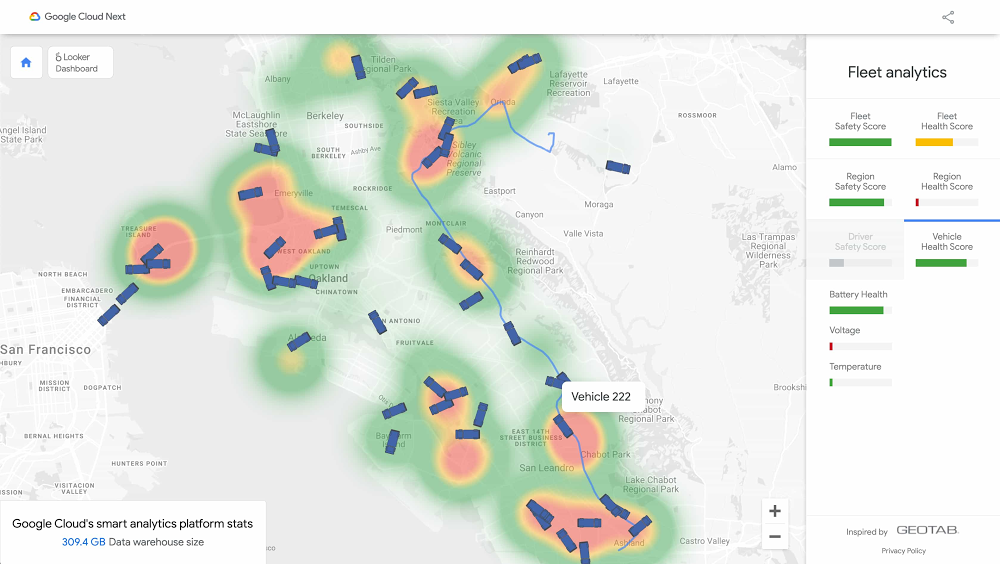
Editor’s note: This blog provides a deeper, under-the-hood view of this smart analytics platform demo that you can explore now, featured during Google Cloud Next ‘20: OnAir.The ongoing COVID-19 pandemic has changed consumer purchasing behavior and, consequently, how companies need to manage their transportation logistics to meet new expectations. With large fleets of trucks to manage, how can fleet managers use modern technology to optimize their businesses? We explored the answers to this question using simulated sensor data and Google Cloud’s smart analytics platform to create a demo. Geotab, a Canada-based company, provides data-driven insights on commercial fleet vehicles on every continent. From engine speeds to ambient air temperatures to driving and weather conditions, Geotab processes a wealth of data from more than 2 million vehicles around the world. These vehicles are equipped with Geotab’s telematic solutions and a range of integrated sensors and apps.With all of this data streaming in real time, fleet truck managers use data to predict vehicle health, monitor driver safety, and track all of this information in real time. Real-time data lets users proactively respond to things as they happen or before they happen, rather than being reactive.To demonstrate how to solve these business challenges using smart analytics on Google Cloud, we created a live simulated world of 7,500 trucks generating approximately 25 million trip events per day. Built as a demo, the generated data simulates some of the data that might be processed as if it were integrated with actual sensors and apps from Geotab (Geotab does run a scaled environment using Google Cloud, but the data and environment here is simulated).Here’s a look at the dashboard we created for the demo, using Pub/Sub, Dataflow, BigQuery, and Looker on Google Cloud. It shows the simulated trucks making deliveries between various points.To create this, we first generated a simulated fleet of 7,500 trucks across 150 regions in the United States, each equipped with a simulated sensor that would emit data every few seconds. The data includes vehicle telematics data such as the GPS location, current speed, and current battery health. The data also contained information about each region, trip, and driver.BigQuery table showing more than 2 billion rows of telematics data collected over the past 78 daysTo ingest this constant flow of data into Google Cloud, we used Pub/Sub and Dataflow, automatically parsing all incoming sensor data into BigQuery (assuming one sensor per truck). With over 1 million trip data points stored in BigQuery per day, analysts could use SQL to quickly analyze massive amounts of data in seconds.In 5.7 seconds, BigQuery queried 103.2 GB of data to calculate the highest recorded driving speed for each of the 1.3 million trips on any particular day.Predictive analytics was the next topic of interest. With data streaming into BigQuery, we could write algorithms to help anticipate any issues with driver safety or vehicle health. Using scheduled queries, we established a safety score of each driver based on how they drove in recent trips, with data points such as the level of acceleration or steering around corners when driving. If the result was “poor,” the fleet manager could address the driver ahead of the next trip. In addition, vehicle health was updated on every trip to ensure the vehicle was in working condition, based on engine sensor data (i.e., battery health). This is computed at the beginning of every trip, too, to contribute toward improved predictive maintenance, one of the challenges in fleet management. BigQuery comes with machine learning capabilities via BigQuery ML, so it’s possible to create predictive models in SQL to forecast demand or predict unsafe driving conditions.Visualizing fleet management dataWith this data now available, how can it best communicate what actions a fleet operator could take? Since BigQuery natively integrates with business intelligence tools like Looker for out-of-the-box visual analysis, we used Looker to create dashboards to display some of the descriptive as well as actionable insights, as shown here:With Looker, analysts can create a single-source-of-truth data model where they define metrics using SQL. With a shared data model in place, business users can then use Looker to ask new questions of the data and build reports—all without needing a technical resource and still ensuring consistent metrics. For example, in the context of fleet management, an analyst might define the Harsh Acceleration Score in LookML, ensuring consistency and accuracy across the organization. In addition to dashboards and data exploration, Looker also provides a platform that enables end users to drive operational workflows through data actions (i.e., sending a text message directly to a driver concerning acceleration patterns).Google Cloud’s smart analytics platform provides an end-to-end solution for your fleet data, so you can spend less time worrying about scale, speed and infrastructure, and more time delivering value to your customers.See the full interactive smart analytics platform demo.Special thanks to Zack Akil, Matt Olivo, and Leigha Jarett for their technical contributions to the demo.
Quelle: Google Cloud Platform

Accelerating Mayo Clinic’s data platform with BigQuery and Variant Transforms

Genomic data is some of the most complex and vital data that our customers and strategic partners like Mayo Clinic work with. Many of them want to work with genomic variant data, which is the set of differences between a given sample and a reference genome, in order to diagnose patients and discover new treatments. Each sample’s variants are usually stored as a Variant Call Format file, or VCF, but files aren’t a great way to do analytics and machine learning on these data. In 2018, we introduced Variant Transforms, an easy way to load VCF data into BigQuery to enable these use cases. Since then, we’ve been hard at work improving Variant Transforms, adding features such as the ability to get VCFs back out of BigQuery for customers who want to use file-based tools. We’re now announcing a new schema for Variant Transforms that uses new BigQuery features to significantly reduce the cost of running queries:Sharding: Variant Transforms shards its output into multiple tables, each containing variants of a specific region of a genome—in this case, a whole chromosome. By storing each chromosome’s variants in its own table, you don’t pay to query every chromosome if you’re only analyzing a small genomic region on one of the chromosomes. In addition to making each table smaller and more manageable, sharding is a prerequisite for integer-range partitioning.Integer-range partitioning: A partitioned table is a special table that is divided into segments, called partitions, that make it easier to manage and query your data. By dividing a large table into smaller partitions, you can improve query performance and you can control costs by reducing the number of bytes read by a query. Variant Transforms uses integer-partitioned tables to only query the necessary variants.Clustering is a technique for automatically organizing a table based on the contents of one or more columns in the table’s schema. Clustered columns are used to colocate related data. BigQuery sorts the data based on the values of the clustered columns and organizes the data into multiple blocks in BigQuery storage. Using clustering in addition to partitioning is very effective for large variant tables, because it efficiently organizes and sorts the variants inside each partition.The result? Queries to find all variants of a typical gene are now five to 40 times cheaper than before. For queries that span a short genomic region, the associated cost can be up to 200 times lower.1How Mayo Clinic is using Variant TransformsThis kind of performance is empowering partners like Mayo Clinic. In 2019, Mayo Clinic built a new Omics Data Platform (ODP) on Google Cloud. They use Variant Transforms along with the Google Cloud Healthcare API and the Google Cloud Life Sciences API to deliver next-generation patient insights for Mayo Clinic patients. Mayo Clinic has integrated ODP with their pipelines that are producing variant data and are also loading all of their historical data. “Mayo Clinic is interested in finding the meaning in all of the variants. Is the variant pathogenic or benign? Is the variant potentially high impact? Does the variant affect how a patient metabolizes a drug?” says Mike Mundy, IT technical specialist from Mayo Clinic, who’s leading the implementation of ODP. “There are many sources of variant annotations and they are constantly being updated with new knowledge.” Mayo Clinic’s ODP also supports managing annotation sources, and annotation data is loaded into BigQuery. Variant data and annotation data is kept separate, which allows for dynamic variant annotation with the latest knowledge.ODP is implemented using a microservices architecture that is built on Google Cloud, using Cloud IAM for managing accounts and permissions, Cloud Storage for the data lake, and BigQuery for the data warehouse. The ODP security model keeps research subject data and clinical patient data separate. Each research study or clinical sequencing project gets its own Google Cloud project for fine-grained access control. ODP also includes an Omics Data Console that uses ODP’s microservices to provide a user interface for querying variant data and running dynamic annotations.How much better is Variant Transforms?To test the performance of the new schema, we wrote a query to find all variants in a genomic region of fixed length and examined several region lengths, from 1,000 base pairs to 1,000,000. We ran each query 10 times from random starting points and recorded the median cost (bytes billed). We repeated this process on two chromosomes, a large one and a small one, to examine the effect of chromosome size on the efficiency of our new schema. Here’s how the new schema performs on the 1000 Genomes dataset, in MB processed (lower is better):And here’s the new schema performance on the gnomADv3 data set, in MB processed (lower is better):As the approximate length of a typical gene is less than 50,000 base pairs, running a query to find all variants of a gene in gnomADv3 costs about 25MB. This means users can run around 42,000 similar queries each month at no cost, assuming use of the 1TB free offering of BigQuery.As Mayo Clinic scales out sequencing to hundreds of thousands of patients, they estimate saving $1.5 million over three years by using Google Cloud and Variant Transforms instead of their existing solution. The new version of Variant Transforms is accelerating the team’s ability to deliver on the promise of precision medicine. Learn more about Mayo Clinic and about Variant Transforms.1. Based on tests described in the “How much better is Variant Transforms” section of this post. Your own experience with the performance improvement of Variant Transforms may vary. Performance depends on many factors, including the size of the sharded output table, the density of variants, and the presence of repeated calls (in the case of joint genotyped inputs).
Quelle: Google Cloud Platform

Helping retailers prepare for the 2020 holiday season

Although summer is a time when many of us are thinking about sunshine and weekend trips to the beach, for retailers, summer means important preparation for the holiday season, the most important sales period of the year. The typical holiday season presents retailers with familiar challenges: increased product demand, planning in-store seasonal staffing, supply chain pressures, and spikes in web traffic—to name a few.But 2020 is going to be different. The long-tail impacts of the COVID-19 pandemic will continue to be felt in the retail industry through this year and into the next. Many retailers have been forced to reduce their physical footprints or change the way they operate, in addition to exploring new ways of delivering their products into the hands of customers, with more changes likely to come. Several major U.S. retailers have already announced being closed for Thanksgiving, further changing the digital and physical dynamics of the season. So how will this year’s holiday season play out? Connecting people with information is what Google does bestWe know the months ahead are paved with uncertainty, from fluctuating physical distancing restrictions, to questions on the strength of consumer spending given the pandemic, to the emergence of new consumer channels and buying paradigms. Retailers can prepare by understanding how shopper behaviors have changed, and by following the latest Google Cloud guidance in our ebook, “A retailer’s guide to 2020 holiday season readiness: Five keys to success.”Shape your strategy by understanding consumer behaviorLooking ahead to the 2020 holiday season, third-party market trends and our Google-led research indicates three overarching consumer behaviors that have the power to affect how retailers perform. As your team prepares in the months ahead, keep in mind these changes to purchasing habits, loyalty, and sentiment.1. More consumers are shopping online for the first time, and for products they would normally buy in-store.Perhaps unsurprisingly, the shift to ecommerce accelerated at its fastest ever rate in 2020. By May, it was up 70% year-over-year and had reached $82.5 billion in the United States. This shift affected retail segments that had previously lagged behind the shift online, like grocery. In the first week of March, only 11% of US adults said they shopped online for groceries. By the end of the month, that figure had jumped to 37%.We saw the abandonment of long-established buying habits as home-bound customers began to experiment with new approaches to purchasing everyday items. In addition to the steep rise in online grocery shopping, 1 in 4 of surveyed shoppers went online during the lockdown to purchase something they would normally buy in-store.1While stores are now reopening in many regions, new limits on physical interactions, reluctance on the part of consumers to shop in-store due to fears around COVID-19 exposure, and the possibility of further store closures (due to future waves of the virus) mean that a question mark continues to hang over the viability of a predominantly bricks-and-mortar retail strategy.Having a flexible and scalable ecommerce channel is becoming table stakes as more consumers are willing to go online to find and purchase a wider variety of products. Retailers looking to prioritize their holiday season readiness efforts should begin by doubling down on their omnichannel strategy.2. Shoppers expect new contactless ways to make every type of purchase.Before the pandemic, many shoppers found a visit to a store to be the fastest and simplest way to get what they needed. That changed when lockdown and shelter-in-place orders were issued and 53% of shoppers reported trying a new shopping service for the first time.2This included grocery delivery, as previously mentioned, but also checking inventory online before heading to the store, as well as trying curbside pickup. And for those who haven’t yet tried new services, the intent is there. Searches for “curbside pickup” rose 100% in March, while looking for “home delivery” grew by 70%—and more than 50% of consumers in a Google survey believe that curbside pick up will still be relevant as stores reopen. What people are buying is also changing. Google Search data shows a drastic increase in searches for items to complement spending more time in the home. For example, ergonomic chairs to improve the home office or home improvement items to enhance the quality of living spaces.Retailers need to understand and be able to act on emerging consumer trends to deliver new offerings and support changing buying preferences. We recommend leveraging tools like Google Trends and Rising Retail Categoriesto spot fast-rising retail categories, while investing in supply chain improvements to increase flexibility and resilience.3. With consumer sentiment low, shoppers are more value-conscious than ever before. Widespread disruption to lives and livelihoods has contributed to a drop in consumer sentiment in many markets around the world. A McKinsey study found that the vast majority of consumers in the 45 countries surveyed expect COVID-19 to impact their finances and personal routines for more than two months. In the United States, almost a third of consumers are already switching to less expensive products to save money.Looking at the retail industry as a whole, overall forecasts have decreased by more than 10% since the beginning of the year. Retailers that are successful this holiday season will have a strong, targeted strategy for reaching consumers with the products that are most relevant to them, at the right price. Reaching shoppers with the right message at the right time relies on having access to advanced analytics and machine learning technologies. With industry solutions from Google Cloud like the recently launched Recommendations AI, retailers can drive digital acceleration, increase consumer satisfaction and improve operational efficiency across the value chain. Here to help you prepare for the unpredictableThis year has been one of frantic and unexpected change for many of us. We’re committed to bringing forward technologies the retail industry needs and to partner with our customers to help them face any surprises this holiday season. This is why commerce companies such as Etsy and Shopify, and retailers like The Home Depot  and Urban Outfitters choose Google Cloud to support them during the busy shopping season. In particular, they leverage our Black Friday and Cyber Monday (BFCM) white-glove services, where we work side-by-side with their IT and engineering teams from early capacity planning, to reliability tests, to operational war rooms.Our teams are here with the solutions and the expertise to help you succeed through this holiday season and into the next. Start with our practical, actionable guide to help you prepare for a successful holiday season and beyond. From tips on cloud migration for cost management, to empowering your service centers with the support of AI, we outline the areas that will make the biggest difference to the customer experience and to your bottom line. Download the ebook today and join us for one of our Retail OnAir events, where we’ll share learnings from our work with leading retailers.1. Google/Ipsos, U.S. Shopping Tracker, March 20202. Google/Ipsos, Shopping Tracker, Jan, Feb, Mar, April 2020
Quelle: Google Cloud Platform

COVID-19 public datasets: our continued commitment to open, accessible data

Back in March, we announced that new COVID-19 public datasets would be joining our Google Cloud Public Datasets program to increase access to critical datasets to support the global response to the novel coronavirus. While the program initially focused on COVID-19 case data, we’ve since expanded our datasets offering to provide additional value to members of the research community and public decision makers. In addition, we’re extending our initial offering of free querying of COVID-19 public datasets for an additional year, through September 15, 2021.These expanded datasets would not have been possible without numerous partnerships with data providers working closely with Google Cloud to onboard their data to BigQuery. By onboarding public data to BigQuery, these data providers remove barriers and increase the velocity with which users can access and query these large data files. With the COVID-19 public datasets and BigQuery, everything is easily found in one place. As we strive to continue supporting our users, we want to help ensure that a lack of resources is not a contributing factor in one’s ability to make sense of this data. That’s why we’re expanding datasets access, and we hope that this will expand the pool of contributors who are finding solutions to this pandemic, whether that’s students and faculty querying these datasets through distance learning in the fall or public decision makers gauging when their communities can safely reopen. We hope that these datasets continue to provide universally accessible and useful information in the fight against COVID-19.How Google has worked with organizations to make COVID-19 datasets availableSince the beginning of the pandemic, The New York Times has tracked and visualized cases across the United States. They have publicly shared aggregated case data at the county and state level, allowing researchers to track, model, and visualize the spread of the virus. These rich datasets provide U.S. national-level, state-level, and county-level cases and deaths, beginning with the first reported coronavirus case in Washington State on January 21, 2020. As deaths began to increase across the United States and abroad, The New York Times published the data behind their excess deaths tracker to provide researchers and the public with a better record of the true toll of the pandemic globally. We worked with them to make this data accessible on BigQuery. The New York Times also estimated the prevalence of mask-wearing in counties in the United States and made that data available to provide researchers a way to better understand the role of mask-wearing in the course of the pandemic. To complement this and many other efforts to better understand the impact of policy actions, Google also released the COVID-19 Community Mobility Reports, which provide data on community movement trends, and made the data available on BigQuery. We also recently announced our COVID-19 Public Forecasts to help first responders and other healthcare and public sector-impacted organizations project metrics, such as case counts and deaths, into the future. This data is also available on BigQuery.Next, we prioritized data that could help in understanding the varying effects of COVID-19 in our communities and healthcare systems by publishing datasets relating to social determinants of health. To expand the scope of COVID-19 related queries that qualify for free querying, we included existing datasets like the American Community Survey from the U.S. Census Bureau and OpenStreetMap. We also worked with organizations like BroadStreet to make datasets like the U.S. Area Deprivation Index available on BigQuery. This dataset provides a measure of community vulnerability to public health issues at a highly granular level. Finally, we are publishing aggregated hospital capacity data from the American Hospital Association to help decision makers better understand their community’s ability to handle a surge in hospitalizations.We also recognize that the scientific community’s response to COVID-19 often depends on the availability and accessibility of high-quality scientific data. We’ve worked to include the Immune Epitope Database (Vita et al, Nucleic Acid Research, 2018) on BigQuery as a resource to researchers investigating the immune response to the SARS-CoV-2 virus. We have also published a series of articles to show how researchers can explore and build predictive models from this dataset using Google Cloud AI Platform. As an additional resource to the scientific community, we’ve created the COVID-19 Open Data dataset, which combines numerous publicly available COVID-19 and related datasets at a fine geographic level and makes them available both in BigQuery and in CSV and JSON formats. The code used to create this dataset is open-source and available on GitHub.As we continue to expand the list of COVID-19 public datasets, we will continue to release new datasets aligned with these four established focus areas:Epidemiology and health response, such as case and testing statistics and hospital dataGovernment policy response and effects, such as mobility and mask complianceSocial determinants of health and community responseBiomedical and other research dataFor those attending Google Cloud Next ‘20: OnAir, be sure to check out Data vs. COVID-19: How Public Data is Helping Flatten the Curve. This session will highlight how public data and the Google Cloud and COVID-19 public datasets are helping combat the pandemic and informing individual decision-making to help everyone make informed decisions about the spread and risks of the virus, and explain how cooperative efforts could help flatten the curve.
Quelle: Google Cloud Platform

Understanding IP address management in GKE

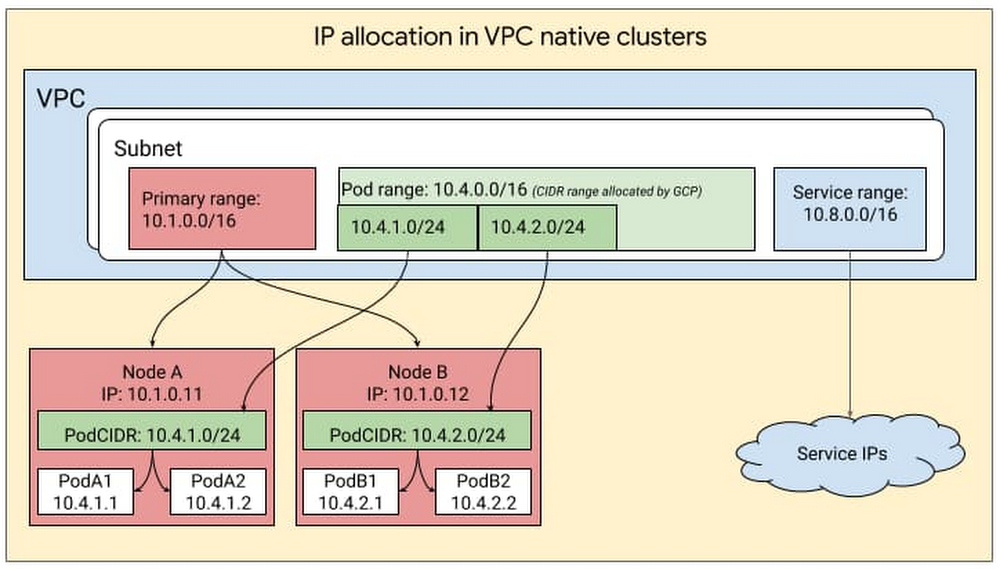
When it comes to giving out IP addresses, Kubernetes has a supply and demand problem. On the supply side, organizations are running low on IP addresses, because of large on-premises networks and multi-cloud deployments that use RFC1918 addresses (address allocation for private internets). On the demand side, Kubernetes resources such as pods, nodes and services each require an IP address. This supply and demand challenge has led to concerns of IP address exhaustion while deploying Kubernetes. Additionally, managing these IP addresses involves a lot of overhead, especially in cases where the team managing cloud architecture is different from the team managing the on-prem network. In this case, the cloud team often has to negotiate with the on-prem team to secure unused IP blocks.There’s no question that managing IP addresses in a Kubernetes environment can be challenging. While there’s no silver bullet for solving IP exhaustion, Google Kubernetes Engine (GKE) offers ways to solve or work around this problem. For example, Google Cloud partner NetApp relies heavily on GKE and its IP address management capabilities for users of its Cloud Volumes Service file service. “NetApp’s Cloud Volumes Service is a flexible, scalable, cloud-native file service for our customers,” said Rajesh Rajaraman, Senior Technical Director at NetApp. “GKE gives us the flexibility to take advantage of non-RFC IP addresses and we can provide scalable services seamlessly without asking our customers for additional IPs,” Google Cloud and GKE enable us to create a secure SaaS offering and scale alongside our customers.”Since IP addressing in itself is a rather complex topic and the subject of many books and web articles, this blog assumes you are familiar with the basics of IP addressing. So without further ado, let’s take a look at how IP addressing works in GKE, some common IP addressing problems and GKE features to help you solve them. The approach you take will depend on your organization, your use cases, applications, skill sets, and whether or not there’s an IP Address Management (IPAM) solution in place. IP address management in GKEGKE leverages the underlying GCP architecture for IP address management, creating clusters within a VPC subnet and creating secondary ranges for Pods (i.e., pod range) and services (service range) within that subnet. The user can provide the ranges to GKE while creating the cluster or let GKE create them automatically. IP addresses for the nodes come from the IP CIDR assigned to the subnet associated with the cluster. The pod range allocated to a cluster is split up into multiple sub-ranges—one for each node. When a new node is added to the cluster, GCP automatically picks a sub-range from the pod-range and assigns it to the node. When new pods are launched on this node, Kubernetes selects a pod IP from the sub-range allocated to the node. This can be visualized as follows:Provisioning flexibilityIn GKE, you can obtain this IP CIDR either in one of two ways: by defining a subnet and then mapping it to the GKE cluster, or by auto-mode where you let GKE pick a block automatically from the specific region. If you’re just starting out, run exclusively on Google Cloud and would just like Google Cloud to do IP address management on your behalf, we recommend auto-mode. On the other hand, if you have a multi-environment deployment, have multiple VPCs and would like control over IP management in GKE, we recommend using custom-mode, where you can manually define the CIDRs that GKE clusters use.Flexible Pod CIDR functionalityNext, let’s look at IP address allocation for Pods. By default, Kubernetes assigns a /24 subnet mask on a per node basis for Pod IP assignment. However, more than 95% of GKE clusters are created with no more than 30 Pods per node. Given this low Pod density per node, allocating a /24 CIDR block on every Pod is a waste of IP addresses. For a large cluster with many nodes, this waste gets compounded across all the nodes in the cluster. This can greatly exacerbate IP utilization. With Flexible Pod CIDR functionality, you can define Pod density per Node and thereby use fewer IP blocks per node. This setting is available on a per Node-pool basis, so that if tomorrow the Pod density changes, then you can simply create a new Node pool and define a higher Pod density. This can either help you fit more Nodes for a given Pod CIDR range, or allocate a smaller CIDR range for the same number of Nodes, thus optimizing the IP address space utilization in the overall network for GKE clusters.The Flexible Pod CIDR feature helps to make GKE cluster size more fungible and is frequently used in three situations: For hybrid Kubernetes deployments, you can avoid assigning a large CIDR block to a cluster, since that increases the likelihood of overlap with your on-prem IP address management. The default sizing can also cause IP exhaustion.To mitigate IP exhaustion – If you have a small cluster, you can use this feature to map your cluster size to the scale of your Pods and therefore preserve IPs.For flexibility in controlling cluster sizes: You can tune your cluster size of your deployments by using a combination of container address range and flexible CIDR blocks. Flexible CIDR blocks give you two parameters to control cluster size: you can continue to use your container address range space, thus preserving your IPs, while at the same time increasing your cluster size. Alternatively you can reduce the container address range (use a smaller range) and still keep the cluster size the same.Replenishing IP inventoryAnother way to solve IP exhaustion issues is to replenish the IP inventory. For customers who running out of RFC 1918 addresses, you can now use two new types of IP blocks:Reserved addresses that are not RFC 1918Privately used Public IPs (PUPIs), currently in betaLet’s take a closer look.Non-RFC 1918 reserved addresses For customers who have an IP shortage, GCP added support for additional reserved CIDR ranges that are outside the RFC 1918 range. From a functionality perspective, these are treated similar to RFC1918 addresses and are exchanged by default over peering. You can deploy these in both private and public clusters. Since these are reserved, they are not advertised over the internet, and when you use such an address, the traffic stays within your cluster and VPC network. The largest block available is a /4 which is a very large block.Privately used Public IPs (PUPI)Similar to non-RFC 1918 reserved addresses, with PUPIs, you can use any Public IP, except Google owned Public IPs on GKE. These IPs are not advertised to the internet.To take an example, imagine you need more IP addresses and you use the following IP range privately A.B.C.0/24. If this range is owned by a Service MiscellaneousPublicAPIservice.com, devices in your routing domain will no longer be able to reach MiscellaneousPublicAPIservice.com and will instead be routed to your Private services that are using those IP addresses. This is why there are some general guidelines when using PUPIs. PUPIs are given higher priority over real IPs on the internet because they belong within the customer’s VPC and therefore, their traffic doesn’t go outside of the VPC. Thus, when using PUPIs, it’s best to ensure you are selecting IP ranges that you are sure will not be accessed by any internal services.Also, PUPIs have a special property in that they can be selectively exported and imported over VPC Peering. With this function, a user can have deployment with multiple clusters in different VPCs and reuse the same PUPIs for Pod IPs. If the clusters need to communicate with each other, then you can create a servicetype loadbalancer with Internal LB annotation. Then only these Services VIPs can be advertised to the peer, allowing you to reuse PUPIs across clusters and at the same time ensuring connectivity between the clusters.The above works for your environment whether you are running purely on GCP or if you run in a hybrid environment. If you are running a hybrid environment, there are other solutionswhere you can create islands of clusters in different environments by using overlapping IPs and then use a NAT or proxy solution to connect the different environments. The IP addresses you needIP address exhaustion is a hard problem with no easy fixes. But by allowing you to flexibly assign CIDR blocks and replenish your IP inventory, GKE ensures that you have the resources you need to run. For more, check out the documentation on how to create a VPC-native cluster with alias IP ranges, and this solution on GKE address management.
Quelle: Google Cloud Platform