COVID-19 public datasets: supporting organizations in their pandemic response

Editor’s note: This is part two of a series on the COVID-19 public datasets. Check out part one to learn more about recently onboarded datasets and new program expansion.Back in March, we launched new COVID-19 public datasets into our Google Cloud Public Datasets program to make critical COVID-19 datasets available to the public and free to analyze using BigQuery.At launch, we aimed to get high-quality data into the hands of users as quickly as possible to support their efforts to monitor and understand the emergent pandemic. A few months in, we have expanded our original goals to include supporting public and private sector users with the data that they need to make informed decisions. Today, we’ll highlight how research organizations, governments, and partners have used these datasets to power their decisions, contribute to the growing body of research on the virus and its societal impacts, and create tools to support response efforts.Helping communities respond to COVID-19Reliable data is now more important than ever as leaders in healthcare, government, and private industry are challenged to make decisions in response to COVID-19. To equip organizations in charting the safest path forward, Google Cloud collaborated with Google Cloud partner SADA to build the National Response Portal. The portal is an open data platform that combines many relevant datasets for an on-the-ground view of the pandemic. “The National Response Portal takes full advantage of the Google Cloud Public Datasets program, giving us direct and easy access to the COVID-19 datasets that power our visualizations,” says Michael Ames, senior director of healthcare and life sciences at SADA. Via the portal, users can explore trends on COVID-19 cases and deaths, view forecasts anticipating future hotspots, and examine the impact of policy decisions and social mobility. Healthcare providers have begun contributing data as part of a growing effort to share data insights among the health community to empower better awareness and decision-making.To find out more and view the portal, check it out here.Equipping the public sector to monitor COVID-19When looking for a technical solution for monitoring COVID-19 cases and updating residents, the Oklahoma State Department of Health and the governor’s office turned to Google Cloud. The state needed a public-facing platform that would display real-time data on the pandemic. Using the COVID-19 public datasets along with Looker, Google Cloud’s business intelligence and analytics platform, the State of Oklahoma built a dashboard on Oklahoma COVID-19 statistics, located on the state’s public health website. Since the dashboard launched, it has been viewed tens of thousands of times each day. Department of Health staff and Oklahoma citizens are able to access and interact with consolidated information served by Looker dashboards for actionable insights. “The partnership with Google Cloud has enabled the OK Department of Health to be extremely agile in keeping the citizens of Oklahoma informed as to the impact of COVID-19 across the state,” says State of Oklahoma Digital Transformation Secretary David Ostrowe. The dashboard has decreased manual processing needs and has been easy to update and deploy changes over Google Cloud. The State of Oklahoma also received an A+ COVID-19 data quality rating from the COVID Tracking Project.Supporting research on COVID-19In the early days of the pandemic, Northeastern University used Google Cloud to model COVID-19 and forecast the impact that interventions like stay-at-home-orders would have on the spread of the virus. Northeastern University researchers used several Google Cloud products, including BigQuery, to analyze various datasets and inform their global metapopulation disease transmission model. The team relied on the U.S. Census Data and OpenStreetMap public datasets and BigQuery GIS capabilities to project the impact of different interventions on the global spread of the COVID-19 pandemic.”Our team models and forecasts the spatial spread of infectious diseases by quickly analyzing hundreds of terabytes of simulation data,” says Dr. Matteo Chinazzi, associate research scientist at Northeastern University. “With the help of BigQuery, we are able to accelerate insights from our epidemic models and better study evolution of an ongoing outbreak.”  Dr. Chinazzi’s team has provided valuable insights on the effects of different containment and mitigation strategies. The team’s findings were published in Science in April. You can check them out through The Global Epidemic and Mobility (GLEAM) Project interactive dashboards.Visualizing the pandemicCARTO, a location intelligence platform integrated with BigQuery, used its mapping expertise to build an important COVID-19 dashboard using Google Cloud public datasets. CARTO combined census data with COVID-19 case data and social determinants of health datasets in this real-time dashboard to support organizations in monitoring and responding to the pandemic.“We built our COVID-19 dashboard to anticipate viewers looking for fast answers,” says Stephanie Schober, CARTO solution engineer. “As COVID-19 continues to spread, Google Cloud’s BigQuery content has enabled our dashboard to use real-time and reliable data.” ”Location data has been extremely relevant through this pandemic to ensure both private and public sector organizations can respond fast enough,” says Florence Broderick, VP of marketing at CARTO. “Geospatial analysis through CARTO and BigQuery has enabled a wide range of use cases, including PPE distribution, mobility analysis, and workplace-return planning.”If you’re interested in developing similar visualizations, check out more details from CARTO and tune into Data vs. COVID-19: How Public Data is Helping Flatten the Curve. Analyzing the global COVID-19 news narrative from web to television To support researchers in analyzing global media coverage of COVID-19 and comparing with outbreaks of the past decade, we have partnered with the GDELT Project to host several multimodal datasets. These datasets include media coverage across 152 languages and span more than a decade, totaling more than 3 trillion data points, all of them available as public datasets in BigQuery. “Google Cloud’s AI offerings make it possible to transform text, speech, imagery and video into rich annotations sharing a common taxonomy,” says GDELT Founder Dr. Kalev Leetaru. “BigQuery is the lens through which trillions of data points become actionable insights that can help guide our understanding of the global COVID-19 media narrative.” Data insights on COVID-19 media portrayal, such as trend analysis on mask use worldwide, and sample queries can be found on the GDELT Project Blog or you can explore the data directly in BigQuery. A Google Cloud COVID-19 research grant is also supporting additional data annotation on the COVID-19 pandemic and other major disease outbreaks. The project is using Cloud Speech-to-Text to compare COVID-19 radio coverage on 10 major U.S. stations. When completed, this dataset will make it possible for researchers to understand how television and radio coverage of the pandemic compares with online coverage.Helping companies manage operations throughout the pandemicIn the private sector, organizations have leveraged the COVID-19 datasets to support decision making in responding to the pandemic.Rolls-Royce joined with Google Cloud and other industry partners to form the Emergent Alliance. This data analytics coalition plans to leverage Google Cloud’s datasets in finding ways to support the global response to the pandemic, model economic recovery, and support return-to-work initiatives. When we launched COVID-19 public datasets, we set out on a mission to partner with data owners and make critical datasets easily accessible and free of analysis costs. We are inspired by the many organizations across healthcare, government, academia, and private industry that have led the way applying this data in innovative ways, supporting global response efforts. As communities continue to navigate the challenging path forward, we hope to play a small part in empowering them with data insights to prepare for what comes next.
Quelle: Google Cloud Platform
GKE best practices: Day 2 operations for business continuity

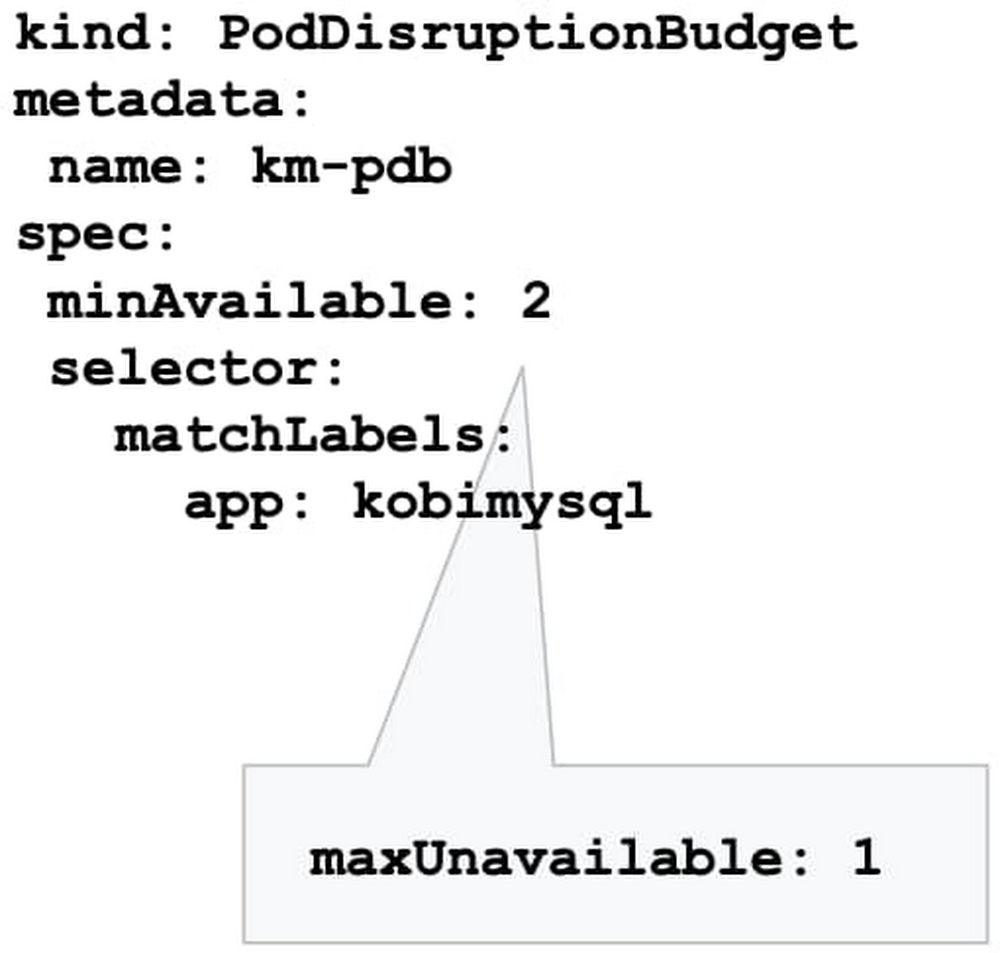
So, you followed our advice and built a highly available Google Kubernetes Engine (GKE) cluster based on our day 0 guidance. But day 2 is where the rubber hits the road: your GKE cluster is up and running, and serving traffic to your app, and can’t really afford to go down. The day 0 steps you took should help prevent that, but in production, ensuring business continuity isn’t just about the high availability of the workloads. It’s also about gracefully handling disruptions, and applying the latest security patches and bug fixes non-disruptively. In this blog post, we’ll discuss recommendations and best practices to help the applications running on your GKE cluster to stay happy and healthy. Manage disruptionAs with any platform’s lifecycle, there will come a time when your GKE cluster experiences an interruption, needs to be updated, or needs to shut down. You can limit the interference by proactively setting up the right number of replicas, setting a Pod Disruption Budget, and specifying your shutdown grace period.Make sure you have replicasYou may be familiar with the concept of Kubernetes replicas. Replicas ensure the redundancy of your workloads for better performance and responsiveness, and to avoid a single point of failure. When configured, replicas govern the number of pod replicas running at any given time.Set your tolerance for disruptionHowever, during maintenance, Kubernetes sometimes removes an underlying node VM, which can impact the number of replicas you have. How much disruption is too much? What’s the minimum number of replicas you need to continuously operate your workloads while your GKE cluster is undergoing maintenance? You can specify this using the Kubernetes Pod Disruption Budget, or PDB.Setting PodDisruptionBudget ensures that your workloads have a sufficient number of replicas, even during maintenance. Using the PDB, you can define a number (or percentage) of pods that can be terminated, even if terminating them brings the current replica count below the desired value. With PDB configured, Kubernetes will drain a node following the configured disruption schedule. New pods will be deployed on other available nodes. This approach ensures Kubernetes schedules workloads in an optimal way while controlling the disruption based on the PDB configuration.Once the PDB is set, GKE won’t shut down pods in your application if the number of pods is equal to or less than a configured limit. GKE respects a PDB for up to 60 minutes. Note that the PDB only protects against voluntary disruptions—upgrades for example. It offers no protection against involuntary disruptions (e.g., a hardware failure).Terminate gracefullySometimes, applications need to terminate unexpectedly. By default, Kubernetes sets the termination grace period to 30 seconds. This should be sufficient for most lightweight, cloud-native applications. However the default setting might be too low for heavyweight applications or applications that have long shutdown processes.The recommended best practice is to evaluate your existing grace periods and tune them based on the specific needs of your architecture and application. You can change the termination grace period by altering terminationGracePeriodSeconds.Schedule updates and patchesKeeping your cluster up to date with security patches and bug fixes is one of the most important things you can do to ensure the vitality of the cluster and business continuity. Regular updates protect your workloads from vulnerabilities and failures. However, timing plays a major role in performing these updates. Especially now when many teams are working from home or at reduced capacity, you want to increase the predictability of these upgrades, and perhaps avoid changes during regular business hours. You can do that by setting up maintenance windows, sequencing roll-outs, and setting up maintenance exclusions. Set your maintenance windowsSetting up a maintenance window lets you control automatic upgrades to both the cluster control plane and its nodes. GKE respects maintenance windows. Namely if the upgrade process runs beyond the defined maintenance window, GKE will attempt to pause the operation and resume it during the next maintenance window.You can also use maintenance windows in a multi-cluster environment to control and sequence disruption in different clusters. For example, you may want to control when to perform maintenance on clusters in different regions by setting different maintenance windows for each cluster.Practice regular updates New GKE releases are rolled out on a regular basis as patches become available in the fleet.The rollout process of these updates is done gradually, and some version upgrades may take several weeks to completely rollout in the entire GKE fleet.Nonetheless, in times of uncertainty, you can specify the day and time maintenance can occur in a week by setting your maintenance windows, to better plan and anticipate maintenance to your clusters.Please do not disturbThere are times when you may want to completely avoid maintenance (e.g. holidays, high season, company events, etc.), to ensure your clusters are available to receive traffic. With maintenance exclusions, you can prevent automatic maintenance from occurring during a specific time period. Maintenance exclusions can be set on new or existing clusters. The exclusion windows can also be used in conjunction with an upgrade strategy. For example, you may want to postpone an upgrade to a production cluster if a testing/staging environment fails because of an upgrade.Upgrade node pool versions without disruptionUpgrading a GKE node pool can be a particularly disruptive process, as it involves recreating every VM in the node pool. The process is to create a new VM with the new version (upgraded image) in a rolling update fashion, which requires shutting down all the pods running on the old node and shifting to the new node.By following the recommendations above, your workloads can run with sufficient redundancy (replicas) to minimize disruption, and Kubernetes will move and restart pods as needed. However, a temporarily reduced number of replicas can be still disruptive to your business, and may slow down workload performance until Kubernetes is able to meet the desired state again (i.e., meet the minimum number of needed replicas). To eliminate this disruption entirely, you can use the GKE node surge upgrade feature. Once configured, surge upgrade secures the resources (machines) needed for the upgrade by first creating a new node, then draining the old node, and finally shutting it down. This way, the expected capacity remains intact throughout the upgrade process.Speed up upgrades for large clustersLarge clusters mean larger nodepools, which can take a long time to upgrade if you’re updating one node at a time—especially if you’ve set a maintenance window. In this case, an upgrade starts at the beginning of the maintenance window, and lasts for the duration of the maintenance window (four hours). If GKE can’t complete upgrading all the nodes within the allotted maintenance window, it pauses the upgrade and resumes it in the next maintenance window.You can accelerate your upgrade completion time by concurrently upgrading multiple nodes with the surge upgrade feature. For example, if you set maxSurge=20 and maxUnavailable=0, GKE will upgrade 20 nodes at a time, without using any existing capacity. Bringing it all togetherContainerized applications are portable and easy to deploy and scale. GKE makes it even easier to run your workloads hassle-free with a wide range of cluster management capabilities. Knowing your application the best, you can drastically improve the availability and vitality of your clusters by following the recommendations above.To learn more, register for the Google Cloud Next ‘20: OnAir session, Ensuring Business Continuity at Times of Uncertainty and Digital-only Business with GKE, which goes live on August 25, 2020.
Quelle: Google Cloud Platform

Data analytics for all — What happened at Week 5, Google Cloud Next ‘20: OnAir

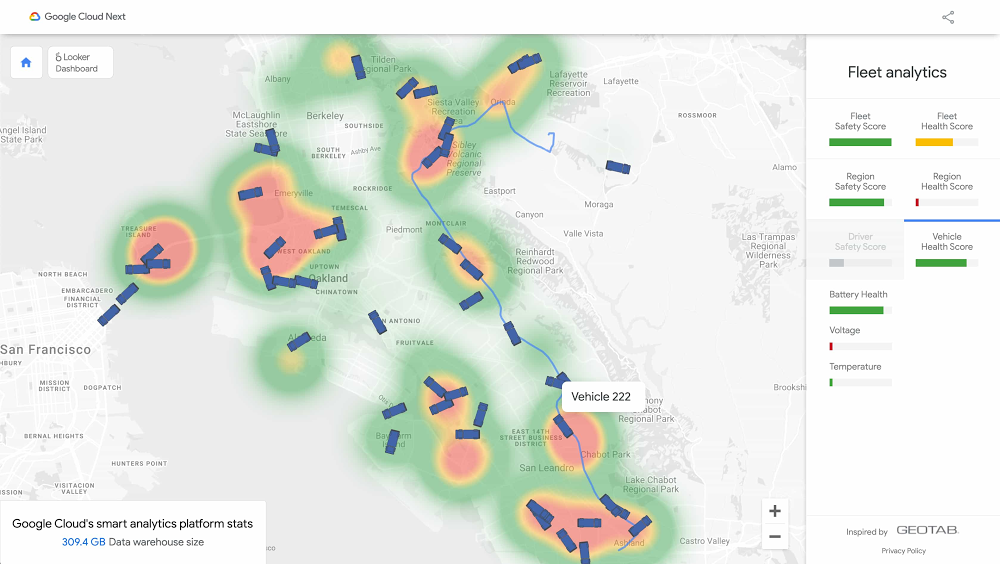
Data analytics technologies are becoming a must-have for businesses looking to stay competitive in a changing environment. And if there’s one lesson from this unpredictable year, it’s that we always need to be prepared for anything. We spent this week at Google Cloud Next ’20: OnAir exploring Google Cloud’s data analytics technologies and hearing how customers across all industries are using BigQuery, Dataflow, Dataproc, Looker and more to drive real-time data insights and power new data-driven applications. Key data analytics announcementsWe kicked off Next OnAir this year with the launch of BigQuery Omni, a multi-cloud analytics solution that lets you query data stored across Google Cloud, AWS and Azure (coming soon). Data QnA, a natural language interface for analytics, also launched at the beginning of Next OnAir, allowing a business user to just ask a question on their company’s dataset and get results back the same way.BigQuery Omni was designed to meet the needs of a multi-cloud computing future. So is Looker, acquired by Google Cloud earlier this year, which powers data experiences that deliver actionable business insights at the point of decision to help meet different types of data users where they are. Check out the latest announcements from Looker, such as new multi-cloud hosting options and new UI components, all designed to optimize costs and use data at greater scale. You can also find a technical deep-dive session on Looker’s technology.Also new this week: BigQuery now offers a 100-slot purchase option, so that SMBs and digital-native businesses can get started more easily, with predictable pricing options. In addition, BigQuery now offers a 99.99% availability with guaranteed SLAs, providing peace of mind that the platform will be available to handle all your mission-critical needs. Finally, we launched detailed and prescriptive design patterns that allow you to build real-time AI solutions like anomaly detection, pattern recognition, and predictive forecasting that can be used across multiple industries. These help you to quickly get started with your organization’s real-time needs. How customers are blazing new trails with analyticsJust this week, we heard how organizations using Google Cloud and data analytics are transforming digitally and improving customer and user experiences. Procter and Gamble shared how their cloud data analytics journey lets them personalize products for consumers. Major League Baseball (MLB) migrated to BigQuery to centralize their enterprise data warehouse (EDW) and bring better decision-making and tailored fan communications.And lifecycle pricing platform provider Revionics chose BigQuery to stay ahead of their application development needs, forecast growth, and give customers up-to-the-minute information at scale. Explore this fleet management demoA conference isn’t complete without demos, and Next OnAir brings them to you for easy exploration. Check out this interactive demo to see how you might increase vehicle safety and health using streaming and predictive analytics, and business intelligence within Google Cloud’s smart analytics platform. And this blog post gives you the backstory on how the demo was developed to create a live simulated world of 7,500 trucks generating approximately 25 million trip events per day. Here’s a look:Go deep with dataThere are plenty more sessions and topics to explore, from building a data lake to implementing real-time AI. If you’re curious about streaming analytics, check out this session on creating and managing real-time experiences. Wherever you are in your modernization journey, you can find tips and how-tos, like this post for DBAs on how to easily adapt to cloud data warehouses. Looking ahead: Data managementLooking forward to more Next OnAir? Next week is all about data management. On Tuesday, August 18, Penny Avril, director of product management for databases at Google Cloud, will talk with chat app ShareChat about how they’ve modernized their database infrastructure to stay ahead of user demand, plus dive into product features.Next OnAir runs through September 8, and you can find live technical talks and learning opportunities aligned with each week’s content. Click “Learn” on the Explore page to find each week’s schedule. Haven’t yet registered for Google Cloud ’20 Next: OnAir? Get started at g.co/cloudnext.
Quelle: Google Cloud Platform

How To Use the Official NGINX Docker Image

NGINX is one of the most popular web servers in the world. Not only is NGINX a fast and reliable static web server, it is also used by a ton of developers as a reverse-proxy that sits in front of their APIs. 

In this tutorial we will take a look at the NGINX Official Docker Image and how to use it. We’ll start by running a static web server locally then we’ll build a custom image to house our web server and the files it needs to serve. We’ll finish up by taking a look at creating a reverse-proxy server for a simple REST API and then how to share this image with your team.

Prerequisites

To complete this tutorial, you will need the following:

Free Docker Account You can sign-up for a free Docker account and receive free unlimited public repositoriesDocker running locallyInstructions to download and install DockerAn IDE or text editor to use for editing files. I would recommend VSCode

NGINX Official Image

The Docker Official Images are a curated set of Docker repositories hosted on Docker Hub that have been scanned for vulnerabilities and are maintained by Docker employees and upstream maintainers.

Official Images are a great place for new Docker users to start. These images have clear documentation, promote best practices, and are designed for the most common use cases.

Let’s take a look at the NGINX official image. Open your favorite browser and log into Docker. If you do not have a Docker account yet, you can create one for free.

Once you have logged into Docker, enter “NGINX” into the top search bar and press enter. The official NGINX image should be the first image in the search results. You will see the “OFFICIAL IMAGE” label in the top right corner of the search entry.

Now click on the nginx result to view the image details.

On the image details screen, you are able to view the description of the image and it’s readme. You can also see all the tags that are available by clicking on the “Tags” tab

Running a basic web server

Let’s run a basic web server using the official NGINX image. Run the following command to start the container.

$ docker run -it –rm -d -p 8080:80 –name web nginx

With the above command, you started running the container as a daemon (-d) and published port 8080 on the host network. You also named the container web using the –name option. 

Open your favorite browser and navigate to http://localhost:8080   You should see the following NGINX welcome page.

This is great but the purpose of running a web server is to serve our own custom html files and not the default NGINX welcome page.

Let’s stop the container and take a look at serving our own HTML files.

$ docker stop web

Adding Custom HTML

By default, Nginx looks in the /usr/share/nginx/html directory inside of the container for files to serve. We need to get our html files into this directory. A fairly simple way to do this is use a mounted volume. With mounted volumes, we are able to link a directory on our local machine and map that directory into our running container.

Let’s create a custom html page and then serve that using the nginx image.

Create a directory named site-content. In this directory add an index.html file and add the following html to it:

<!doctype html>
<html lang=”en”>
<head>
<meta charset=”utf-8″>
<title>Docker Nginx</title>
</head>
<body>
<h2>Hello from Nginx container</h2>
</body>
</html>

Now run the following command, which is the same command as above, but now we’ve added the -v flag to create a bind mount volume. This will mount our local directory ~/site-content locally into the running container at: /usr/share/nginx

$ docker run -it –rm -d -p 8080:80 –name web -v ~/site-content:/usr/share/nginx nginx

Open your favorite browser and navigate to http://localhost:8080 and you should see the above html rendered in your browser window.

Build Custom NGINX Image

Bind mounts are a great option for running locally and sharing files into a running container. But what if we want to move this image around and have our html files moved with it?

There are a couple of options available but one of the most portable and simplest ways to do this is to copy our html files into the image by building a custom image.

To build a custom image, we’ll need to create a Dockerfile and add our commands to it.

In the same directory, create a file named Dockerfile and paste the below commands.

FROM nginx:latest
COPY ./index.html /usr/share/nginx/html/index.html

We start building our custom image by using a base image. On line 1, you can see we do this using the FROM command. This will pull the nginx:latest image to our local machine and then build our custom image on top of it.

Next, we COPY our index.html file into the /usr/share/nginx/html directory inside the container overwriting the default index.html file provided by nginx:latest image.

You’ll notice that we did not add an ENTRYPOINT or a CMD to our Dockerfile. We will use the underlying ENTRYPOINT and CMD provided by the base NGINX image.

To build our image, run the following command:

$ docker build -t webserver .

The build command will tell Docker to execute the commands located in our Dockerfile. You will see a similar output in your terminal as below:

Now we can run our image in a container but this time we do not have to create a bind mount to include our html.

$ docker run -it –rm -d -p 8080:80 –name web webserver

Open your browser and navigate to http://localhost:8080 to make sure our html page is being served correctly.

Setting up a reverse proxy server

A very common scenario for developers, is to run their REST APIs behind a reverse proxy. There are many reasons why you would want to do this but one of the main reasons is to run your API server on a different network or IP then your front-end application is on. You can then secure this network and only allow traffic from the reverse proxy server.

For the sake of simplicity and space, I’ve created a simple frontend application in React.js and a simple backend API written in Node.js. Run the following command to pull the code from GitHub.

$ git clone https://github.com/pmckeetx/docker-nginx.git

Once you’ve cloned the repo, open the project in your favorite IDE. Take a look at Dockerfile in the frontend directory.

FROM node:12.18.2 as build

ARG REACT_APP_SERVICES_HOST=/services/m

WORKDIR /app

COPY ./package.json /app/package.json
COPY ./package-lock.json /app/package-lock.json

RUN yarn install
COPY . .
RUN yarn build

FROM nginx
COPY ./nginx/nginx.conf /etc/nginx/conf.d/default.conf
COPY –from=build /app/build /usr/share/nginx/html

The Dockerfile sets up a multi-stage build. We first build our React.js application and then we copy the nginx.conf file from our local machine into the image along with our static html and javascript files that were built in the first phase.

We configure the reverse proxy in the frontend/nginx/nginx.conf file. You can learn more about configuring Nginx in their documentation.

server {
listen 80;
server_name frontend;
location / {
# This would be the directory where your React app’s static files are stored at
root /usr/share/nginx/html;
try_files $uri /index.html;
}

location /services/m {
proxy_set_header X-Real-IP $remote_addr;
proxy_set_header X-Forwarded-For $proxy_add_x_forwarded_for;
proxy_set_header X-NginX-Proxy true;
proxy_pass http://backend:8080/services/m;
proxy_ssl_session_reuse off;
proxy_set_header Host $http_host;
proxy_cache_bypass $http_upgrade;
proxy_redirect off;
}
}

As you can see in the second location section thatall traffic targeted to /services/m will be proxy_pass to http://backend:8080/services/m

In the root of the project is a Docker Compose file that will start both our frontend and backend services. Let’s start up our application and test if the reverse proxy is working correctly.

$ docker-compose -up
Creating network “docker-nginx_frontend” with the default driver
Creating network “docker-nginx_backend” with the default driver
Creating docker-nginx_frontend_1 … done
Creating docker-nginx_backend_1 … done
Attaching to docker-nginx_backend_1, docker-nginx_frontend_1
frontend_1 | /docker-entrypoint.sh: Configuration complete; ready for start up
backend_1 | Listening on port 8080

You can see that our nginx web server has started and also our backend_1 service has started and is listening on port 8080.

Open your browser and navigate to http://localhost. You should see the following web page:

Open the developer tools window and click on the “network” tab. Now back in the browser, enter an entity name. This can be anything. I’m going to use “widgets”. Then click the “Submit” button.

Over in the developer tools window, click on the network request for widgets and see that the request was made to http://localhost and not to http://localhost:8080.

Open your terminal and notice that request that was made from the browser was proxied to the backend_1 service and handled correctly.

Shipping Our Image

Now let’s share our images on Docker so others on our team can pull the images and run them locally. This is also a great way to share your application with others outside of your team such as testers and business owners. 

To push your images to Docker’s repository run the docker tag and then the docker push commands. You will first need to login with your Docker ID. If you do not have a free account, you can create one here.

$ docker login
$ docker tag nginx-frontend <dockerid>/nginx-frontend
$ docker push <dockerid>/nginx-frontend

Conclusion

In this article we walked through running the NGINX official image, adding our custom html files, building a custom image based off of the official image and configuring the NGINX as a reverse proxy. We finished up by pushing our custom image to Docker so we could share with others on our team. 

If you have any questions, please feel free to reach out on Twitter @pmckee and join us in our community slack.
The post How To Use the Official NGINX Docker Image appeared first on Docker Blog.
Quelle: https://blog.docker.com/feed/






