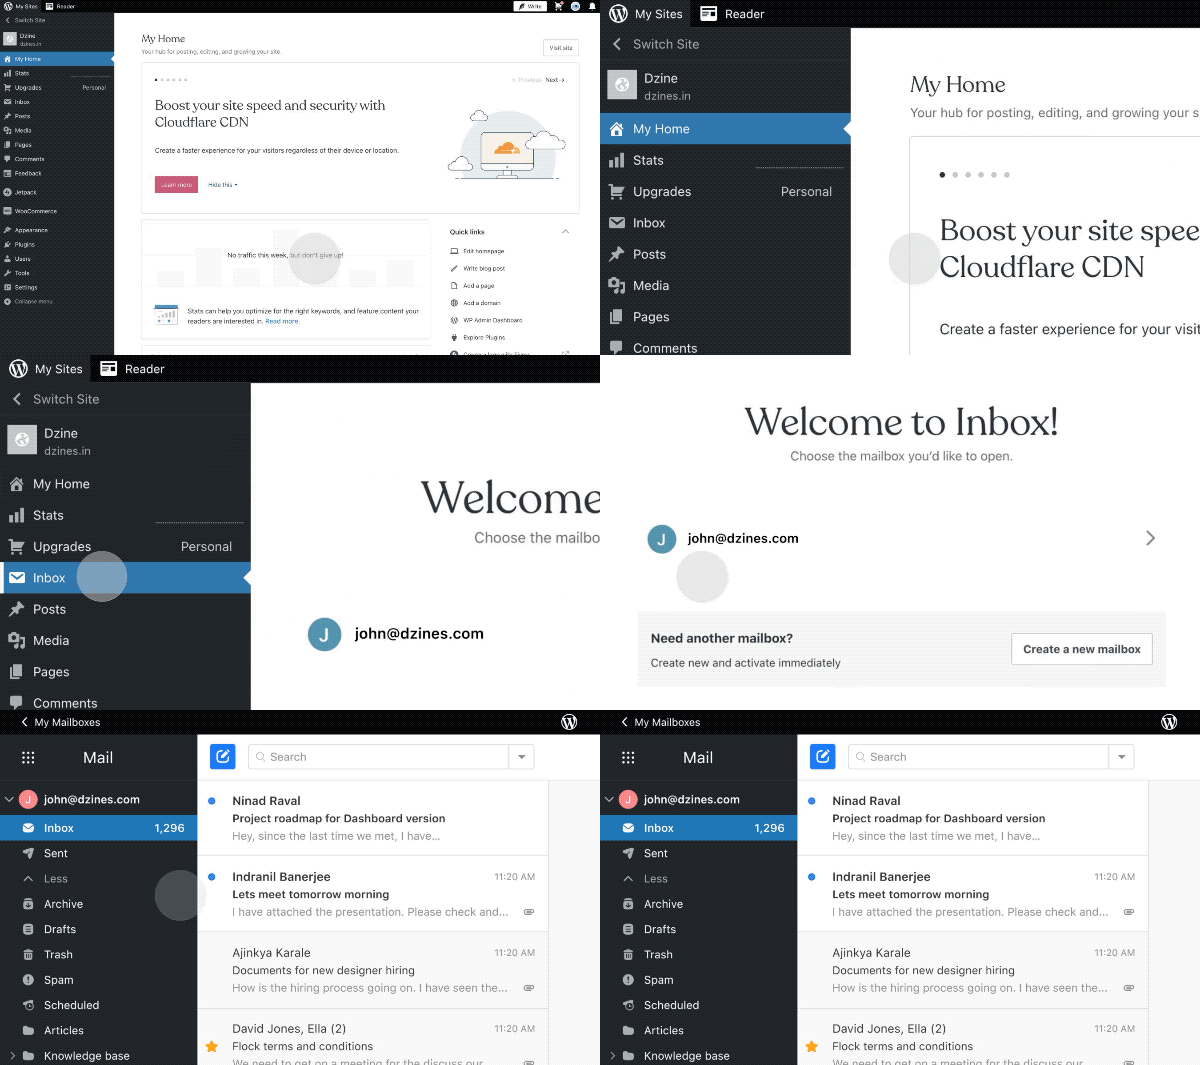
Access your Professional Email inbox directly from WordPress.com

Every day we’re connected to a million apps, and we browse through multiple browser tabs just to complete a single action item. We have busy schedules that would benefit from streamlined processes, simple tools, and powerful workflows. With that in mind, our team asked for feedback, and that inspired us to put together a new solution—your Professional Email inbox baked right into your WordPress.com site.

You can now manage your inbox and website from the same place, eliminating the need for multiple sets of credentials and URLs. Once you’re securely logged in, we’ll save you the clicks and multiple tabs that managing your work used to take, allowing you to operate directly from your website dashboard.

A few time-saving hacks to get the most from your embedded inbox:

Easily connect with your audience or community from your site while checking your site followers.

Post a blog post, head directly to your inbox, and share it with your customers. 

Create a new product to sell and share the news directly from your site dashboard.

Ready to try it out?

Start here

Quelle: RedHat Stack

Introducing Query Insights for Cloud Spanner: troubleshoot performance issues with pre-built dashboards

Today, application development teams are more agile and are shipping features faster than ever before. In addition to these rapid development cycles and the rise of microservices architectures, the end-to-end ownership of feature development (and performance monitoring) has moved to a shared responsibility model between advanced database administrators and full-stack developers. However, most developers don’t have the years of experience or the time needed to debug complex query performance issues and database administrators are now a scarce resource in most organizations. As a result, there is a dire need for tools for developers and DBAs alike to quickly diagnose performance issues. Introducing Query Insights for SpannerWe are delighted to announce the launch of Query Insights for Spanner,  a set of visualization tools that provide an easy way for developers and database administrators to quickly diagnose query performance issues on Spanner. Using Query Insights, users can now troubleshoot query performance in a self-serve way. We’ve designed Query Insights using familiar design patterns with world-class visualizations to provide an intuitive experience for anyone who is debugging issues with query performance on Spanner. Query Insights is available at no additional cost.By using out-of-the-box visual dashboards and graphs, developers can visualize aberrant behavior like peaks and troughs in various performance metrics over a time-series and quickly identify problematic queries. Time series data provides significant value to organizations because it enables them to analyze important real-time and historical metrics. Data is valuable only if it’s easy to comprehend;. that’s where being able to view intuitive dashboards becomes a force multiplier for organizations looking to expose their time series data across teams.Follow a visual journey with pre-built dashboardsWith Query Insights, developers can seamlessly move from detection of database performance issues to diagnosis of problematic queries using a single interface. Query Insights will help identify query performance issues easily with pre-built dashboards. The user could do this by following a simple journey where they can quickly confirm, identify and analyze query performance issues. Let’s walk through an example scenario. Understand database performanceThis journey will start by the user setting up an alert on Google Cloud Monitoring for CPU utilization going above a certain threshold. The alert could be configured in a way that if this threshold is crossed, the user will be notified with an email alert, with a link to the “Monitoring” dashboard.Once the user receives this alert, they would click on the link in the email, and navigate to the “Monitoring” dashboard. If they observe high CPU Utilization and high read latencies, the possible root cause could be expensive queries. A spike in CPU Utilization could be a strong signal that the system is using more compute than it usually would, due to an inefficient query.The next step is to identify which query might be the problem, this is where Query Insights comes in. The user can get to this tool by clicking on Query Insights in the left navigation of your Spanner Instance. Here, they can drill down into the CPU usage by query and observe that for a specific database, CPU Utilization (attributed to all queries) is spiking for a particular time window. This confirms that the CPU utilization is due to inefficient queries.Identifying a problematic queryThe user now observes the TopN (Top queries by CPU Utilization) query graph to see the TopN queries by CPU Utilization. From the graph, it is very easy to visualize and identify the top queries which could be causing the spike in CPU Utilization.In the above screenshot, we can see that the first query in the table is showing a clear spike at 10:33 PM consuming 48.81% of total CPU. This is  a clear indication that this query could be problematic, and the user should investigate further.Analyzing the query performanceOnce they have identified the problematic query, they can now drill down into this query shape to confirm, identify the root cause of the high CPU utilization. They can do this by clicking on the Fingerprint ID for the specific query from the topN table, and navigating to the Query Details page where they will be able to see a list of metrics (Latency, CPU Utilization, Execution count, Rows Scanned / Rows Returned) over a time series for that specific query.  In this example, we notice that the average number of rows scanned for this specific query are very high (~ 600k rows scanned to return ~ 12k rows), which could point to a poor query design, resulting in an inefficient query. We can also observe that latency is high (1.4s) for this query.Fixing the issueTo fix the problem in this scenario, the user could optimize this query by specifying a secondary index in the query using a FORCE_INDEX query hint to provide an index directive. This would provide more consistent performance, make the query more efficient, and lower CPU utilization for this query.In the screenshot below, you can see that after specifying the index in the query, the query performance dramatically increases in terms of CPU, rows scanned (54K vs 630k) and also in terms of query latency (536 ns vs 1.4 s).Unoptimized Query:Optimized Query:By following this simple visual journey, the user can easily detect, diagnose and debug inefficient queries on Spanner.Get started with Query Insights todayTo learn more about Query Insights, review the documentation here. Query Insights is enabled by default. In the Spanner console, you can click on Query Insights in the left navigation and start visualizing your query performance metrics! New to Spanner? Get started in minutes with a new database.Related ArticleImproved troubleshooting with Cloud Spanner introspection capabilitiesCloud-native database Spanner has new introspection capabilities to monitor database performance and optimize application efficiency.Read Article
Quelle: Google Cloud Platform

IP Masquerading and eBPF are now in GKE Autopilot

So you’re deploying Kubernetes and you’ve been ready-to-go with your containerized applications. But one problem you’ve faced is IP exhaustion across your diverse environments and your clusters need to talk to your on-prem clusters or hosts. Or maybe your workloads talk to a service that expects only RFC 1918 addresses for regulatory or compliance reasons. You can now translate your pod IPs to your node IPs on GKE Autopilot clusters with the latest networking features that are generally available:Our Egress NAT policy with IP masquerading for pod to node IP translation is now GA for GKE Autopilot, andOur advanced programmable datapath based on eBPF, Dataplane V2 (DPv2), with support for Network Policy & Logging is also now GA for GKE Autopilot.Egress NAT Policy for GKE AutopilotEgress NAT policy allows you to masquerade your pod IPs to the node IP addresses, enabling pods (typically in a separate network island) to communicate outside the cluster using the IP address of a node as the source IP. Some of our users have used special IPs (non-RFC 1918 addresses) for their pod ranges to expand their IP usage by leveraging Reserved or Class E IP space. A few use cases for wanting to masquerade the pod IPs to those of the nodes is for communication back to on-premise workloads for security or compliance reasons, or just for compatibility reasons. Previously, users were not able to configure IP masquerading due to managed namespace restrictions in GKE Autopilot. With the Egress NAT policy custom resource definition (CRD), we’ve enabled a user-facing API to allow you to configure IP masquerading on GKE Autopilot clusters. “We use GKE Autopilot because of its reduced operational overhead and potential cost reductions. The addition of IP masquerading via Egress NAT policy expands our use of Autopilot to include accessing on-premises data and systems.” —Joey Brown, Engineering Manager at American Family Insurance.Our long-term goal is to have the same API and feature set across GKE and Anthos platforms. We have extended Egress NAT policy in Anthos to provide NAT functionality based on K8s resources like namespaces and/or labels. This new Egress NAT policy on GKE Autopilot clusters provides source NAT controls to start. With this launch, we’re taking the initial step in achieving the first milestone on our roadmap.Cloud Composer 2, a Google managed workflow orchestration service built on Apache Airflow, uses GKE Autopilot under the hood. Cloud Composer 2 users also benefit from the introduction of Egress NAT policies to enable communication to various environments. “We are a big Cloud Composer user as part of our GCP journey. We have dealt with IP shortages by using non-RFC 1918 address space for our GKE clusters. With Egress NAT policy, we can now use IP masquerading with Cloud Composer 2. Workloads using non-RFC 1918 addressing with Cloud Composer 2 are now able to make API calls to our wider Equifax applications. We are excited about using Egress NAT policies with Cloud Composer 2 to enable more of our applications on GCP.”–Siddharth Shekhar, Site Reliability Engineer – Specialist at Equifax.Egress NAT policy is now generally available on GKE Autopilot clusters with DPv2 in versions 1.22.7-gke.1500+ or 1.23.4-gke.1600+. For configuration examples of Egress NAT policy, please refer to our how-to guide in the GKE documentation.GKE Autopilot with Dataplane V2 (DPv2)Have you been wanting to segregate your cluster workloads and understand when your Network Policies are enforced? GKE Autopilot now uses Dataplane V2 (DPv2) for container networking, a datapath integrated into Google infrastructure based on eBPF. With this advanced dataplane, you, as a GKE Autopilot user, can now take advantage of features like Network Policy and Network Policy Logging. With DPv2 support, GKE Autopilot clusters can now benefit from the advantages that GKE standard clusters currently have with DPv2:Security via Kubernetes Network Policy Scalability by removing iptables and kube-proxy implementationsOperational benefits with Network Policy LoggingConsistency with Anthos and GKE environments.Network Policy Logging enables security teams to audit logs and understand allowed or denied traffic flows based on existing Network Policies. It can be configured as an object on your GKE cluster and filtered per various parameters. The following is an example of a logged entry retrieved after an attempted access that was denied.code_block[StructValue([(u’code’, u”jsonPayload:rn connection:rn dest_ip: 10.67.0.10rn dest_port: 8080rn direction: ingressrn protocol: tcprn src_ip: 10.67.0.28rn src_port: 46988rn count: 2rn dest:rn namespace: defaultrn pod_name: hello-webrn pod_namespace: defaultrn disposition: denyrn node_name: gk3-autopilot-cluster-1-nap-4lime7d7-dba77360-8td5rn src:rn namespace: defaultrn pod_name: test-1rn pod_namespace: defaultrnlogName: projects/PROJECT/logs/policy-actionrnreceiveTimestamp: ‘2022-04-19T22:07:03.658959451Z’rnresource:rn labels:rn cluster_name: autopilot-cluster-1rn location: us-west1rn node_name: gk3-autopilot-cluster-1-nap-4lime7d7-dba77360-8td5rn project_id: PROJECTrn type: k8s_noderntimestamp: ‘2022-04-19T22:06:56.139253838Z'”), (u’language’, u”), (u’caption’, <wagtail.wagtailcore.rich_text.RichText object at 0x3eaca53a33d0>)])]Network Policy Logs are automatically uploaded to Cloud Logging and can also be retrieved via the Cloud Console Log Explorer. Network Policy metrics are also enabled with Dataplane v2 such that policy event metrics can be monitored even when Network Policy Logging is not enabled.GKE Autopilot uses DPv2 for all newly created clusters starting in GKE versions 1.22.7-gke.1500+ or 1.23.4-gke.1600+. For more information about Dataplane V2, check out our GKE Dataplane V2 docs. Getting started with GKE Autopilot with DPv2 is as easy as entering the following gcloud command:code_block[StructValue([(u’code’, u’gcloud container clusters create-auto CLUSTER_NAME \rn –region REGION \rn –project=PROJECT_ID’), (u’language’, u”), (u’caption’, <wagtail.wagtailcore.rich_text.RichText object at 0x3eaca53a31d0>)])]To learn more about GKE Autopilot, check out our Overview page.Related ArticleIntroducing GKE Autopilot: a revolution in managed KubernetesGKE Autopilot gives you a fully managed, hardened Kubernetes cluster out of the box, for true hands-free operations.Read Article
Quelle: Google Cloud Platform