Cloud Monitoring metrics, now in Managed Service for Prometheus

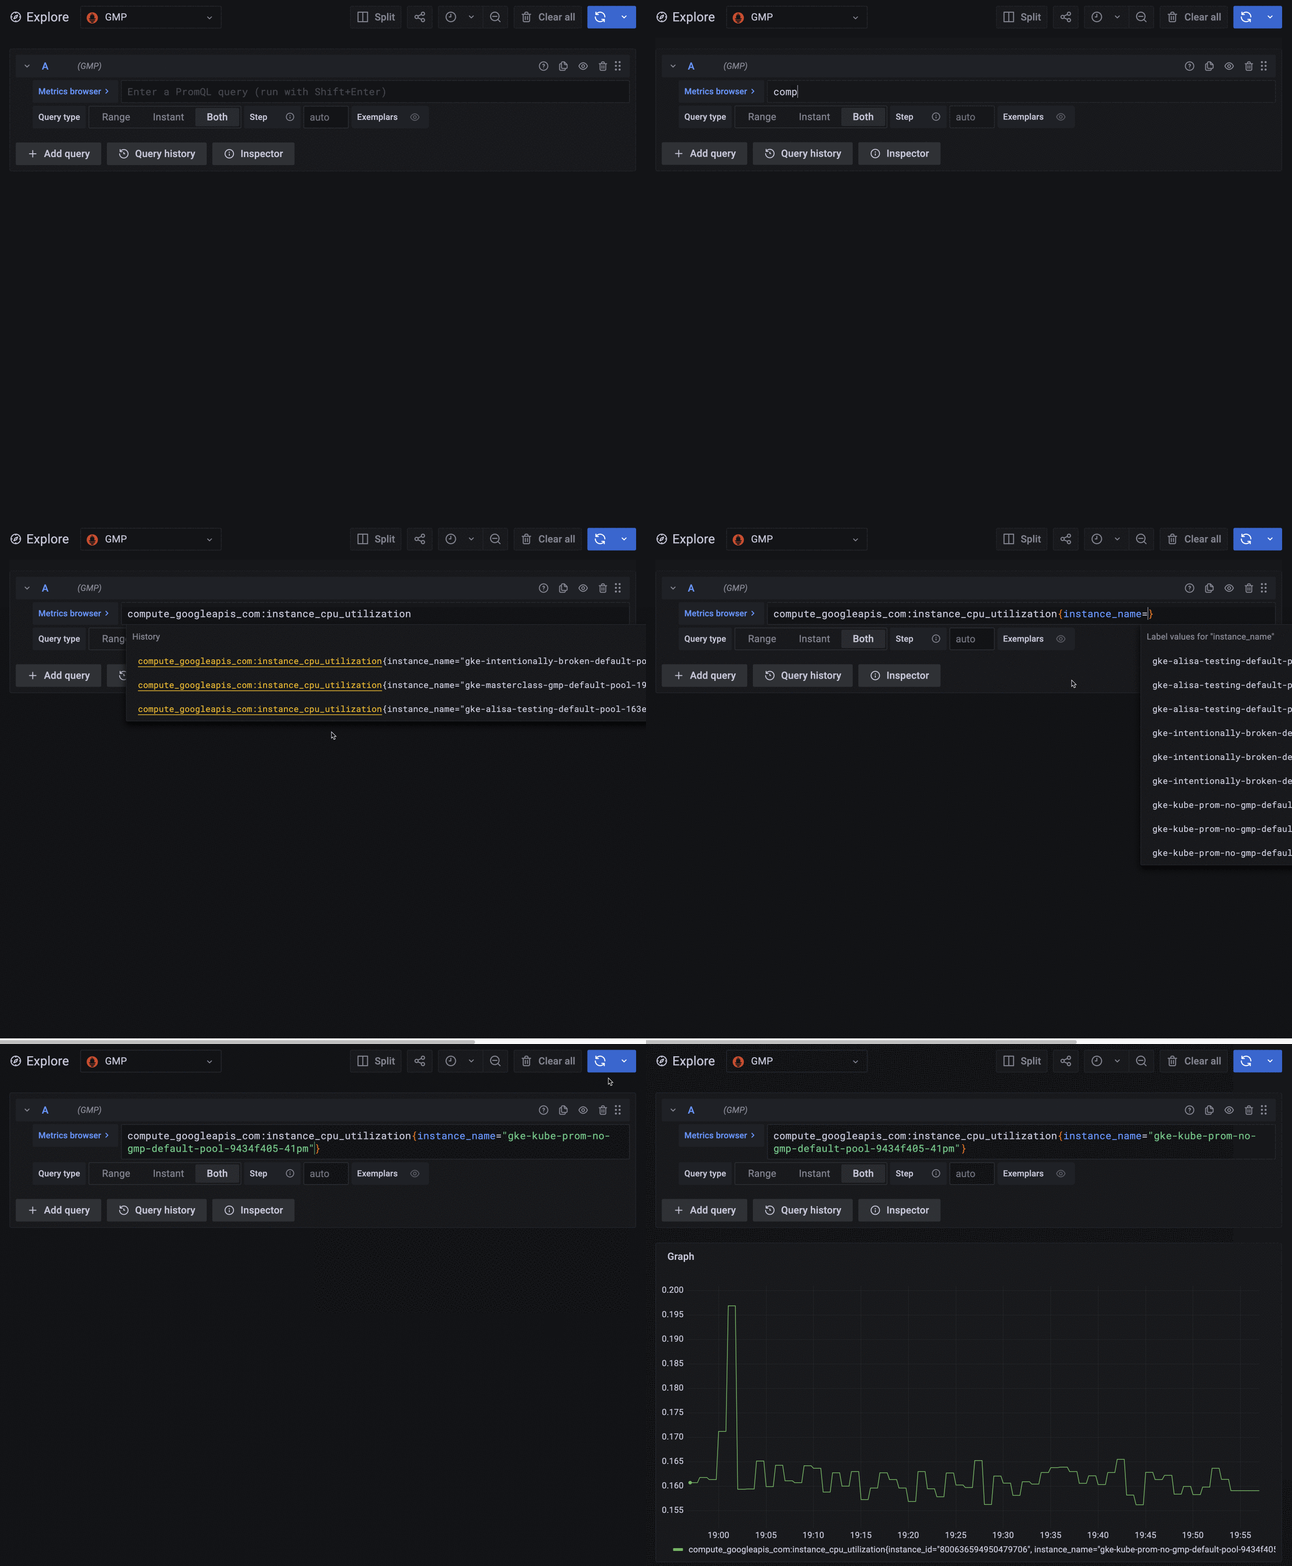
According to a recent CNCF survey, 86% of the cloud native community reports that they use Prometheus for observability. As Prometheus becomes more of a standard, an increasing number of developers are becoming fluent in PromQL, Prometheus’ built-in query language. While it is a powerful, flexible, and expressive query language, PromQL is typically only able to query Prometheus time series data. Other sources of telemetry, such as metrics offered by your Cloud provider or metrics generated from logs, remain isolated in separate products and might require developers to learn new query tools in order to access them.Introducing PromQL for Google Cloud Monitoring metricsPrometheus metrics alone aren’t enough to get a single pane of glass view of your Cloud footprint. Cloud Monitoring provides over 1,000 free metrics that let you monitor and alert on your usage of Google Cloud services, including metrics for Compute Engine, Kubernetes Engine, Load Balancing, BigQuery, Cloud Storage, Pub/Sub, and more. We’re excited to announce that you can now query all Cloud Monitoring metrics using PromQL and Managed Service for Prometheus, including Google Cloud system metrics, Kubernetes metrics, log-based metrics, and custom metrics.Google Cloud metrics appear within Grafana and can be queried using PromQL.Because we built Managed Service for Prometheus on top of the same planet-scale time series database as Cloud Monitoring, all your metrics are stored together and are queryable together. Metrics in Cloud Monitoring are automatically generated when you use Google Cloud services at no additional cost to you. View all your metrics in one place with the query language that developers already know and prefer, opening up possibilities such as:Correlating spikes in traffic with Redis cache misses using Cloud Load Balancing metrics and Prometheus’ Redis exporterGraphing Cloud Logging’s logs-based metrics alongside Prometheus metricsAlerting on your Compute Engine utilization or your Pub/Sub backlog size using PromQL and Managed Service for Prometheus’ rule evaluationSubstituting paid Istio metrics for their free Google Cloud Istio or Anthos Service Mesh equivalentExposing these metrics using PromQL means that developers who are familiar with Prometheus can start using all time series telemetry data without first having to learn a new query language. New members of your operations team can ramp up faster, as many industry hires will already be familiar with PromQL from previous experience.Why Managed Service for PrometheusIn addition to PromQL for all metrics, Managed Service for Prometheus offers open-source monitoring combined with the scale and reliability of Google services. Additional benefits include: Hybrid- and multi-cloud support, so you can centralize all your metrics across clouds and on-prem deploymentsTwo-year retention of all Prometheus metrics, included in the priceCost-effective monitoring on a per-sample basisEasy cost identification and attribution using Cloud MonitoringYour choice of collection, with managed collection for those who want a completely hands-off Prometheus experience and self-deployed collection for those who want to keep using existing Prometheus configsHow to get startedYou can query Cloud Monitoring metrics with PromQL by using the interactive query page in Cloud Console or Grafana. To learn how to write PromQL for Google Cloud metrics, see Mapping Cloud Monitoring metric names to PromQL. To configure a Grafana data source that can read all your metrics in Cloud Monitoring, see Configure a query user interface in the Managed Service for Prometheus documentation.To query Prometheus data alongside Cloud Monitoring, you have to first get Prometheus data into the system. For instructions on configuring Managed Service for Prometheus ingestion, see Get started with managed collection.Related ArticleGoogle Cloud Managed Service for Prometheus is now generally availableAnnouncing the GA of Google Cloud Managed Service for Prometheus for the collection, storage, and querying of Kubernetes metrics.Read Article
Quelle: Google Cloud Platform
Announcing Apigee Advanced API Security for Google Cloud

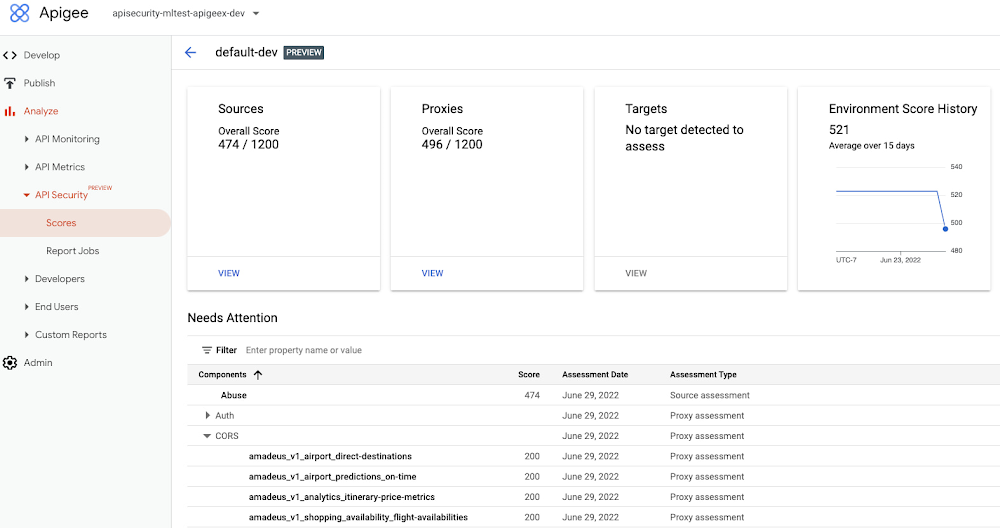
Organizations in every region and industry are developing APIs to enable easier and more standardized delivery of services and data for digital experiences. This increasing shift to digital experiences has grown API usage and traffic volumes. However, as malicious API attacks also have grown, API security has become an important battleground over business risk. To help customers more easily address their growing API security needs, Google Cloud is announcing today the Preview of Advanced API Security, a comprehensive set of API security capabilities built on Apigee, our API management platform. Advanced API Security enables organizations to more easily detect security threats. Here’s a closer look at the two key functionality included in this launch: identifying API misconfigurations and detecting bots.Identify API misconfigurationsMisconfigured APIs are one of the leading reasons for API security incidents. In 2017, Gartner® predicted that by 2022 API abuses will be the most frequent attack vector resulting in data breaches for enterprise web applications. Today, our customers tell us application API security is one of their top concerns, which is supported by an independent study from 2021 by Fugue and Sonatype. The report found that misconfigurations are the number one cause of data breaches, and that “too many cloud APIs and interfaces to adequately govern” are frequently the main point of attack in cyberattacks.While identifying and resolving API misconfigurations is a top priority for many organizations, the configuration management process can be time consuming and require considerable resources.Advanced API Security can make it easier for API teams to identify API proxies that do not conform to security standards. To help identify APIs that are misconfigured or experiencing abuse, Advanced API Security regularly assesses managed APIs and provides API teams with a recommended action when configuration issues are detected.Advanced API Security identifies misconfigured API proxies, including the missing CORS policy.APIs form an integral part of the digital connective tissue that make modern medicine run smoothly for patients and healthcare staff. One common healthcare API use case occurs when a healthcare organization inputs a patient’s medical coverage information into a system that works with insurance companies. Almost instantly, that system determines the patient’s coverage for a specific medication or procedure, a process which is enabled by APIs. Because of the often-sensitive personal healthcare data being transmitted, it is important that the required authentication and authorization policies are implemented so that only authorized users, such as an insurance company, can access the API. Advanced API Security can detect if those required policies have not been applied, an alert which can help reduce the surface area of API security risks. By leveraging Advanced API Security, API teams at healthcare organizations can more easily detect misconfiguration issues and can reduce security risks to sensitive information. Detect BotsBecause of the increasing volume of API traffic, there is also an increase in cybercrime in the form of API bot attacks—the automated software programs deployed over the Internet for malicious purposes like identity theft. Advanced API Security uses pre-configured rules to help provide API teams an easier way to identify malicious bots within API traffic. Each rule represents a different type of unusual traffic from a single IP address. If an API traffic pattern meets any of the rules, Advanced API Security reports it as a bot.Additionally, Advanced API Security can speed up the process of identifying data breaches by identifying bots that successfully resulted in the HTTP 200 OK success status response code.Advanced API Security helps visualize Bot traffic per API proxy.Financial services APIs are frequently the target of malicious bot attacks due to the high-value data that is processed. A bank that has adopted open banking standards by making APIs accessible to customers and partners can use Advanced API Security to make it easier to analyze traffic patterns and identify the sources of malicious traffic. You may experience this when your bank allows you to access your data with a third-party application. While a malicious hacker could try to use a bot to access this information, Advanced API Security can help the bank’s API team to identify and stop malicious bot activity in API traffic.API Security at EquinixEquinix powers the world’s digital leaders, bringing together and interconnecting infrastructure to fast-track digital advantage. Operating a global network of more than 240 data centers with a 99.999% or greater uptime, Equinix simplifies global interconnections for organizations, saving customers time and effort with the Apigee API management platform.  “A key enabler of our success is Google’s Apigee, delivering digital infrastructure services securely and quickly to our customers and partners,” said Yun Freund, senior vice president of Platform at Equinix. “Security is a key pillar to our API-first strategy and Apigee has been instrumental in enabling our customers to securely bridge the connections they need for their businesses to easily identify potential security risks and mitigate threats in a timely fashion. As our API traffic has grown, so has the amount of time and effort required to secure our APIs. Having a bundled solution in one managed platform gives us a differentiated high-performing solution.”Getting startedTo learn more, check out the documentation or contact us to request access to get started with Advanced API Security.To learn more about API security best practices, please register to attend our Cloud OnAir webcast on Thursday, July 28th, 2:00 pm PT.Gartner, API Security: What You Need to Do to Protect Your APIs, Mark O’Neill, Dionisio Zumerle, Jeremy D’Hoinne, 28 August 2019GARTNER is a registered trademark and service mark of Gartner, Inc. and/or its affiliates in the U.S. and internationally and is used herein with permission. All rights reserved.Related ArticleCISO Perspectives: June 2022Google Cloud CISO Phil Venables shares his thoughts on the RSA Conference and the latest security updates from the Google Cybersecurity A…Read Article
Quelle: Google Cloud Platform
MLOPs Blog Series Part 3: Testing scalability of secure machine learning systems using MLOps

The capacity of a system to adjust to changes by adding or removing resources to meet demand is known as scalability. Here are some tests to check the scalability of your model.

System testing

System tests are carried out to test the robustness of the design of a system for given inputs and expected outputs (for example, an MLOps pipeline, inference). Acceptance tests (to fulfill user requirements) can be performed as part of system tests.

A/B testing

A/B testing is performed by sending production traffic to alternate systems that will be evaluated. Statistical hypothesis testing is used to decide which system is better.

Figure 1: A/B testing

Canary testing

Canary testing is done by delivering the majority of production traffic to the current system while sending traffic from a small group of users to the new system we're evaluating.

Figure 2: Canary testing

Shadow testing

Sending the same production traffic to various systems is known as shadow testing. Shadow testing is simple to monitor and validates operational consistency.

Figure 3: Shadow testing

Load testing

Load testing is a technique for simulating a real-world load on software, applications, and websites. Load testing simulates numerous users using a software application to simulate the expected usage of the program. It measures the following:

•    Endurance: Whether an application can resist the processing load, it is expected to have to endure for an extended period.
•    Volume: The application is subjected to a large volume of data to test whether the application performs as expected.
•    Stress: Assessing the application's capacity to sustain a specified degree of efficacy in adverse situations.
•    Performance: Determining how a system performs in terms of responsiveness and stability under a particular workload.
•    Scalability: Measuring the application's ability to scale up or down as a reaction to an increase in the number of users.

Load tests can be performed to test the above factors using various software applications. Let’s look at an example of load testing an AI microservice using locust.io. The dashboard in Figure 4 reflects the total requests made to the microservice per second as well as the response times. Using these insights, we can gauge the performance of the AI microservice under a certain load.

Figure 4: Load testing using Locust.io

Learn more

To learn more about the implementation of the above test, watch this demo video and view the code of load testing AI microservices using locust.io. You can check out the code on the load testing microservices GitHub repository. For further details and to learn about hands-on implementation, check out the Engineering MLOps book, or learn how to build and deploy a model in Azure Machine Learning using MLOps in the “Get Time to Value with MLOps Best Practices” on-demand webinar.
Quelle: Azure

New Extensions, Improved logs, and more in Docker Desktop 4.10

We’re excited to announce the launch of Docker Desktop 4.10. We’ve listened to your feedback, and here’s what you can expect from this release. 
Easily find what you need in container logs
If you’re going through logs to find specific error codes and the requests that triggered them — or gathering all logs in a given timeframe — the process should feel frictionless. To make logs more usable, we’ve made a host of improvements to this functionality within the Docker Dashboard. 
First, we’ve improved the search functionality in a few ways:

You can begin searching simply by typing Cmd + F / Ctrl + F (for Mac and Windows).
Log search results matches are now highlighted. You can use the right/left arrows or  Enter / Shift + Enter  to jump between matches, while still keeping previous logs and subsequent logs in view.
We’ve added regular expression search, in case you want to do things like find all errors codes in a range.

Second, we’ve also made some usability enhancements:

Smart scroll, so that you don’t have to manually disable “stick to bottom” of logs. When you’re at the bottom of the logs, we’ll automatically stick to the bottom, but the second you scroll up it’ll stick again. If you want to restore this sticky behavior, simply click the arrow in the bottom right corner.

You can now select any external links present within your logs.
Selecting something in the terminal automatically copies that selection to the clipboard.

Third, we’ve added a new feature:

You can now clear a running container’s logs, making it easy to start fresh after you’ve made a change.

Take a tour of the functionality: https://drive.google.com/file/d/12TZjYwQgKcFrIaor1rMLkQxaUfR7KELA/view?usp=sharing
Adding Environment Variables on Image Run 
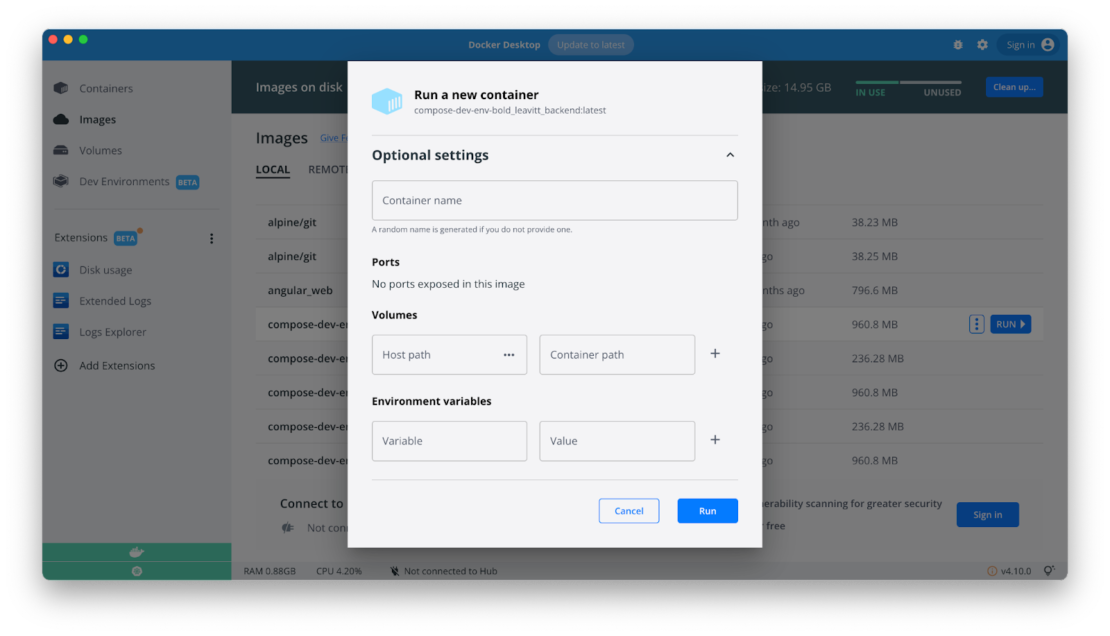
Previously you could easily add environment variables while starting a container from the CLI, but you’d quickly encounter roadblocks while starting your container afterwards from the Docker Dashboard. It wasn’t possible to add these variables while running an image. Now, when running a new container from an image, you can add environment variables that immediately take effect at runtime.

We’re also looking into adding some more features that let you quickly edit environment variables in running containers. Please share your feedback or other ideas on this roadmap item.
Containers Overview: bringing back ports, container name, and status
We want to give a big thanks to everyone who left feedback on the new Containers tab. It helped highlight where our changes missed the mark, and helped us quickly address them. In 4.10, we’ve:

Made container names and image names more legible, so you can quickly identify which container you need to manage
Brought back ports on the Overview page
Restored the “container status” icon so you can easily see which ones are running.

Easy Management with Bulk Container Actions
Many people loved the addition of bulk container deletion, which lets users delete everything at once. You can now simultaneously start, stop, pause, and resume multiple containers or apps you’re working on rather than going one by one. You can start your day and every app you need in a few clicks. You also have more flexibility while pausing and resuming — since you may want to pause all containers at once, while still keeping the Docker Engine running. This lets you tackle tasks in other parts of the Dashboard.

What’s up with the Homepage?
We’ve heard your feedback! When we first rolled out the new Homepage, we wanted to make it easier and faster to run your first container. Based on community feedback, we’re updating how we deliver that Homepage content. In this release, we’ve removed the Homepage so your default starting page is once again the Containers tab. 
But, don’t worry! While we rework this functionality, you can still access some of our most popular Docker Official Images while no containers are running. If you’d like to share any feedback, please leave it here.

New Extensions are Joining the Lineup
We’re happy to announce the addition of two new extensions to the Extensions Marketplace:

Ddosify – a simple, high performance, and open-source tool for load testing, written in Golang. Learn more about Ddosify here. 
Lacework Scanner – enables developers to leverage Lacework Inline Scanner directly within Docker Desktop. Learn more about Lacework here. 

Please help us keep improving
Your feedback and suggestions are essential to keeping us on the right track! You can upvote, comment, or submit new ideas via either our in-product links or our public roadmap. Check out our release notes to learn even more about Docker Desktop 4.10. 
Looking to become a new Docker Desktop user? Visit our Get Started page to jumpstart your development journey. 
Quelle: https://blog.docker.com/feed/

Amazon DocumentDB (mit MongoDB-Kompatibilität) ermöglicht die dynamische Größenanpassung für Speicherplatz

Der Ihrem Amazon DocumentDB-Cluster (mit MongoDB-Kompatibilität) zugewiesene Speicherplatz wird nun dynamisch verringert, wenn Sie Daten aus dem Cluster löschen. Amazon DocumentDB ist ein Datenbankservice, der speziell für die Verwaltung von JSON-Daten in großem Umfang entwickelt wurde, vollständig verwaltet und in AWS integriert ist und eine hohe Beständigkeit für Unternehmen bietet. Wenn Amazon DocumentDB-Daten entfernt wurden, z. B. durch das Löschen einer Sammlung, blieb der zugewiesene Gesamtspeicherplatz bisher unverändert. Der freie Speicherplatz wurde automatisch wiederverwendet, wenn das Datenvolumen in Zukunft zunahm.
Quelle: aws.amazon.com






