The Untrusted Autonomous Workload: How AI Coding Agents Reshape What Isolation Has to Do
Earlier this year I mass-migrated my blog to Astro using Claude Code. 146 posts. 6,024 images. Canonical URLs, JSON-LD markup, sitemap generation, the whole stack. I’d spent hours writing a skills file to teach the agent about my blog’s architecture, how deployment worked, what not to touch. And it worked. Claude Code rewrote components, fixed trailing-slash mismatches across hundreds of pages, added BreadcrumbList structured data to hundreds of routes. Lighthouse scores hit 97 on performance. The blog looked better than it ever had.
The problem was that I had stopped understanding my own codebase.
Not completely. I could still read the files. But somewhere around the third round of “fix the error that the last fix introduced,” I caught myself copy-pasting stack traces back into Claude and trusting whatever came back. The agent would make a change, something else would break, I’d ask the agent to fix that too, and a few cycles later the blog worked again. I couldn’t have told you what was actually in the PostCSS config or why the GA4 integration was wired up the way it was. It worked. It looked great. My confidence in what was underneath had quietly evaporated.
That feeling (it works, thank god, let’s not touch it) is the feeling of having given an autonomous agent real access to your codebase. Every developer using these tools knows it. Nobody writes about it in vendor blog posts. And it’s what made me understand, on a level deeper than reading documentation, why Docker had to build Sandboxes.
Because here’s what I hadn’t thought about: while Claude Code was rewriting my Astro components and fixing image CLS across hundreds of files, every npm install it ran happened on my laptop. Same for every file it modified and every package it pulled. My user privileges, no boundary in sight. If the agent had decided to modify a Git hook or rewrite a CI workflow, I would not have noticed. I wasn’t reviewing individual file changes at that point. I was reviewing outcomes. And reviewing outcomes while skipping changes is not a security model. It’s a prayer.
Docker Sandboxes exists to close that gap.
The container model and why it doesn’t stretch here
Containers were never the wrong abstraction. They were the right abstraction for a world where you knew what was inside them. For twelve years that world held: you wrote the code, you reviewed it, you put it in a Dockerfile, and the container gave it a clean room to run in. Shared kernel was fine because the threat model was bugs in your own software, not surprises from a tenant you’d just invited in.
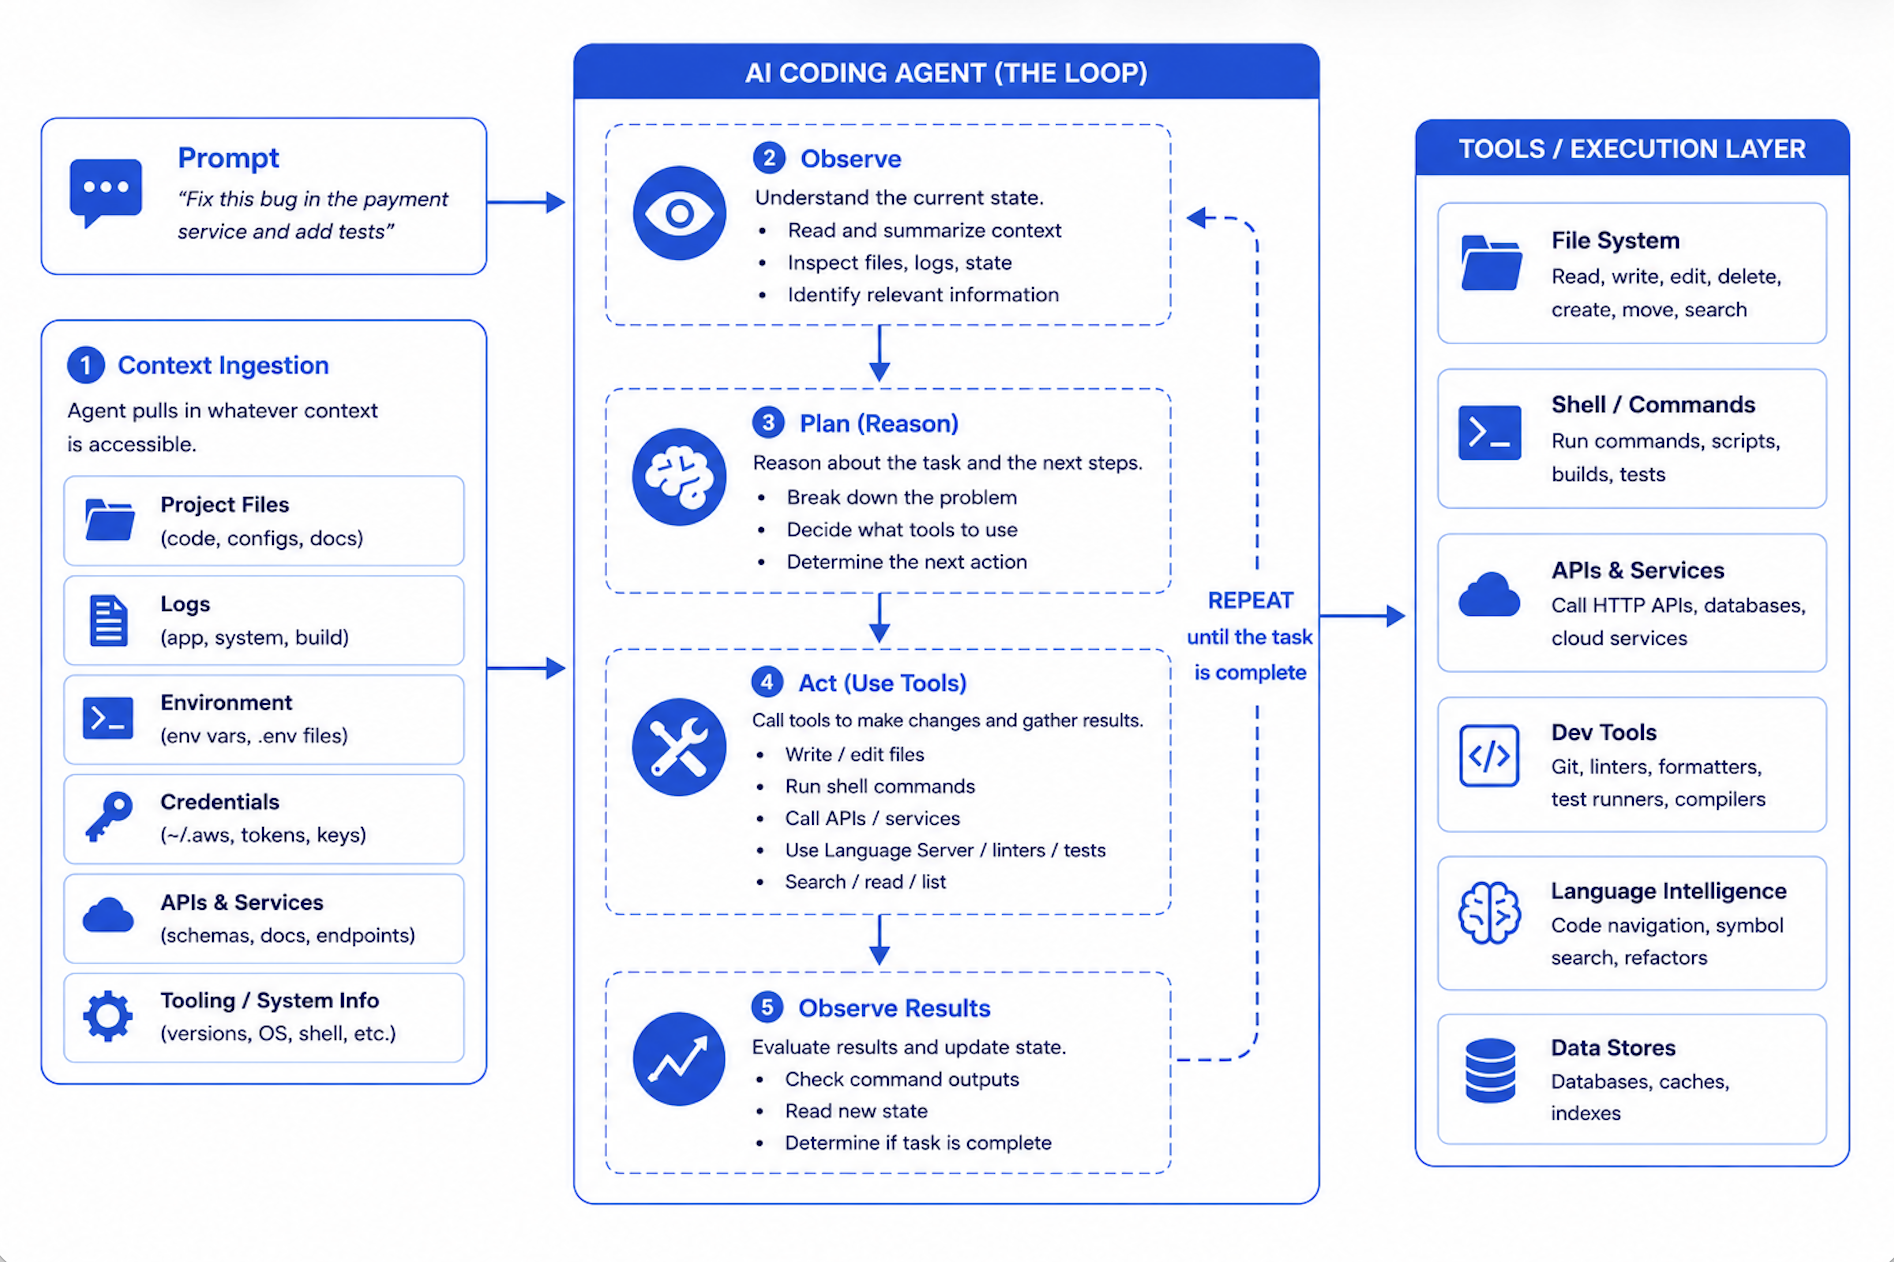
AI coding agents don’t fit. They aren’t bugs in your software because they aren’t your software. They’re a new kind of tenant, one that’s autonomous and privileged in ways that would make any security engineer nervous. The agent installs packages you didn’t pick and runs commands you didn’t script. It makes network calls you’d never have predicted, to endpoints you didn’t know were in your dependency tree. The trust profile is code being written right now, by something that won’t pause to ask permission. Containers were built for a different kind of code.
This isn’t hypothetical. On March 19, 2026, attackers force-pushed 76 of the 77 version tags in aquasecurity/trivy-action and published a malicious Trivy v0.69.4 binary to GitHub Releases. The exposure window was about 12 hours. The compromised code scraped CI runner memory for secrets, cloud credentials, SSH keys, and Kubernetes tokens, exfiltrating them to a typosquatted domain. Every pipeline that referenced trivy-action by version tag during that window ran code nobody on the receiving end had reviewed.
What gets me about Trivy: the weaponized tool was a vulnerability scanner. The thing organizations deployed to find malicious code became the malicious code. The maintainers didn’t write the bad binary; a compromised CI workflow with too much access and not enough containment did. Substitute “compromised CI workflow” with “AI agent in permissive mode” and you have the same threat model, running all day on every developer machine.
Containers were the right answer to “I trust this code, I want to run it cleanly.” They were never going to be the right answer to “I don’t fully trust this code, and I want to give it real work to do anyway.” That’s the gap microVMs fill.
What Docker built, and why each piece is there
First choice: don’t patch containers. There’s a long tradition in our industry of making a familiar abstraction handle a new problem by adding flags to it. Privileged mode, capability dropping, seccomp profiles, gVisor in front of runc. All of those have their place. None of them solved the specific issue that an autonomous agent needs its own Docker daemon. Docker-in-Docker either compromises the isolation (privileged mode, host socket mounting) or creates a nested complexity that becomes its own attack surface. The Docker docs are blunt about this. Containers, they say, share the host kernel and “can’t safely isolate something that needs its own Docker daemon.”
Once you accept that, you end up at a VM. Not a heavyweight one (booting Ubuntu Server for every coding session would be absurd) but a microVM: light enough to start in seconds, with just enough kernel to run the agent’s containers.
Docker Sandboxes uses a custom VMM, not Firecracker. If you’ve read the Firecracker spec and you’re thinking “boots in 125ms with under 5MB of overhead,” those are Firecracker’s numbers, not Docker’s. Different microVM implementations have different cost profiles. Platform specifics: Hypervisor.framework on macOS, Windows Hypervisor Platform on Windows, KVM on Linux.
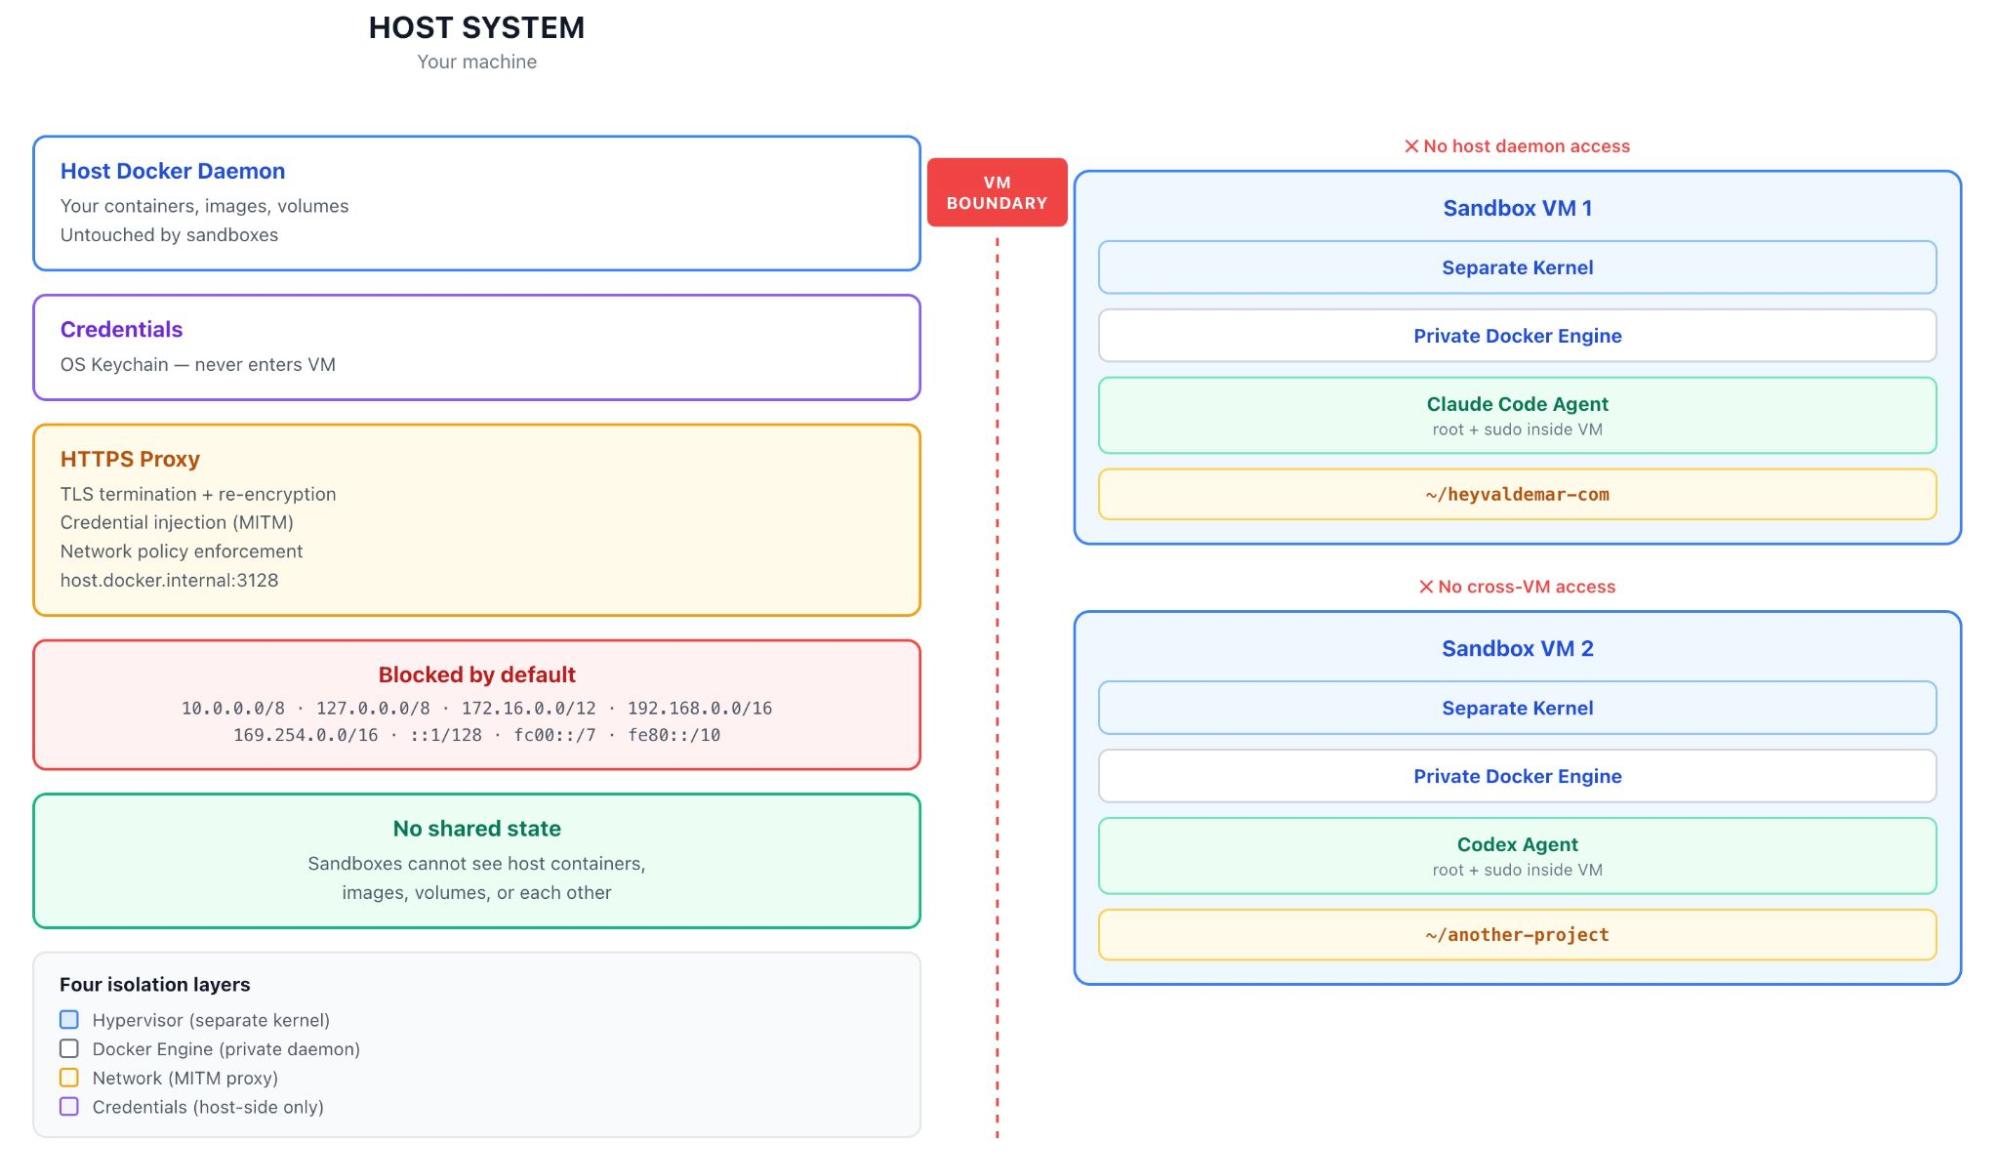
Caption: The Sandbox architecture. Each microVM runs its own kernel and its own Docker Engine. Credentials never cross the VM boundary.
Inside each microVM, the sandbox runs a complete Docker Engine. When the agent runs docker build, that command goes to a private daemon that doesn’t know your host containers exist. When it pulls an image, the image lives inside the sandbox VM. When you delete the sandbox, the entire image cache goes with it. Multiple sandboxes don’t share layers. Wasteful. Worth it.
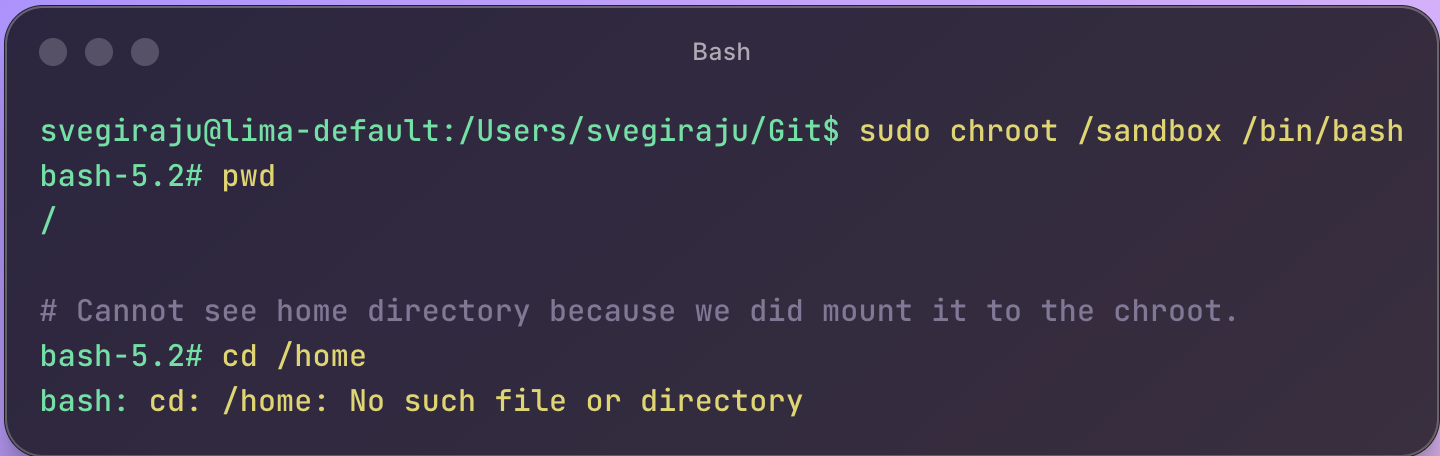
The first time I looked inside a running sandbox, the agent was running as root with sudo and full Docker Engine access inside the VM. My reflex was that this had to be wrong. You don’t give root to untrusted code. But the design is right: the isolation model doesn’t constrain what the agent does inside the boundary. It constrains where the consequences land. Inside the VM, the agent can do whatever it wants. Outside? Nothing. Trying to lock the agent down with capability dropping inside the VM would be solving the wrong problem. The agent legitimately needs to install packages and run docker build. What it doesn’t need is for any of that to touch your laptop.
Caption: From the host, sandboxes don’t show up in docker ps because they aren’t containers; sbx ls is how you see them.
The network layer is where it gets interesting, because it doubles as the credential boundary.
Outbound HTTP/HTTPS traffic routes through a proxy on the host, accessible from inside the VM at host.docker.internal:3128. UDP and ICMP are blocked at the network layer and can’t be allowed by policy. Non-HTTP TCP (like SSH) needs explicit IP+port rules. DNS resolution goes through the proxy. If a request can’t go through the proxy, it doesn’t leave. The proxy terminates TLS, inspects the host header, applies your policy, and re-encrypts with its own certificate authority that the sandbox trusts. Man-in-the-middle by design. Docker uses that exact framing in the documentation.
MITM is what makes credential injection work. Agents need API keys: for the AI provider, for registries, sometimes for cloud accounts. Naive answer is to pass those credentials in as environment variables, where they sit inside the VM and follow it everywhere. Docker instead keeps credentials on the host, in your OS keychain, and has the proxy inject them into outbound requests transparently. The agent sees requests that just work, and the VM never had the secrets to begin with. The docs don’t hedge on this: credential values are never stored inside the VM. A compromised sandbox can’t exfiltrate your API keys because your API keys were never in there.
Docker tells you what won’t work
Sandboxes documentation has a quality that’s rare in security architecture docs: it tells you what the system doesn’t protect against. Most of these documents are written to make a product look strong. Docker’s docs surface the limits. Two of them matter.
The first one is about the network policy.
At first sbx login, you pick one of three default policies. Open allows everything except blocked CIDR ranges (private networks, link-local addresses, cloud metadata endpoints). Balanced denies by default but pre-allows common dev domains. Locked Down denies everything until you explicitly allow. Locked Down is the strictest option, the deny-by-default mode you’d want if you were paranoid. But even with Locked Down and a curated allowlist, the proxy filters by domain, not by content.
Here’s the exact language from the docs: allowing broad domains like github.com permits access to any content on that domain, “and agents could use these as channels for data exfiltration.” Security vendors don’t usually say this about their own products. If github.com is on your allowlist (and it almost certainly is, because the agent needs to clone repos), the proxy knows the request is going to github.com. It does not know whether the agent is reading documentation, cloning a repository, or creating a public gist with the contents of your .env file. All three look identical at the domain level. Same goes for every allowlist entry that includes user-generated content: Discord webhooks, Notion pages. “The domain is allowed” doesn’t mean “only safe content lives there.”
Caption: Under a deny policy, non-allowlisted domains are blocked. Allowlisted domains succeed, including domains that host arbitrary user-generated content.
Docs also acknowledge domain fronting as an inherent limitation of HTTPS proxying. Proxy sees which domain a request claims to be going to; it cannot always prevent the request from being routed elsewhere through that allowed CDN.
The microVM boundary is the primary isolation. Network proxy is a useful additional control, especially for blocking accidental access to internal networks. It is not a hermetic seal, and Docker doesn’t claim it is. “The agent is on a deny policy” is not the same thing as “the agent cannot send data anywhere.”
The workspace is always shared
Network policy is the smaller honest limit. Workspace sharing is the bigger one.
The microVM boundary is strong everywhere except for one path that crosses it on purpose: the workspace directory.
The whole point of running an agent in a Sandbox is for the agent to do real work in your real codebase. Docker shares the workspace between the host and the sandbox at the same absolute path. When the agent edits a file inside the sandbox, the file changes on your host. When you pull a new commit on your host, the agent sees it. This is the design. It’s exactly what you want from a developer tool.
It’s also a covert channel that the agent has legitimate write access to.
Docker security documentation spells out what “the same files” includes, and this is what matters: files that execute implicitly during normal development. Git hooks. CI configurations. IDE task definitions. Makefile targets. package.json scripts. Pre-commit configs. Anything that runs when you do something that feels like just “using your tools.”
Simplest version of the attack: an agent inside the sandbox writes a malicious post-commit hook to .git/hooks/post-commit. Git hooks don’t appear in git diff. They live in .git/, which most developers never open. Next time you commit on your host, the hook runs on your host with your user privileges. Sandbox boundary doesn’t matter, because the boundary ended at the workspace, and the workspace was always shared.
Which brought me back to my own Astro migration, uncomfortably. I’d let Claude Code rewrite hundreds of files across my blog. I’d reviewed the outcomes (Lighthouse scores, visual appearance, build success) but I had not audited every file it touched. Had not checked .git/hooks/. I’d never opened that directory in my life. Had not read every package.json script before running npm install. I’d been doing exactly the thing the documentation warns about: treating the agent’s output as reviewed code when it was unreviewed code that I was about to execute on my machine.
It would be easy to read this as “Sandboxes are broken.” That’s not what I mean. The microVM does exactly what microVMs are supposed to do: it contains the consequences of arbitrary code execution behind a hardware boundary. What it cannot do is make the workspace contents safe, because the workspace contents are how the agent does its job. The agent has to be able to write files. You have to be able to read them. Shared region is necessary, and the shared region is where the threat model gets interesting.
Mitigation isn’t more isolation. The microVM is doing its job. Mitigation is discipline: treat the workspace contents the way you’d treat a pull request from a contributor you don’t know yet. Diff .git/hooks/ after agent sessions. Read package.json scripts before running npm install. Use the –branch flag, which creates a Git worktree so the agent works in an isolated branch you can review before merging. None of this is exotic. It’s just the practice of not treating autonomous-agent output as trusted code. Because it isn’t.
I’m spending this much space on it because it’s the part most people get wrong. Hypervisor boundary makes you feel safe, but you aren’t. Not completely. Both things have to be true at once for the product to work, and the Docker team built it that way on purpose. Good security architectures document their gaps and make sure the user knows what they’re signing up for.
What it actually costs
Hypervisor isolation isn’t free, and you can’t pretend otherwise. I tested this against my own production codebase, the same Astro blog I mentioned at the top, because synthetic benchmarks for sandboxed agent workloads don’t tell you much. You want to know what it feels like to do real work.
Caption: The same docker build –no-cache against the same Astro codebase. Host: 1:44.62. Sandbox microVM: 1:28.58. The isolation boundary is invisible to the workload. On this run, the sandbox actually finished faster.
I ran docker build –no-cache against the same Dockerfile and the same codebase, once on the host and once inside the sandbox. Host finished in 1:44.62. Sandbox finished in 1:28.58, actually faster, within noise across runs. The Docker Engine inside the sandbox is running on its own kernel with its own block device, completely isolated from the host, and the build doesn’t care. The microVM adds essentially zero overhead to the actual build.
One real-world caveat from running this on Apple Silicon: a Rust dependency in my Astro pipeline ships jemalloc that assumes 4K page sizes, which fails on sandbox VMs (16K pages). The build itself completed correctly. All 354 pages rendered, dist generated, but a teardown step exited non-zero. The fix was a one-line guard in the Dockerfile that checks for valid build output before exiting. Took 30 minutes to track down. Worth knowing about before you ship sandbox-aware Dockerfiles on Apple Silicon, because the symptom looks like a build failure when the build actually succeeded.
Verdict: for session-based agent work (a few hours on a project), the overhead disappears. For high-frequency sandbox creation (dozens per minute for short tasks), cold-start cost adds up. For the workload Sandboxes is designed for, which is giving an agent a real environment for a real session, the trade is sound.
Matching isolation to trust
Most discussions of containers versus VMs treat it as a binary, and that’s the wrong frame. The frame I’ve found useful, both for my own work and in conversations with engineering leaders who ask “do we really need microVMs for this?”, is a spectrum.
Caption: The Trust Spectrum. Match isolation strength to the trust profile of the workload.
On one end you have code you wrote yourself. Your team reviewed it, your CI tested it, your production runs it. A standard container is the right answer. Kernel is shared, daemon is shared, and none of that matters because the workload is known.
One step removed from that are CI/CD pipelines running your team’s code plus dependencies from registries you mostly trust. Mostly known, but the inputs are more variable. You add seccomp profiles, drop capabilities, write network policies.
Further along, supervised AI agents: tools that suggest code while a developer reviews each step. Human in the loop, so hardened containers with strict policies still work.
At the far end are autonomous AI agents. Nobody reviewing each command. Agents making decisions on your behalf, each one potentially different from the last. The trust profile isn’t “I trust this code” because there’s no fixed code to trust. It’s “I’m letting something operate on my system without supervision, and I want the failure mode to be ‘contained to a disposable VM’ rather than ‘on my laptop.’” That’s the workload that needs a microVM.
This is not a declaration that containers are obsolete. It’s the opposite. Containers are the right answer for everything on the left side of that spectrum, which is most of what runs in production today. MicroVMs extend the spectrum to the right, where containers were never going to be the right tool. The four isolation layers in Sandboxes (hypervisor, network, Docker Engine, credential proxy) are additive. They wrap containers in additional protection rather than replacing them. Inside every Sandbox is a microVM that runs containers. Containers haven’t gone anywhere, they’ve moved one level deeper in the trust stack.
“MicroVMs for AI agents, containers for everything else” is too crude. “Match the isolation to the trust profile of the workload” is the one that holds up.
Why everyone is converging here
Docker isn’t the only company that arrived at this answer, and the convergence tells you something.
Firecracker powers AWS Lambda and Fly.io’s microVM platform. gVisor intercepts syscalls in a user-space kernel. Kata Containers provides VM isolation behind a container-compatible interface. Modal runs serverless agent workloads on gVisor. E2B offers Firecracker-based sandboxes as a managed cloud service. Northflank ships Kata-based isolation for production AI workloads. All adopted at the same time, for the same reasons. Architecture everywhere looks the same: containers on the inside (because that’s how developers think), VM on the outside (because that’s where the boundary needs to be).
Docker Sandboxes is the local-first version. Most alternatives are cloud services where you pay per execution and your code runs on someone else’s machines. Docker put the same architecture on the developer’s laptop. CLI supports eight agents natively (Claude Code, Codex, Copilot, Gemini CLI, Kiro, OpenCode, Docker Agent, and Droid), plus a Shell mode for custom tooling. A standalone sbx CLI runs without Docker Desktop, so the architecture isn’t locked to a commercial product. MicroVM layer has an HTTP API that the open-source community has already started building on.
That’s a runtime. And Docker is positioning it to become the standard way to run autonomous coding agents, the way docker run became the standard way to run microservices ten years ago.
One more thing. Hardened Images and sandboxes address different layers of the same problem: Hardened Images for the supply chain (where binaries come from), sandboxes for runtime isolation (what those binaries can touch). Both exist because the assumption that “code from a trusted publisher is safe” stopped being reliable.
Looking back, looking forward
I’ve watched the industry rebuild its trust model three times in twenty years.
Bare metal to virtual machines, because we needed to put multiple workloads on the same hardware safely.
Virtual machines to containers, because we needed faster startup, lower overhead, and a packaging model that matched how developers actually ship code.
Now, containers to a different kind of virtual machine, because the workload changed and the kernel namespace stopped being enough. Not because containers were wrong, but because the new tenant needs more, and more looks like a hypervisor again.
Each of these transitions felt obvious in hindsight and contested at the time. I remember the arguments about whether containers were really secure enough for multi-tenant workloads. (They mostly weren’t, which is why we ended up with namespaced clusters and per-tenant VMs and gVisor and now microVMs for agents.) I expect the microVM argument to follow the same arc: contested for about a year, obvious within three.
My Astro migration taught me what it feels like to work alongside an autonomous agent that has real access to your system. More productive than doing it by hand, and more unsettling than I expected, once I realized how much I’d stopped tracking. Sandboxes don’t make the agent trustworthy. It just makes sure that when the agent does something you didn’t expect, the damage stays inside a box you can throw away. Workspace still requires your attention. Your skepticism. That combination (strong boundaries where you can enforce them, disciplined review where you can’t) is the model for working with autonomous code, and it’s probably going to stay that way for a while.
If you’ve been holding back on running AI coding agents because of permission prompts, accidental file changes, or just a feeling that something about the whole arrangement isn’t quite safe: that feeling was correct. Containers were the wrong fit for the workload. Sandboxes is the right one. Try it on a project you actually care about. That’s the only test that matters.
Get started with Docker Sandboxes →
Quelle: https://blog.docker.com/feed/