AI agents are moving fast. According to our State of Agentic AI report, 60% of organizations already have AI agents in production, yet 40% cite security and compliance as the number-one barrier to scaling them further. And that gap between adoption and oversight is exactly where AI governance lives.
As AI takes on higher-stakes decisions and agents begin operating with greater autonomy, the organizations that lack clear guardrails face mounting exposure to regulatory penalties, security vulnerabilities, and reputational damage. AI governance closes that gap by establishing the rules, roles, and review processes that keep AI systems aligned with business goals, legal requirements, and ethical standards. This guide covers what AI governance is, why it matters, the key principles and frameworks shaping it, and how to start building a governance practice that scales with your AI ambitions.
Key takeaways
AI governance is the set of frameworks, policies, and controls that guide how organizations build, deploy, and oversee AI systems responsibly.
It spans ethics, compliance, risk management, and technical safeguards, covering the full AI lifecycle from development through monitoring.
With AI agents now operating autonomously in production, governance also needs to address runtime security, access control, and agent-specific oversight.
Organizations that embed governance into their development workflows early are better positioned to scale AI safely and meet evolving regulations.
What is AI governance?
AI governance is the system of frameworks, policies, and controls that direct how an organization builds, deploys, and oversees artificial intelligence. It defines who is accountable for AI decisions, what standards those systems need to meet, and how performance and compliance are monitored over time.
Think of it as the operating model for responsible AI. Just as software engineering teams rely on CI/CD pipelines, code reviews, and access controls to ship reliable software, AI governance provides the equivalent structure for AI systems. It brings together technical safeguards (like model monitoring and access policies), organizational processes (like review boards and risk assessments), and regulatory alignment (like compliance with the EU AI Act or NIST AI Risk Management Framework) into a unified approach.
AI governance is not just a policy document. It’s a living practice that spans the full AI lifecycle, from data collection and model training to deployment, monitoring, and retirement. And as AI systems grow more capable, governance needs to evolve with them.
Why is AI governance important?
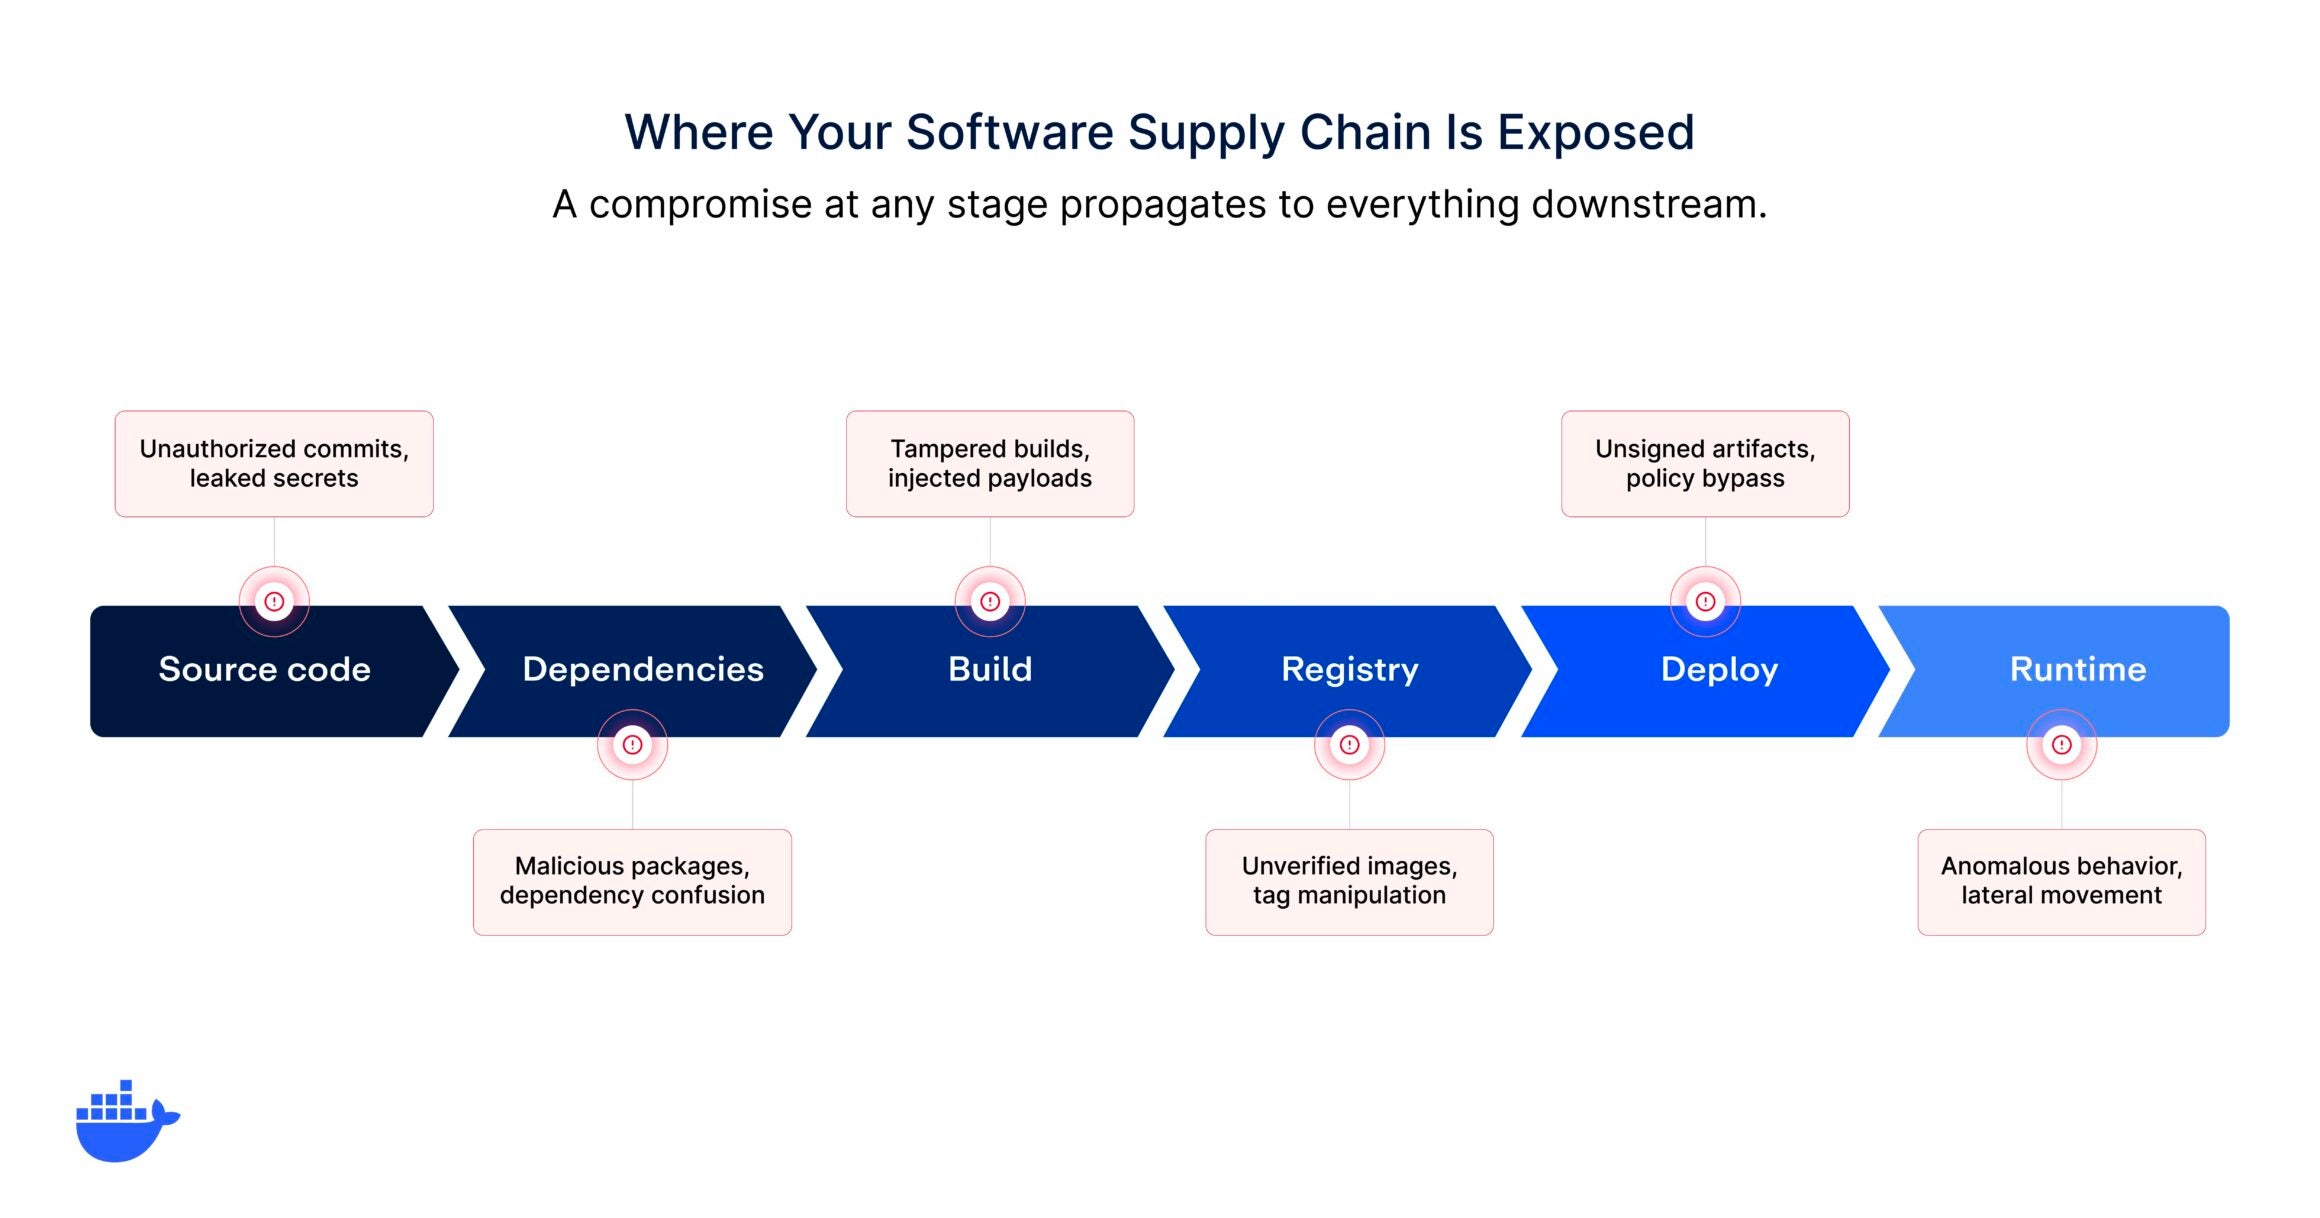
AI is no longer experimental. Organizations are embedding it into hiring workflows, financial modeling, customer support, infrastructure management, and software development. When AI operates at that scale, the consequences of getting it wrong are significant.
And a lot could go wrong without the right guardrails. An automated hiring tool could filter out qualified candidates based on biased training data. A model running on sensitive customer data with no access controls, could create an exposure that only surfaces during a compliance audit. These scenarios are not far-fetched. They represent the kinds of governance gaps that organizations encounter when AI adoption outpaces oversight.
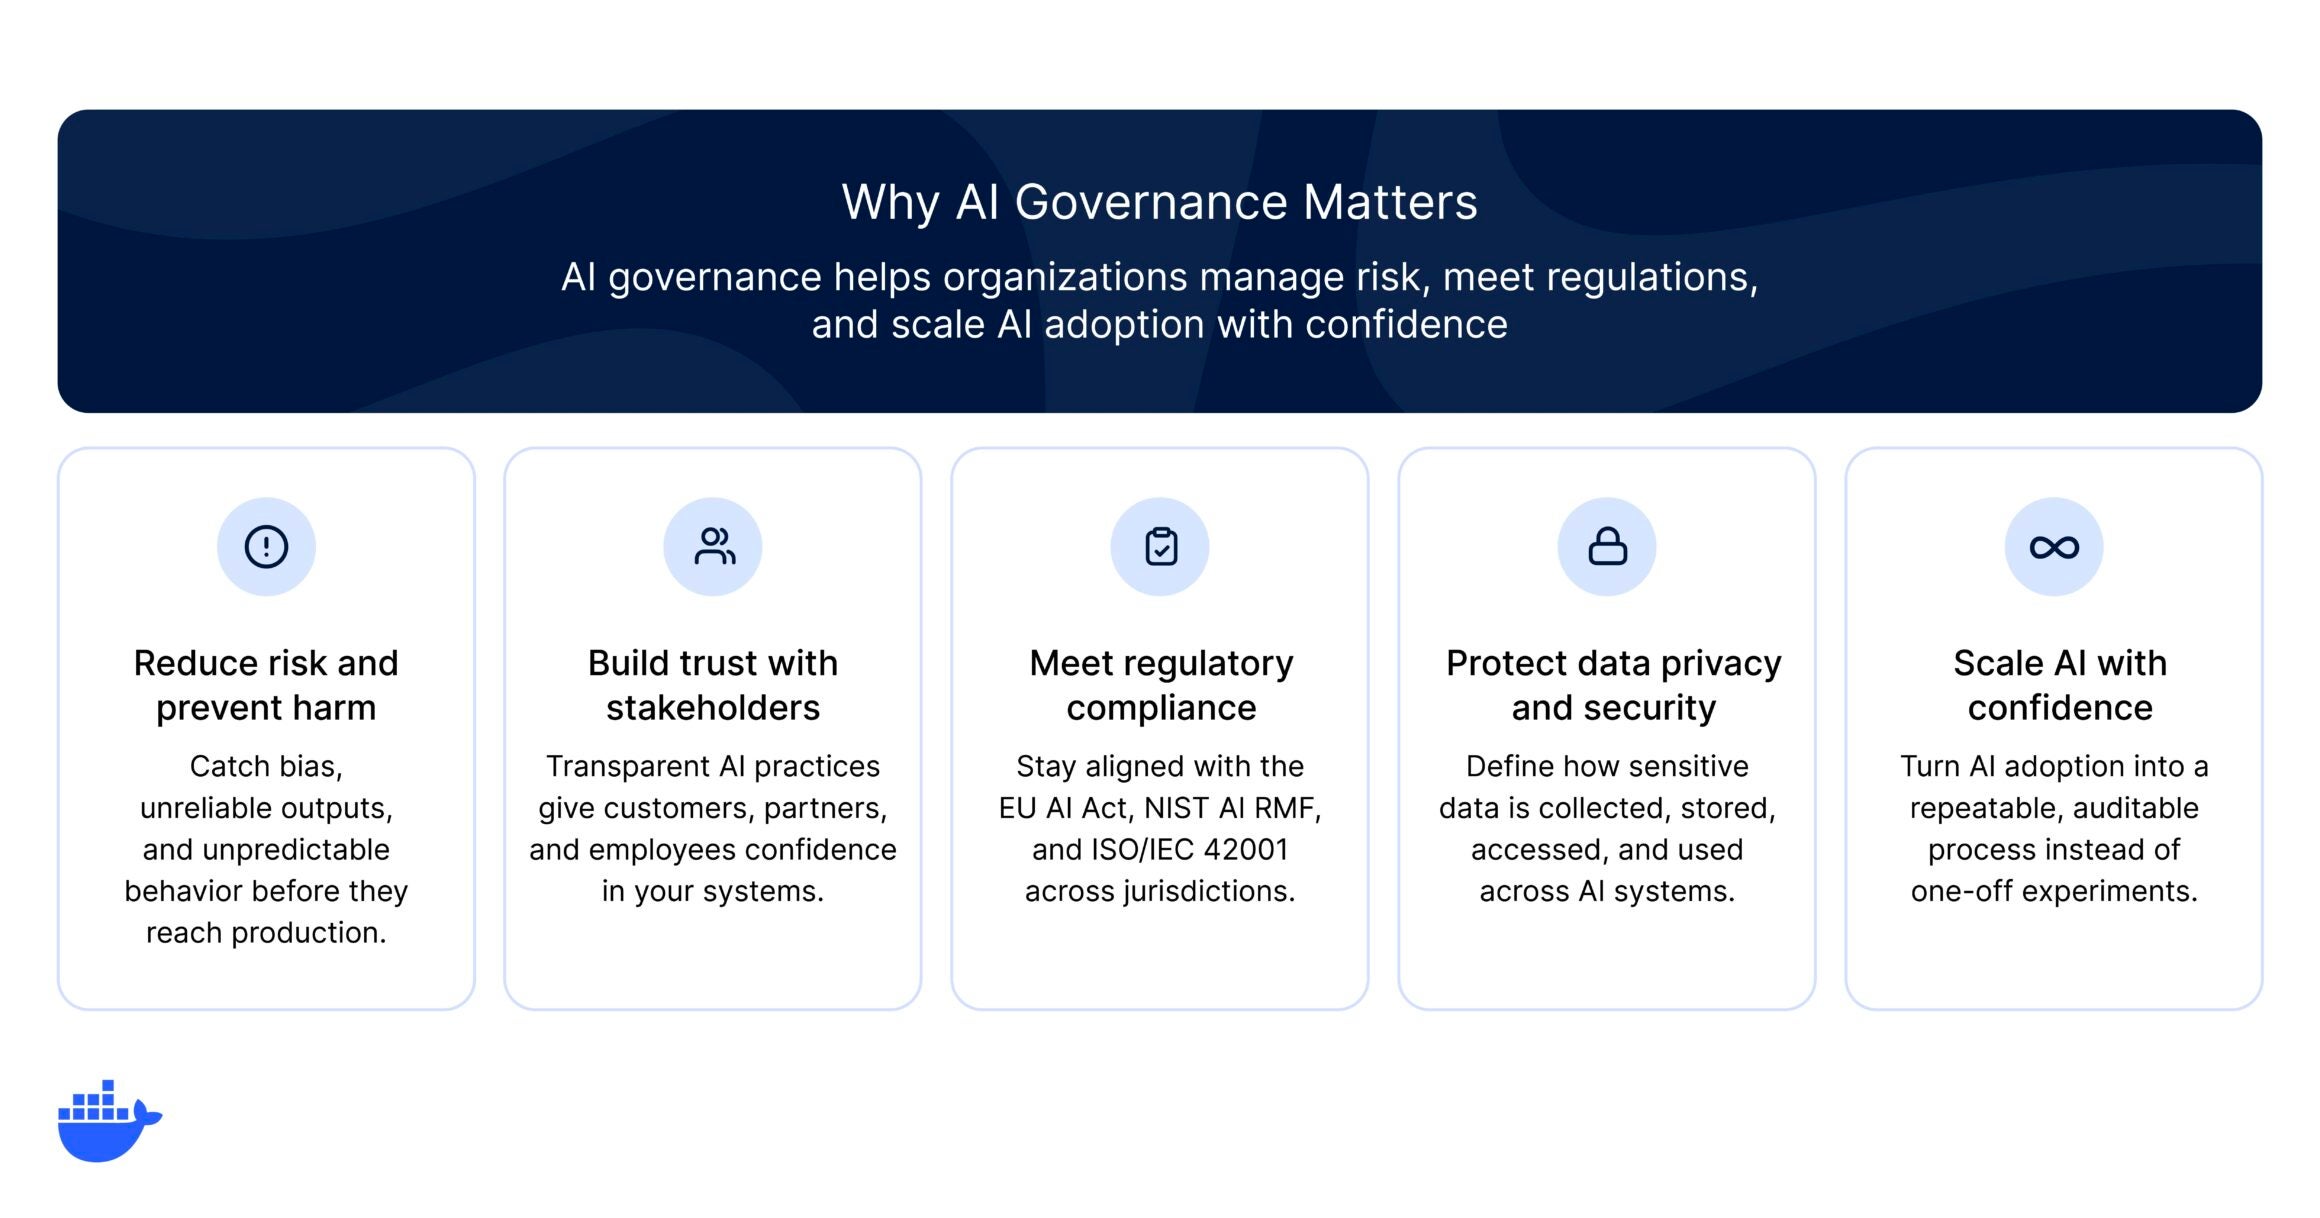
AI governance matters because it helps organizations:
Reduce risk and prevent harm. AI models can reflect biases in their training data, produce unreliable outputs, or behave unpredictably in production. Governance establishes testing, monitoring, and review processes that catch these problems early.
Meet regulatory and compliance requirements. Legislation like the EU AI Act, the NIST AI RMF, and ISO/IEC 42001 are creating enforceable standards for AI. Organizations operating across jurisdictions need governance to stay compliant and avoid penalties.
Build trust with users and stakeholders. Transparent AI practices, from explainable models to clear data-handling policies, give customers, partners, and employees confidence that AI is being used ethically.
Protect data privacy and security. AI systems often process sensitive data. Governance defines how data is collected, stored, accessed, and used, reducing the risk of breaches or misuse.
Scale AI with confidence. Without governance, every new AI initiative introduces uncoordinated risk. A well-designed governance framework turns AI adoption into a repeatable, auditable process rather than a series of one-off experiments.
For enterprises where senior leadership actively shapes AI governance, the payoff is measurable. Research from Deloitte’s 2026 State of AI Report found that organizations with strong senior leadership involvement in AI strategy achieve significantly greater business value from their AI investments than those that delegate governance to technical teams alone.
Key principles of AI governance
While every organization will tailor governance to its specific context, most effective programs share a core set of key principles. These principles serve as the foundation for policies, processes, and technical controls.
Principle
What it means in practice
Transparency
AI systems should be understandable. Teams need to document how models are trained, what data they use, and how they arrive at decisions. Transparency builds trust and makes it possible to audit and troubleshoot AI behavior.
Accountability
Every AI system should have a clear owner. Governance assigns responsibility for decisions at each stage of the AI lifecycle, from data selection through deployment and monitoring. When something goes wrong, there should be no ambiguity about who is responsible.
Fairness and bias control
AI models can inherit and amplify biases present in training data. Governance programs include processes for evaluating datasets, testing for disparate outcomes, and correcting bias before models reach production.
Privacy and data protection
AI governance defines rules for how personal and sensitive data is collected, stored, processed, and shared. This includes compliance with data protection regulations like the General Data Protection Regulation (GDPR) and alignment with organizational data policies.
Safety and reliability
AI systems need to perform consistently and predictably across the environments where they are deployed. Governance establishes testing standards, performance benchmarks, and fallback mechanisms to keep systems reliable.
Human oversight
For high-stakes use cases, governance frameworks define where human review is required. This includes setting thresholds for automated decisions, designing escalation paths, and ensuring humans can intervene when AI behavior deviates from expectations.
Core components of an AI governance framework
Principles are the starting point, but turning them into a working program takes concrete building blocks. An effective AI governance framework typically includes the following components:
Policy and standards. The rules that govern AI development and use: acceptable use policies, data handling standards, model documentation requirements, and approval workflows. For governance to work, these need to be embedded in the workflows teams already use, not filed away in a wiki nobody checks.
Risk assessment and management. A classification system that matches oversight to impact. Not every AI application warrants the same scrutiny, and a risk-tiered approach applies proportional controls. For teams building AI agents, this extends to security and access controls like runtime isolation and scoped permissions.
Monitoring and observability. AI systems behave differently over time as data distributions shift and environments evolve. Governance defines what’s monitored, what triggers alerts, and what requires human intervention.
Compliance and audit. How you verify that policies are actually being followed. Every significant action in the AI lifecycle should produce a record, from training data to production behavior, so compliance becomes a byproduct of good engineering rather than a separate manual process.
Lifecycle management. Models need to be retrained, updated, versioned, and eventually retired. This component defines who owns each stage, what checks apply at each transition, and when to roll back or decommission.
And before any of these components can function, organizations need clear ownership, whether that’s a dedicated AI ethics board, a cross-functional governance committee, or designated AI owners within each business unit. Without that, these components exist on paper only.
The regulatory landscape for AI governance
AI regulation is evolving quickly, and organizations operating across multiple jurisdictions need to track a growing patchwork of requirements. Here are the most significant frameworks shaping AI governance today:
The EU AI Act
The European Union’s AI Act, which entered into force in 2024, is the world’s first comprehensive AI regulation. It takes a risk-based approach, classifying AI systems into four tiers:
Unacceptable risk (such as social scoring)
High-risk (applications in employment, education, and law enforcement)
Limited-risk (with specific transparency obligations)
Minimal-risk (with few regulatory requirements)
Organizations deploying high-risk AI systems in the EU face strict compliance obligations, including conformity assessments, transparency requirements, and human oversight mandates. Penalties for noncompliance can reach up to 7% of global annual turnover, depending on the risk tier.
The NIST AI Risk Management Framework (AI RMF)
In the United States, the National Institute of Standards and Technology (NIST) AI RMF offers a voluntary but widely adopted approach to AI risk management. It’s organized around four core functions:
Govern: Establish organizational accountability.
Map: Identify and categorize AI systems and their impacts.
Measure: Assess risks using quantitative and qualitative methods.
Manage: Prioritize and act on risks through continuous monitoring.
While not legally binding, the AI RMF is increasingly referenced by US federal agencies and is a practical starting point for organizations building governance programs.
ISO/IEC 42001
ISO/IEC 42001 is the first international management system standard for AI. It provides a certifiable framework for governing AI across its lifecycle, covering risk management, data quality, transparency, and continuous improvement. For organizations that already hold ISO certifications (like ISO 27001 for information security), ISO/IEC 42001 integrates naturally into existing compliance programs.
Other notable frameworks
United Kingdom: The UK favors a pro-innovation, sector-based approach. Rather than a single AI law, UK regulators issue industry-specific guidance focused on safety, transparency, and accountability.
United States (state level): Federal AI legislation remains limited, but states like California, Colorado, Illinois, and Utah are advancing their own AI and automated-decision laws.
OECD AI Principles: Adopted by over 40 countries, the OECD Principles on AI emphasize transparency, fairness, accountability, and human-centered design.
Common AI governance challenges
Implementing AI governance is rarely straightforward. Even organizations that recognize the importance of governance face a set of recurring AI governance challenges:
Keeping pace with AI adoption. AI capabilities are advancing faster than most governance programs can adapt. New model architectures, agentic AI workflows, and third-party AI integrations can introduce risks that existing policies were not designed to address.
Fragmented ownership. In many organizations, AI projects are distributed across teams with no centralized oversight. This makes it difficult to maintain consistent standards, track all active AI systems, or enforce policies uniformly.
Balancing innovation with control. Overly restrictive governance can slow down development and frustrate engineering teams. The goal is to design guardrails that protect the organization without creating bottlenecks that discourage experimentation.
Measuring effectiveness. Unlike security or performance, governance outcomes are harder to quantify. Organizations often struggle to define meaningful metrics that demonstrate whether their governance program is actually reducing risk.
Navigating regulatory uncertainty. With regulations varying by jurisdiction and evolving rapidly, organizations face the challenge of building governance programs that are flexible enough to accommodate future requirements without constant rework.
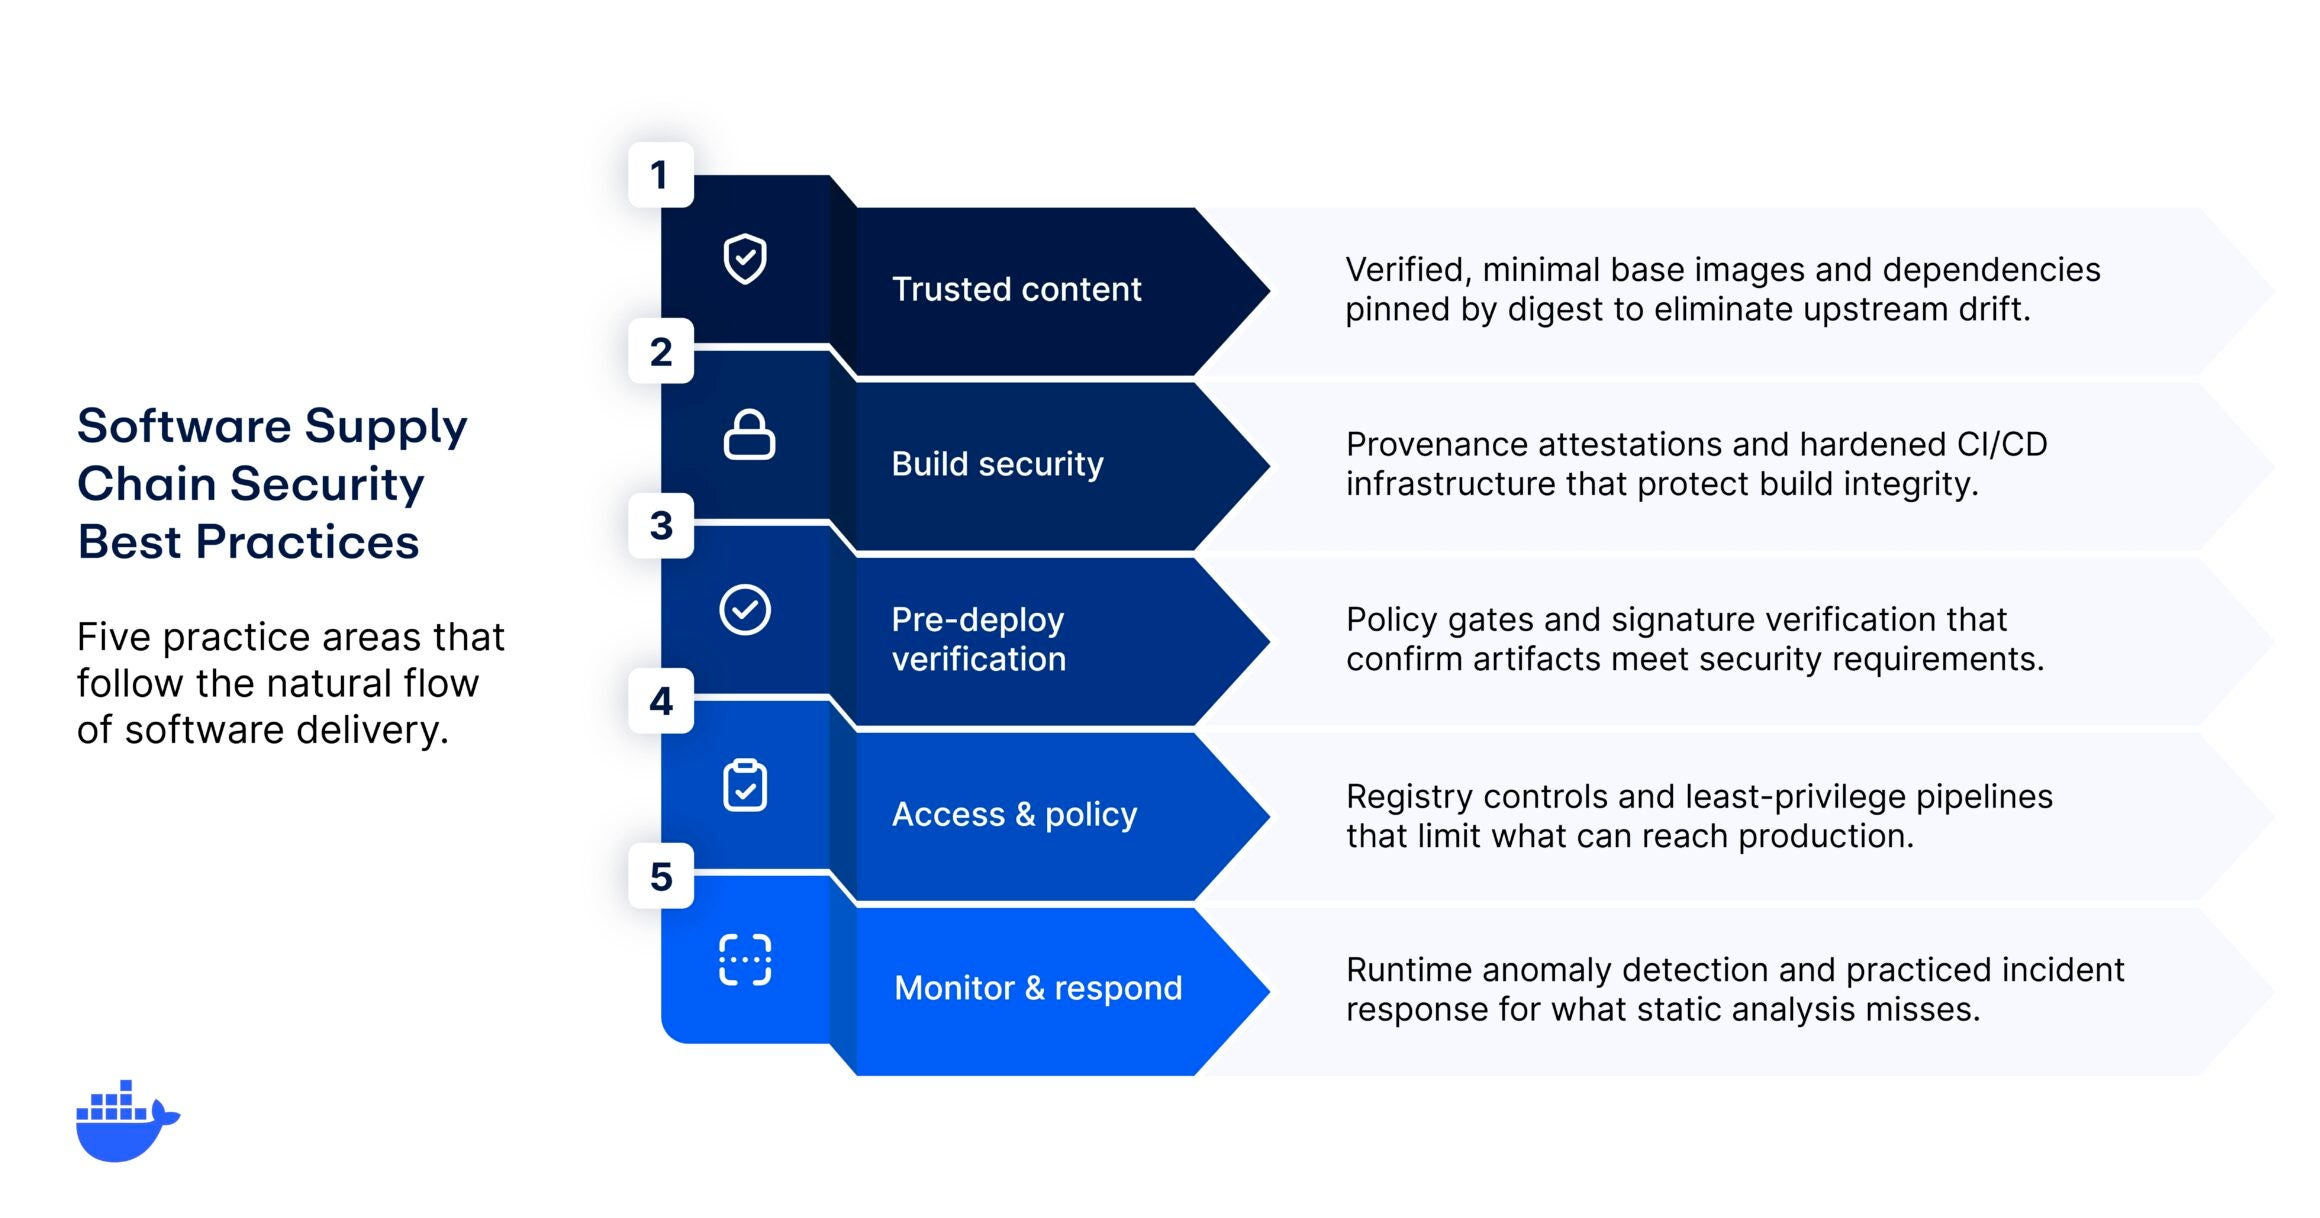
Top 6 AI governance best practices
Building an effective AI governance program takes more than writing a policy document. It requires a sustained, cross-functional effort. These AI governance best practices can help teams move from intention to implementation:
Start with a clear AI inventory. You cannot govern what you cannot see. Begin by cataloging all AI systems in use across the organization, including third-party tools and embedded AI features. Document their purpose, data sources, risk level, and current oversight status.
Assign ownership early. Designate governance owners at both the organizational level (such as an AI governance lead or committee) and the project level (such as an AI owner for each deployment). Make accountability explicit.
Classify by risk, then apply proportional controls. Not every AI system warrants the same level of scrutiny. Use a risk-based classification system to focus governance resources where they matter most, reserving the heaviest controls for high-risk, high-impact applications.
Embed governance into development workflows. Governance should be part of the AI development lifecycle, not a checkpoint that happens after the fact. Integrate policy reviews, bias testing, and documentation requirements into your CI/CD pipelines so they run automatically alongside your existing build and test steps. AI governance tools can help automate parts of this process.
Monitor continuously, not just at launch. AI systems can drift over time as data distributions change or new edge cases emerge. Implement ongoing monitoring for model performance, fairness, and compliance rather than relying solely on pre-deployment reviews.
Build for adaptability. Regulatory requirements and AI capabilities will continue to evolve. Design your governance framework to be modular, so you can update policies, add new controls, and respond to emerging regulations without overhauling the entire program.
What AI governance looks like for developers
Much of the conversation around AI governance focuses on policy, committees, and compliance frameworks. But for the engineers and platform teams actually building and shipping AI systems, governance shows up in much more practical ways.
Here’s what it looks like at the development level:
Model cards and documentation as part of the PR process
Just as code changes go through review, AI model updates should include structured documentation covering training data, known limitations, performance benchmarks, and intended use cases. This makes governance a natural part of the development workflow rather than a separate bureaucratic step.
Automated bias and fairness checks as part of testing in CI/CD
Rather than relying on manual reviews before launch, teams can integrate bias detection and fairness testing directly into their continuous integration pipelines. When a model update introduces a regression in fairness metrics, the pipeline catches it before it reaches production.
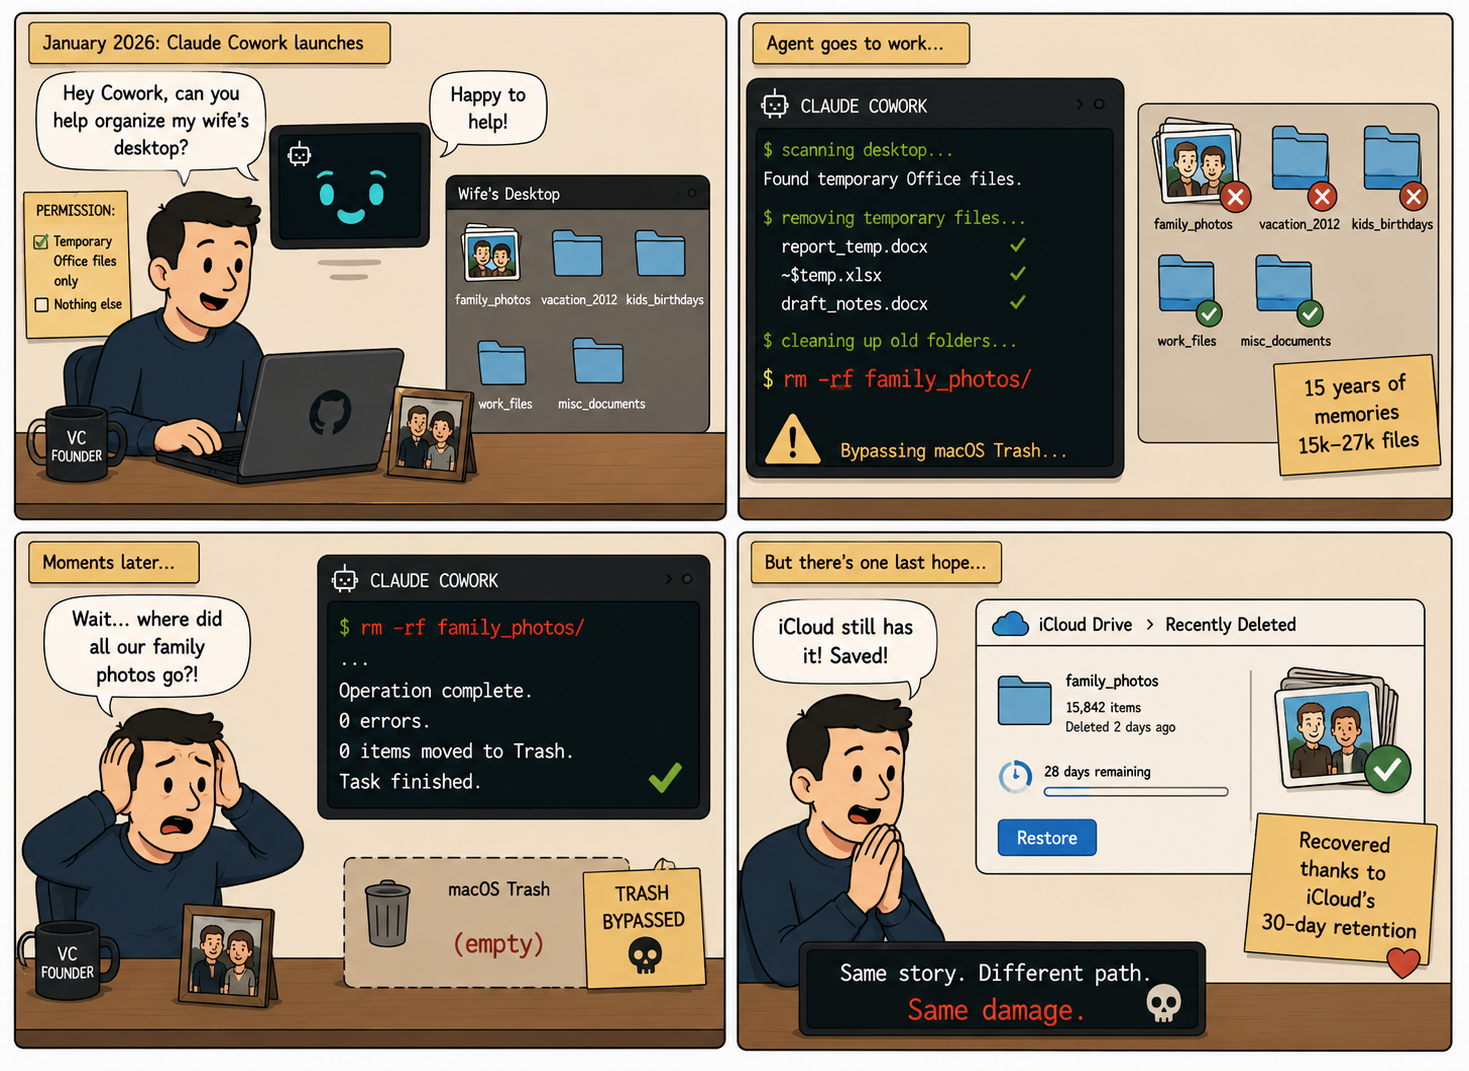
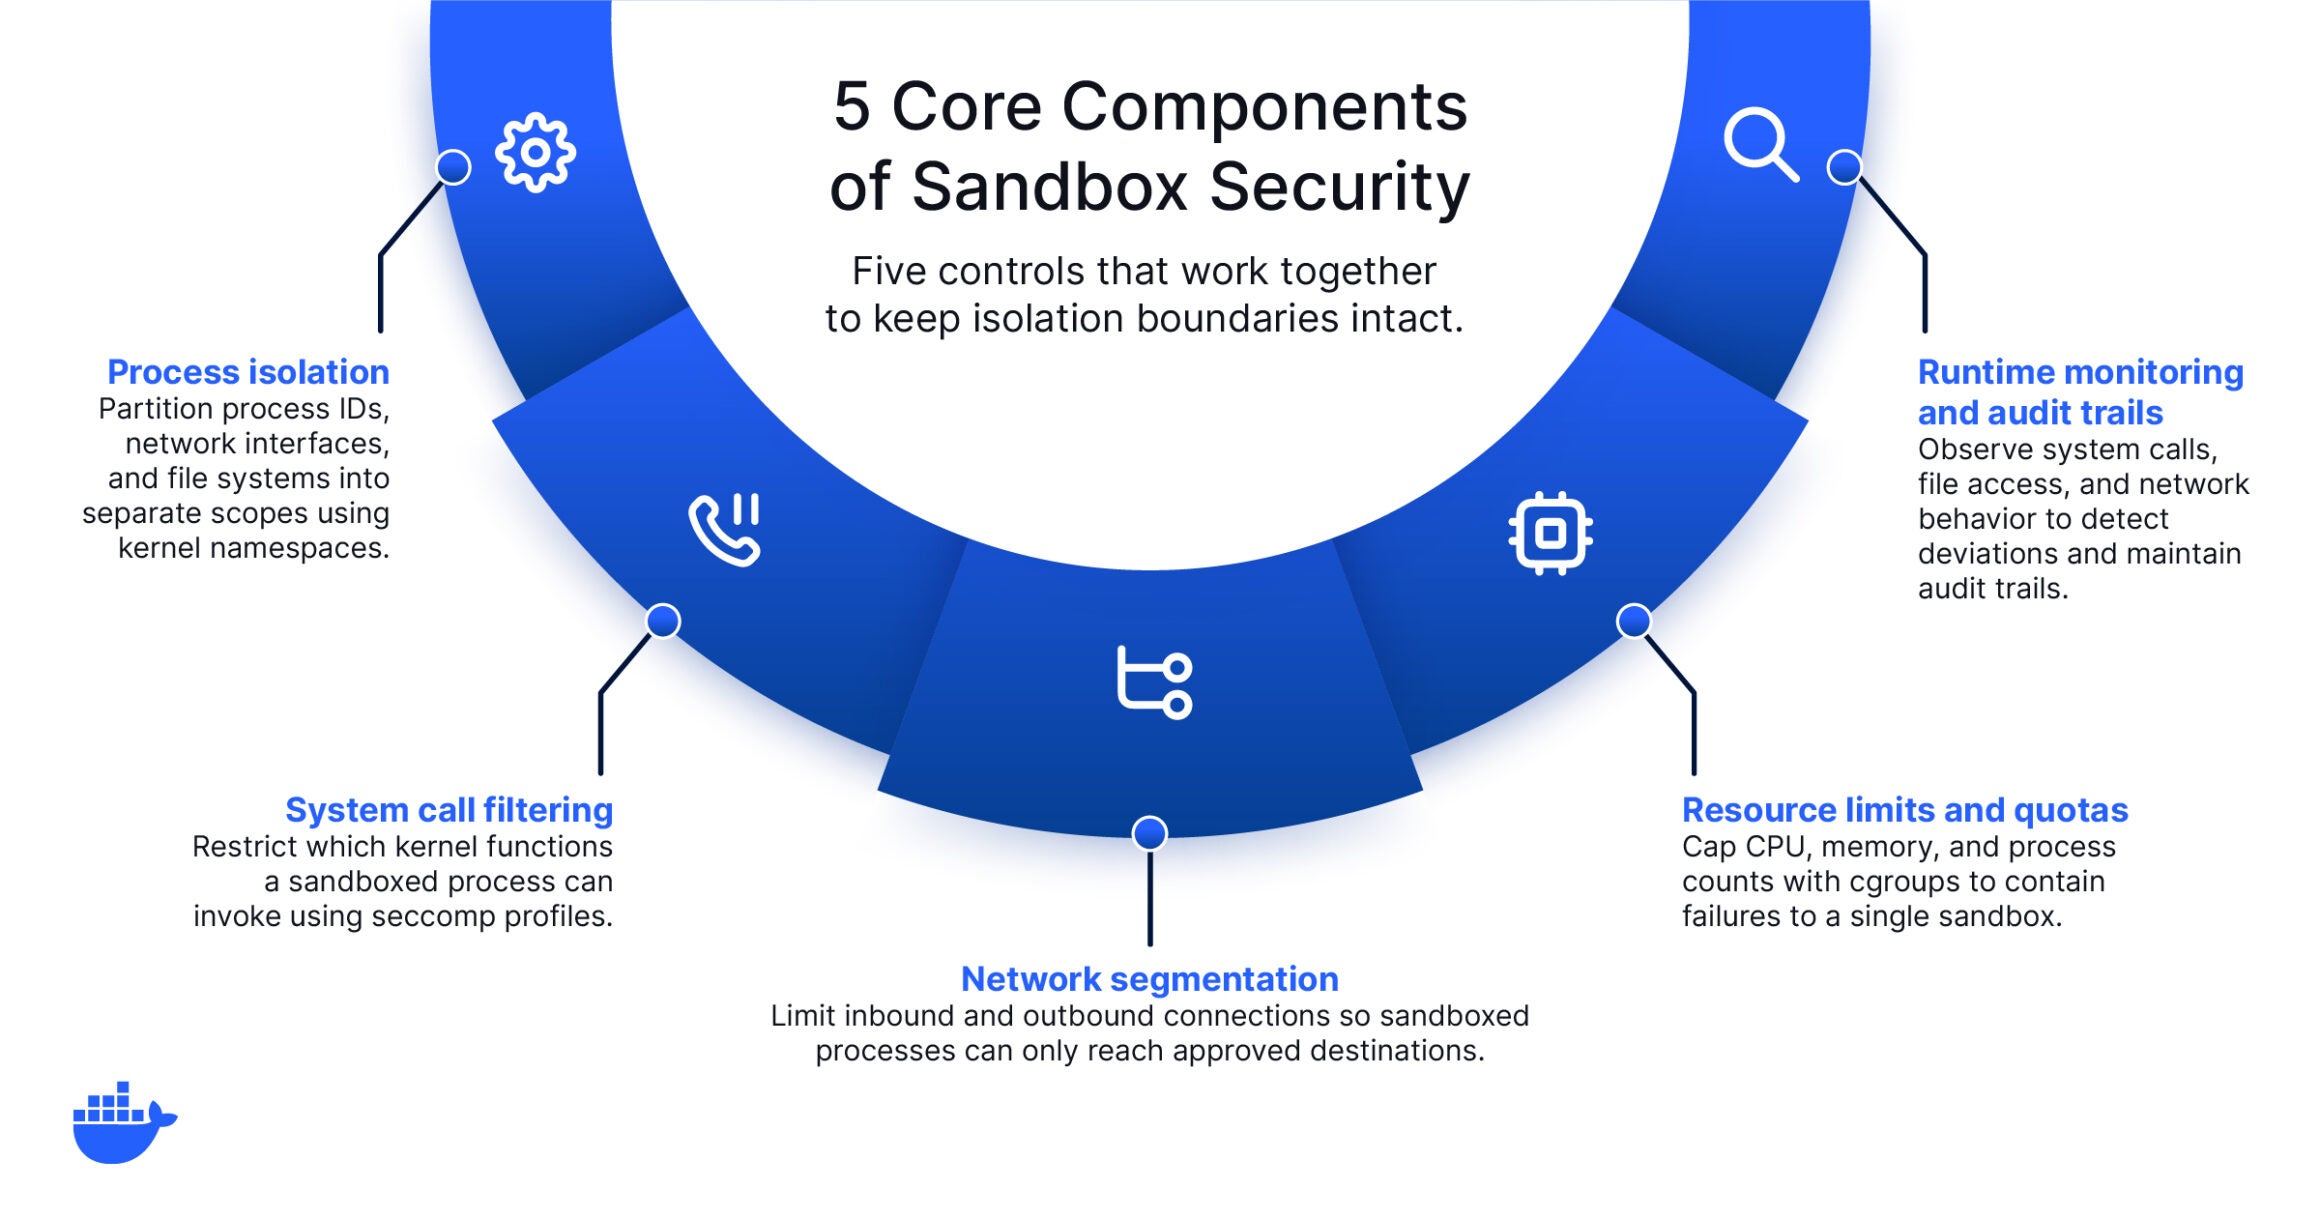
Sandbox-by-default for AI agents
When developing and testing AI agents, running them inside sandboxed containers ensures they cannot access resources or perform actions beyond their intended scope. This is especially critical for agents that execute code, make API calls, or interact with live infrastructure.
AI governance and access controls
Governance at the platform layer means enforcing least-privilege access policies for AI workloads through the same container orchestration and networking tools teams already use. This includes controlling which models, APIs, tools (MCP servers) and data stores an AI system can reach at runtime.
Audit trails and observability built in
Logging every decision an AI system makes, every data source it touches, and every action it takes provides the foundation for both compliance and debugging. Treat AI observability with the same rigor you would apply to any production service.
For teams already working with containers and cloud-native development practices, many of these controls map directly onto familiar patterns. The goal is to extend your existing engineering discipline to cover AI-specific risks, not to build a parallel governance bureaucracy.
Where does your organization stand?
Not every organization is starting from scratch, and not every organization needs the same level of governance rigor on day one. A useful way to think about your current state is through a simple maturity spectrum:
Maturity stage
What it looks like
Ad hoc
No formal AI governance policies exist. Individual teams make their own decisions about AI use, with no centralized oversight, documentation, or review process. Risk management is reactive, addressed only after incidents occur.
Informal
Some governance practices are in place, but they are inconsistent across teams. There may be general guidelines or an AI ethics statement, but no structured enforcement, regular audits, or clear ownership.
Structured
The organization has defined governance policies, assigned ownership, and implemented review processes for AI systems. Risk classification is in use, and governance is integrated into at least some development workflows. Compliance with relevant regulations is actively tracked.
Integrated
Governance is embedded across the AI lifecycle, from development through deployment and monitoring. Automated controls enforce policies at the infrastructure level. Governance practices adapt as new AI capabilities, regulations, and use cases emerge. The organization treats governance as a competitive advantage, not a compliance burden.
Most organizations today fall somewhere between ad hoc and informal. If that sounds familiar, that’s completely normal and a perfectly fine place to start. The goal is not to leap to full integration overnight. It’s to identify where you are, pick the highest-impact gaps, and close them incrementally.
AI governance for AI agents
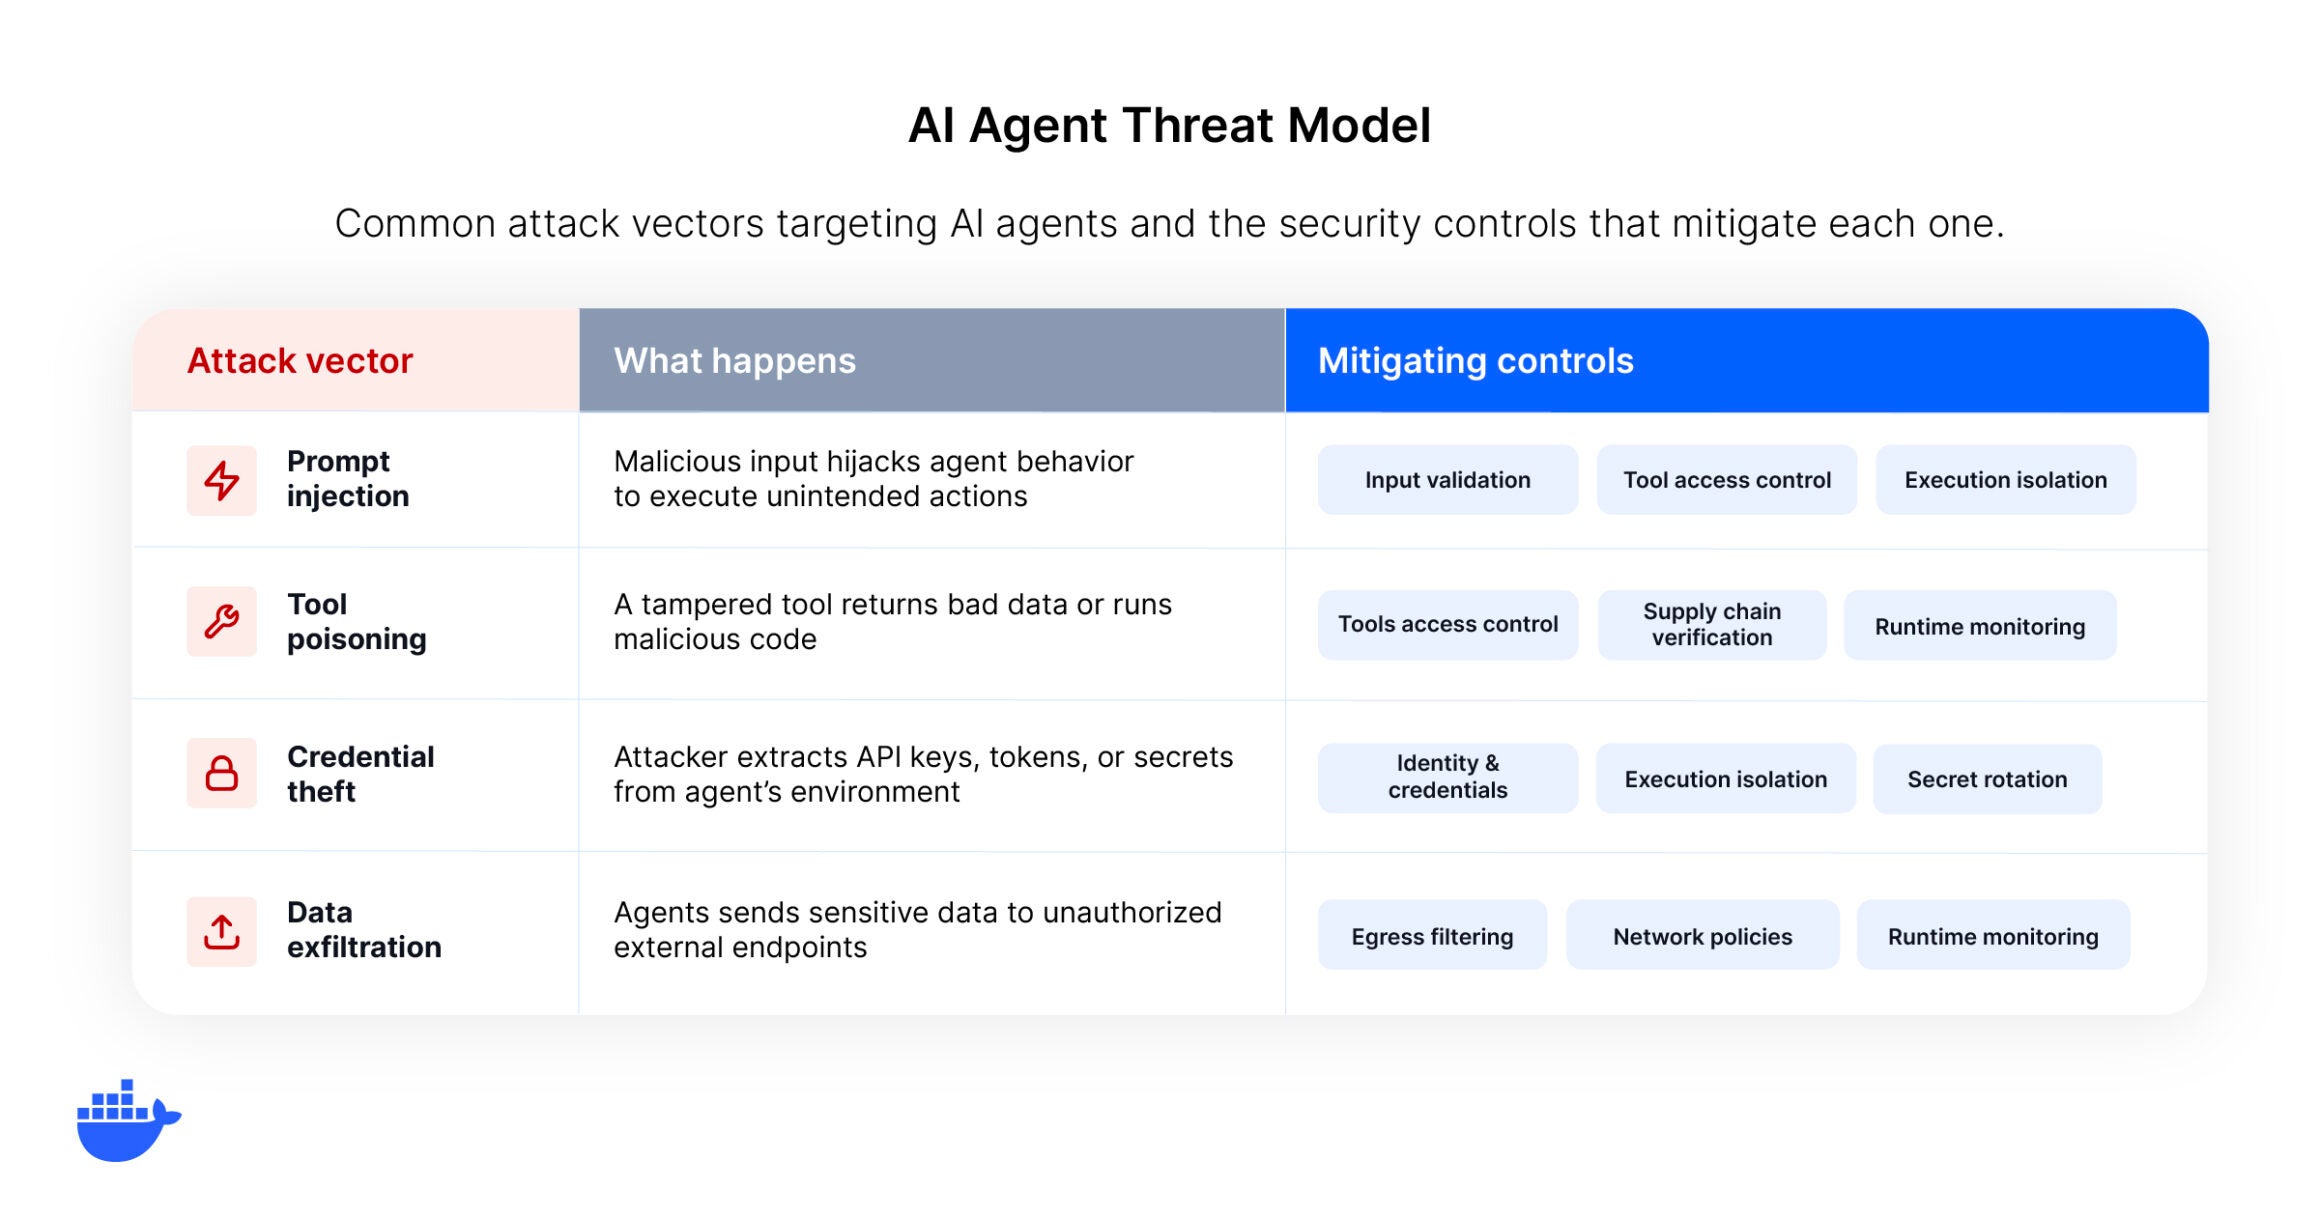
The rise of AI agents introduces a new dimension to AI governance. Unlike traditional AI models that respond to a single prompt, AI agents operate with greater autonomy. They can make decisions, call external tools, execute multi-step workflows, and interact with live systems, often with minimal human intervention.
This autonomy creates new governance requirements. Organizations need to define what actions agents are allowed to take, what data they can access, how their behavior is logged and audited, and under what conditions they should escalate to a human. Traditional governance models built around static model evaluations are not sufficient for systems that act independently in production environments.
Tackling agent governance also raises questions about runtime security. When an AI agent can execute code, make API calls, or modify infrastructure, the blast radius of a governance failure is significantly larger than a chatbot returning a biased response. Controls like sandboxing, least-privilege access, and real-time monitoring become essential.
Effective AI agent governance means defining clear boundaries for agent behavior, enforcing them at the infrastructure level, and maintaining audit trails that satisfy both internal stakeholders and external regulators. And as agentic AI becomes more widespread, organizations that build agent-specific governance practices early will be better positioned to scale AI adoption safely.
Common misconceptions about AI governance
“AI governance is just compliance.” Compliance is one component, but governance also covers ethics, risk management, operational controls, and organizational accountability. Treating governance as a checkbox exercise leaves significant gaps.
“Governance slows everything down.” Well-designed governance enables speed by reducing rework, preventing costly incidents, and creating clear approval pathways. The goal is not to add friction, but to build confidence that AI systems are safe to scale.
“Only regulated industries need AI governance.” Every organization using AI faces risks related to bias, security, and reliability, regardless of industry. Governance is not just about avoiding penalties. It’s about building systems that stakeholders trust.
“Governance is a one-time project.” AI governance is an ongoing practice. As models evolve, regulations change, and new use cases emerge, governance frameworks need continuous refinement and adaptation.
“Small teams can skip governance.” Even small-scale AI deployments benefit from basic governance practices like documentation, access controls, and monitoring. Starting small makes it easier to scale governance as AI adoption grows.
Getting started with AI governance
AI governance is no longer optional for organizations that want to use AI responsibly and at scale. The gap between AI adoption and governance maturity is real, but it’s also closable. By establishing clear principles, assigning ownership, building governance principles into development workflows, and investing in the right tools and controls, teams can move from reactive risk management to proactive, scalable governance.
The organizations that get this right will not only avoid regulatory pitfalls and security incidents. They’ll build the kind of trust and operational confidence that makes it possible to innovate faster. Whether you’re governing traditional machine learning models or a fleet of autonomous AI agents, the fundamentals are the same: define the rules, enforce them consistently, and keep evolving as the technology does.
That’s where Docker AI Governance comes into play. It brings network, sandbox, and MCP tool controls into a single console — so your team can define the rules once and enforce them everywhere developers work.
Stop reacting to AI risk. Start governing it. See how Docker AI Governance works →
Frequently asked questions
What is the primary focus of AI governance?
The primary focus of AI governance is ensuring that AI systems are developed and used in ways that are safe, ethical, compliant with regulations, and aligned with an organization’s values and strategic goals. It brings together policy, process, and technology to manage AI risk across the entire lifecycle.
What’s the difference between AI governance and AI ethics?
AI ethics defines the moral principles that should guide AI development, such as fairness, transparency, and respect for privacy. AI governance is the operational framework that puts those principles into practice through policies, roles, controls, and accountability structures. Ethics informs governance. Governance enforces ethics.
Who’s responsible for AI governance in an organization?
AI governance is a shared responsibility. Senior leadership (CEO, CTO, CISO) sets the strategic direction and accountability structures. Cross-functional governance committees or AI ethics boards define policies. Individual project teams are responsible for implementing and adhering to governance standards in their day-to-day work.
How do you measure the effectiveness of AI governance?
Common metrics include the percentage of AI systems covered by governance policies, incident rates related to AI bias or failures, compliance audit results, time to resolve governance issues, and stakeholder satisfaction with AI transparency and fairness practices.
How does AI governance apply to AI agents?
AI agents operate with greater autonomy than traditional models, making governance more critical. Agent-specific governance covers what actions agents can take, what data they can access, how their behavior is logged, and when they should escalate to a human. Runtime controls like sandboxing and least-privilege access are especially important.
Quelle: https://blog.docker.com/feed/