New to ML: Learning path on Vertex AI
At Google I/O this year, we announced Vertex AI: Google Cloud’s end-to-end ML platform. There’s a lot included here, as you can see from the diagram below. Figure 1. Vertex AI overviewIf you’re new to ML, or new to Vertex AI, this post will walk through a few example ML scenarios to help you understand when to use which tool, going from ML APIs all the way to custom models and MLOps for taking them into a production system. Our demo scenarioI moved recently, and as I was preparing boxes I started thinking about all the ways ML might streamline this process. What if I had an application that takes the measurements of a box and allows me to store the contents of each box virtually? Or have a service that automatically detects the type of room shown in an image and creates a digital inventory for me?Now imagine you are a data scientist at a moving company and the business team would like you to use machine learning to solve the following challenges:Recognizing items in pictures from customers’ homesClassifying items in two different categories based on some criteria (for example, location or fragility)Estimating box dimensions to save customer’s time during packagingFirst, you need to decide how to approach the problem. And then, which tool is right for you. Before we dive in, let’s discuss the ML tooling on Google Cloud we can use to solve this. Machine learning on Google CloudGoogle Cloud Platform provides several tools to support an entire machine learning workflow, across different model types and varying levels of ML expertise. When you start a machine learning project like the one we’re building, there are several factors to evaluate before choosing one of these tools as you can see in the diagram below.Figure 2. Choosing the right tool – DiagramFor instance, we have:Pre-trained APIs for access to machine learning models for common tasks like analyzing images, video and text via APIAutoML on Vertex AI for training, testing and deploying a machine learning model without codeCustom Model Tooling on Vertex AI for training, testing, optimizing and deploying models using a framework of your choice.These are the tools I’ll focus on today. And, at the end, I will show how MLOps fits in this process and allows you to create a reliable and reproducible machine learning pipeline that integrates all services needed to deploy your models. Before moving on, it is also important to say that, regardless of which approach you use, you can deploy your model to an endpoint and serve predictions to end users via SDK methods. And the following representation shows how Vertex AI fits into a typical application development workflow.Figure 3. Vertex AI and ApplicationWith that, we are now ready to solve our business challenge with Vertex AI. So let’s start! Pre-trained APIs for object classificationWhen applying the diagram in Figure 1 to our demo scenario, the first step is to determine whether we have enough images of common household objects to use for training. For this case, let’s assume we don’t yet have training data. This is where the Google Cloud Vision API comes in handy. Indeed, the Vision API can detect and extract multiple objects in an image using the Vision API’s Object Localization functionality. Also, Vision API can detect and extract information about entities in an image, across a broad group of categories (for example, a sofa could be classified as both furniture and living room item) and many others. Below you can see results of APIs with a kitchen’s cupboard.Figure 4. Pre-trained APIs for object classificationWith those capabilities, we can build an application that uses the extracted labels and create a virtual catalog of items and boxes the customer needs to package.Of course, APIs are not just for images. On Google Cloud, there are also ML APIs that give you access to pre-trained machine learning models for common tasks like analyzing video, audio, and text.In general, we suggest using pre-trained APIs whenyou don’t have enough data your prediction task is general enough to fit into the type of labels provided by the service. you want to combine the pre-trained APIs with AutoML (and custom) models. Then, it is just a matter of integrating these APIs into your own application with a REST API request.Now we are able to recognize some items from pictures of customers’ homes and classify them in several categories. But what if we would like to have a higher level of detail with a model which is able to recognize items in images collected in various conditions? Or define our own labels? For example, in our case, we could decide to classify items based on their fragility. So, assuming that you have image data, it’s worth experimenting with a custom classifier to see if it fits your needs. In particular, if you’ve never trained a deep learning model yourself, you might prefer a no-code approach rather than building a custom model from scratch. Time is another important factor in evaluating different tooling. For simplicity, let’s assume that in our scenario the business team wants to see results right away. In this case, we’ll use AutoML in Vertex AI to build an initial model. AutoML for custom-label image classification modelWith AutoML, you can train models in Vertex AI on image, video, text, and tabular datasets without writing code. Vertex AI finds the optimal model architecture by searching state-of-the-art machine learning models. In our image scenario, all we need to do is supply labeled examples of images you would like to classify, and the labels you want the ML systems to predict. Then, we can start the model training. Once it finishes, we can get access to detailed model evaluation metrics and feature attributions which are powered by Vertex Explainable AI. And if it is validated, you can deploy it using managed Vertex AI Prediction. Here’s what this would look like for our image dataset:Figure 5. Classifying a fragile item with AutoMLAs you can see, it seems that choosing AutoML was the right move. In the first example, I take a picture of coffee cups, it classifies them as fragile items with 92% of probability. But when I pass a picture of a stuffed animal, it is able to classify as a non-fragile item with no uncertainty. Just what we need!Figure 6. Classifying a non-fragile item with AutoMLNotice that, using images to solve this challenge requires strong assumptions such as geometric properties of items significantly affects item fragility. Consequently, we will face several corner cases. But, in the end, we would be able to manage by letting customers label them in the application. Again, as general criterias, consider using AutoML when: you don’t have specific requirements about your underlying model architectureyou want to develop a quick initial model to use as a baseline, which could end up being your production modelFinally the last task. We would build a model to estimate at least three dimensions of boxes (width x depth x height) moving jobs will require (the fourth would be the weight). There are several possible approaches for solving this challenge. One of them could approximate the package’s size using 3D Object Detection. Below you can see the ML Pipeline.Figure 7. Network architecture and post=processing for 3D object detection.Based on the Google Research paper, you can build a single-stage model where the backbone model has an encoder-decoder architecture, built upon MobileNetv2. Then you can employ a multi-task learning approach, jointly predicting an object’s shape with detection and regression. In particular, It is possible to obtain the 3D coordinates for the item’s bounding box using a pose estimation algorithm (EPnP). Then, given the 3D bounding box, you can easily compute the size (and the pose) of the object. I’m not going to cover the model in this article (because you need training data and, in that case, videos) but, as you can imagine, you will end up training a custom model, which you can do in Vertex AI. So, let me point out how. Custom model training on Vertex AIIn general, you get access to a series of services for custom model development in Vertex AI such as:Notebooks and Deep Learning VM Images with a preinstalled JupyterLab environment powered by most common deep learning frameworks and libraries and the best-in-class compute power (GPU, TPU)Vertex Experiments and Vertex Tensorboard, Vertex Training, Vertex Vizier to visualize model experiments, train your model in a managed and customizable fashion thanks to container technology and optimize hyperparameters for maximum predictive accuracy.Figure 8. Vertex Notebooks and Vertex Training UIsAs before, once you’ve trained your model, you can use managed Vertex AI Prediction to deploy it into production for online and batch serving scenarios when it is needed. Also, with Vertex AI Edge Manager, edge deployment is supported too. For example, suppose you need to deploy your model to customers who live in places with limited networks. With that service, you can serve and manage ML models on remote edge devices using Kubernetes. As a consequence, you will reduce response time and save bandwidth. Of course, wherever the case, you will track each model endpoint from a unified UI. So, you will be able to implement model maintenance like A/B tests or multi-armed bandits and, at the end, build a more solid backend logic compared to your moving app.We’ve covered many different products, so let’s do a recap. By now, you have models that are able to recognize items, classify them into categories and estimate box dimensions. And thanks to Vertex AI Endpoints, they are ready to be consumed by your end users. Are we missing something? Perhaps we are. Let me explain why. MLOps: Putting all together and make it replicableSo far, we focus on how you as a machine learning practitioner can use Vertex AI to build and deploy a model to solve a business challenge. But what happens when an entire team is working on the same project? How can you foster collaboration and guarantee reproducibility at the same time? Also, how can you automate tasks like training and deployment each time new training images are available?This is when MLOps comes into play. With MLOps, you can standardize your machine learning process and make it more reliable. And in Vertex AI you have all you need to embrace this productive paradigm. In fact, the platform provides a robust MLOps architecture using managed services such as Vertex Feature Store, Vertex Pipelines, Vertex ML Metadata and Vertex Model Monitoring.Figure 9. MLOps with Vertex AIWithout further ado, let’s conclude with how MLOps fits into our AutoML use case.One of my favorite enhancements of Vertex AI is the new python SDK. With it, you can get access to all Vertex AI services programmatically which means that you can express each task of your machine learning process via code and make it shareable and reproducible using a DevOps framework. In our case, you could decide to automate the entire process, from the creation of the dataset to the model deployment, with a pipeline. In particular, with Vertex Pipelines, you can break your process into components. Each component can produce its own artifact and have other metadata (input and output) associated with it. These elements (artifacts, lineage, and execution tracking) can be easily accessible from the Vertex console and you can analyze all of them with the Vertex Metadata service.Below the Vertex Pipelines I created for our AutoML modelFigure 10. Vertex Pipeline for AutoML Image ModelNotice that you can also implement conditional logic in Vertex Pipelines. For example, in our case, we could set a threshold such that, when the model starts underperforming on new data, we would run a training job, check the new accuracy, and decide whether to redeploy it. And, if this is the case, as a data scientist or machine learning engineer you would like to be alerted when model performance falls below a certain threshold. That’s why Vertex AI Model Monitoring was introduced. It automates alerts when events like data drift, concept drift, or other model performance issues happen. So whoever is in charge of model maintenance can act quickly and assess the incidents. SummaryWe have reached the end of this journey in the new Vertex AI platform. I started writing this article with a question in mind: how can I help ML practitioners and developers who approach the Vertex AI platform today? In order to answer the question, I went through a possible real life example where I imagined leveraging ML with a moving application. And I provided a quick overview of the ML toolbox in Vertex AI with some criterias about when to use which tool. You can find them summarized in the table below. Figure 11. Choosing the right tool – CriteriasIn the end, I also introduced you to MLOps and I showed how Vertex AI would help standardizing machine learning processes and putting them into production. If you want to know more about MLOps and the recommended capabilities based on your use cases, here is an article I recently collaborated on.At that point, you would get a better understanding of Vertex AI and how you can approach it. Then it’s your turn. While I’m thinking about the next blog post, check out our getting started guide and tutorials to start getting your hands dirty. And remember…Always have fun!Thanks to Sara Robinson for her support and all the other Googlers for great feedback on this post.Related ArticleGoogle Cloud unveils Vertex AI, one platform, every ML tool you needGoogle Cloud launches Vertex AI, a managed platform for experimentation, versioning and deploying ML models into production.Read Article
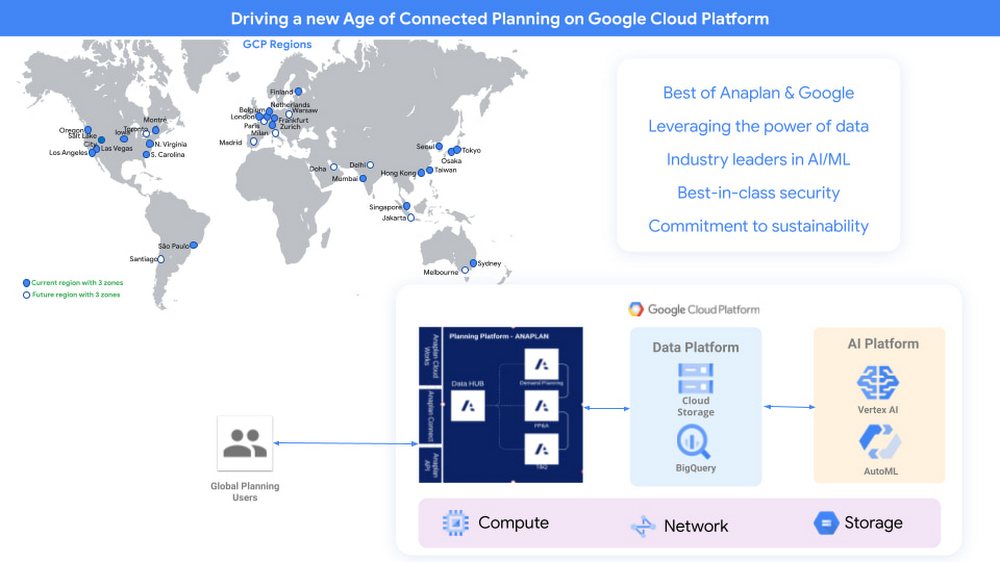
Quelle: Google Cloud Platform