How to run evolution strategies on Google Kubernetes Engine

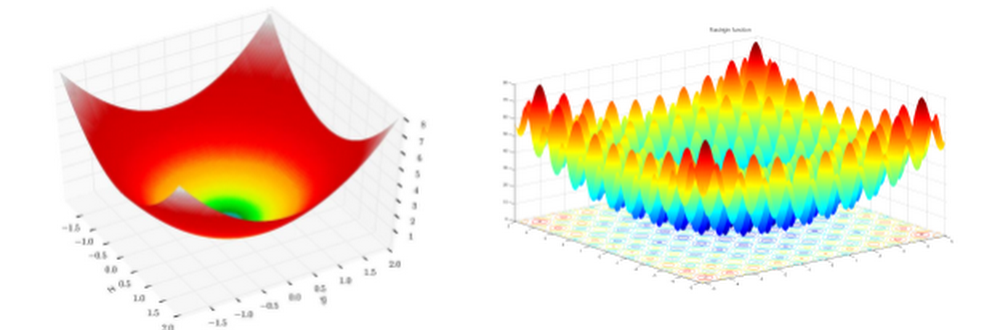
Reinforcement learning (RL) has become popular in the machine learning community as more and more people have seen its amazing performance in games, chess and robotics. In previous blog posts we’ve shown you how to run RL algorithms on AI Platform utilizing both Google’s powerful computing infrastructure and intelligently managed training service such as Bayesian hyperparameter optimization. In this blog, we introduce Evolution Strategies (ES) and show how to run ES algorithms on Google Kubernetes Engine (GKE).Evolution Strategies are an optimization technique based on ideas of evolution. Recently, ES has been shown (i.e. 1, 2) to be a good alternative for RL at tackling various challenging tasks. Specifically, two of the well known benefits of ES are bypassing noisy gradient estimate for policy optimization and its nature of encouraging distributed computing that brings faster convergence. While ES, first developed in the ‘60s, have the benefit of ease of scalability, only recently did open source projects (i.e. Salimans et al. 2007) in the research community demonstrate that scaling ES to a large number of machines can achieve results competitive to SOTA RL algorithms. As a result, an increasing number of  deep learning researchers have been exploring ways to incorporate evolution-based algorithms into recent research (i.e. 1, 2, 3, 4, 5).Evidence suggests that putting more effort into building better infrastructure to scale evolutionary computing algorithms will facilitate further progress in this area, however few researchers are experts in large scale systems development. Luckily, in the past few years, technologies such as Kubernetes have been developed to make it easier for non-specialist programmers to deploy distributed computing solutions. As a demonstration of how Kubernetes might be used to deploy scalable evolutionary algorithms, in this blog post, we explore the use of Kubernetes as a platform for easily scaling up ES. We provide the code and instructions here and hope all these serve as a quickstart for ML researchers to try out ES on GKE.For the record, AI Platform provides distributed training with containers which works with an ML framework that supports a distributed structure similar to that of TensorFlow’s. It is primarily for asynchronized model training, whereas distributed computing in ES is for a different purpose as you will see in the following section.Evolution Strategies 101ES is a class of black box optimization; it’s powerful for ML tasks where gradient based algorithms fail when the underlying task / function has no gradient, the complexity of computing gradient is high, the noise embedded in gradient estimation prevents learning, and other issues. As an illustration, imagine standing at a point on the terrain shown on the left in the following figure. Your task is to navigate your way to the lowest point of the terrain blindfolded. You are given some magic beads and they are the only way you interact with the environment.Figure 1. Sphere function (left) and Rastrigin function (right) (source: Wikipedia)Loosely speaking, with gradient based algorithms, at every decision-making step you drop some beads and let them roll for some time. The beads report their speeds and you walk a step along the direction most of the beads roll fast (because it’s steep there). Following this rule, you will probably reach the goal after a few iterations. Now try the same strategy on the right terrain in the figure. Chances are you will fail the mission and get stuck at the bottom of a valley surrounded by mountains.ES works very differently. Every optimization step consists of many trials; a decision is made based on the settings of those trials with great fitness. (Fitness is a metric that defines how good a trial is; it can be the altitude in our example, the lower the better. Analogous to the cumulative rewards of a trial in an RL environment.) This process, in which the trials with poor fitness are eliminated and only the fittest survives resembles evolution, hence the name.To give an example of how ES works in the previous context, instead of dropping the beads at each step, you launch the beads one by one with a pistol and let them spread the nearby region. Each bead reports its position and altitude upon landing, and you move to a point where the estimated altitude seems to be low. This strategy works on both terrains in the figure (suppose our pistol is very powerful and can shoot over high mountains) and it is easy to see that parallel executions of the trials can speed up the process (e.g., replace the pistol with a shotgun).The description in this section is meant to give you a very basic idea of what ES is and how it works. Interested readers are strongly recommended to refer to this series of blog posts that provides an excellent introduction and in-depth description.Kubernetes 101Kubernetes started at Google and was open-sourced in 2014. It is a platform for managing containerized workloads and services that facilitates both declarative configuration and automation. A thorough description of Kubernetes requires pages of documentation; in this section we will only scratch the surface and give an ES centred introduction of Kubernetes.From our previous discussion, it is easy to see the implementation of ES falls into a controller-worker architecture wherein at each iteration the controller commands the workers to do trials with given settings and perform optimization based on the workers’ feedback. With this implementation plan, let’s give some definitions and a description of how ES is conducted on Kubernetes in our earlier lowest point-finding example.You are not given a gun or beads this time; instead you have a cellphone and you can call someone to do the job of shooting the beads for you. You need to specify what you are expecting before requesting any service (in this example, bead-shooting). So you write your specification on the “Note to service provider”. You also prepared a “Note to myself” as a memo. Submitting the specification to a service provider, you started your exciting adventure.In this metaphor, the “What to do” sections on the service provider’s note is the worker’s program and the other is the controller’s program. Together with some runtime libraries, we package them as container images. The service provider is Kubernetes, and the specification it receives is called a workload, which consists of the container images and some system configurations such as resources. For example, the 10 cars in our example corresponds to 10 nodes / machines in a cluster; the 100 bead-shooters represents how many running containers (pods, in Kubernetes language) we wish to have, and Kubernetes is responsible for the availability of these pods. You probably don’t want to call each of these 100 bead-shooters to collect results. Plus, some bead-shooters may take sick leaves (E.g., failed containers due to machine reboot) and have delegated their jobs to other shooters (newly started containers) whose numbers you may not have. To cope with this, Kubernetes exposes a workload as a service that acts as a point of contact between the controller and the workers. The service is associated with the related pods; it always knows how to reach them and it provides load balance to the pods.With Kubernetes as a platform, we have high availability (Kubernetes makes sure the number of running pods match your expectations) and great scalability (Kubernetes allows adding / removing running pods at runtime). We think that’s what makes Kubernetes an ideal platform for ES. And GKE extends Kubernetes’s availability and scalability to node level which makes it an even better platform!ES on GKEIn this section, we describe our implementation of ES and instructions for running it on GKE. You can access the code and the instructions here.Our implementationAs is discussed in the previous sections, we adopt a controller-worker architecture in our implementation and we use gRPC as the interprocess communication method. Each worker is an independent server and the controller is the client. Remote procedure call (RPC) is not as efficient as other options such as message passing interface (MPI) in terms of data passing, but RPC’s user friendliness for data packaging and high fault tolerance makes it a better candidate in cloud computing. The following code snippet shows our message definitions. Each rollout corresponds to a trial and rollout_reward is the fitness reported from the rollout.The ES algorithms we provide as samples are Parameter-exploring Policy Gradients (PEPG) (based on estool) and Covariance Matrix Adaptation (CMA) (based on pycma). You can play with them in Google Brain’s Minitaur Locomotion and OpenAI’s BipedalWalkerHardcore-v2, a particularly difficult continuous-control RL environment to solve. You can also easily extend the code there to add your ES algorithms or change the configs to try the algorithms in your own environments. To be concrete, we defined an interface in algorithm.solver.Solver, as long as your implementation conforms to that interface, it should run with the rest of the code.Run ES on GKETo run our code on GKE, you need a cluster on Google Cloud Platform (GCP); follow the instructions here to create yours. We use the following command and configs to create our cluster; feel free to change these to suit your needs.When you have a cluster sitting there, running our sample ES code on GKE involves only three steps, each of which is a simple bash command:Build container images for the controller and the workers.Deploy the workers on the cluster.Deploy the controller on the cluster.Figure 2. Example of successful deployments in GCP console.That’s all! ES should be training in your specified environment on GKE now.We provide 3 ways for you to check your training progress:Stackdriver—In the GCP console, clicking the GKE Workloads page gives you detailed status report of your pods. Go to the details of the es-master-pod and you can find “Container logs” that will direct you to Stackdriver logging where you can see training and test rewards.HTTP Server—In our code, we start a simple HTTP server in the controller to make training logs easily accessible to you. You can access this by checking the endpoint in es-master-service located in the GKE Services page.Kubectl—Finally, you can use the kubectl command to fetch logs and models. The following commands serve as examples.Run ES locallyAs a debugging process, both training and test can be run locally.Use train_local.sh and test.py, and add proper options to do so.ExperimentsTo prove the benefits of running ES on GKE, we present two examples in this section: a 2D walker trained with CMA in OpenAI’s BipedalWalkerHardcore environment, and a quadruped robot in Google Brain’s MinitaurLocomotion environment. We consider the tasks solved if the agents can achieve an average of reward greater than TargetReward in 100 consecutive test trials; both tasks are challenging (try solving them with RL). The following table summarizes our experimental settings. We also ran experiments on a standalone Google Compute Engine instance with 64 cores for the purpose of comparison, the number of workers on this Compute Engine instance is tuned to make sure its CPU utilization is above 90%.Our implementation is able to solve both tasks and the results are presented below.Although the exact ratio is task dependent, ES can get significant speedup when run on GKE. In our examples, learning BipedalWalkerHardcore is 5 times faster and learning a quadruped robot is more than 10 times faster. To ML researchers, this speedup brings opportunities to try out more ideas and allows for faster iteration in ML algorithm development.ConclusionES is powerful for ML tasks where gradient based algorithms do not give satisfactory solutions. Given its nature of encouraging parallel computation, ML researchers and engineers can get significant speedup when ES is run on Kubernetes and this allows faster iteration for trying out new ideas.Due to the ease of scalability of ES, we believe the applications that can get the most benefit from  ES are those where cheap simulation environments exist for difficult problems. Recent works (i.e. 1, 2) demonstrate the effectiveness of training virtual robot controllers first in a simulation, before deploying the controller in the real world environment. Simulation environments, rather than having to be hand-programmed, can also be learned from collected observations and represented as a deep learning model (i.e. 1, 2, 3). These types of applications might leverage the scaling of ES to learn from thousands of parallel simulation environments.As evolutionary methods allow more flexibility in terms of what is being optimized, applications can span beyond traditional RL policy optimization. For instance, this recent work used ES in an RL environment to not only train a policy, but also learn a better design for the robot. We expect many more creative applications in the area of generative design using evolution. In this latest research work, the authors demonstrated the possibility of finding minimal neural network architectures that can perform several RL tasks without weight training using evolutionary algorithms. This result surprises a lot of ML researchers and points at a brand new research field wherein evolution plays the main role. Just as GPUs were the catalyst that enabled the training of large, deep neural networks leading to the deep learning revolution, we believe the ability to easily scale up evolutionary methods to large clusters of low-cost CPU workers will lead to the next computing revolution.To learn more about GKE and Kubernetes for deep learning, visit:Kubernetes EngineEnd-to-end Kubeflow on GCP
Quelle: Google Cloud Platform

Committed use discounts at a glance: New report shows your Compute Engine usage and commitments

Cloud adoption is fueled by the promise of increased flexibility, lower costs, and simplified pricing. At Google Cloud, we deliver on this promise with innovations like committed use discounts, which offer deep discounts of up to 57% off on-demand prices on VM usage in exchange for a one- or three-year commitment. Today, to help you analyze your Compute Engine resource footprint alongside your commitments, we are pleased to announce the Committed Use Discount Analysis report in beta. With this report, you can visualizeyour commitments from directly within theCloud Console to answer questions such as:  How much are my committed use discounts saving me on my bill?Am I fully utilizing my existing commitments?How much of my eligible usage is covered by commitments?Is there an opportunity to save more by increasing my commitments?Over the last two years, we’ve seen rapid adoption of committed use discounts, and recently expanded support to include local SSDs, GPUs, and Cloud TPU Pods based on customer feedback. Now, with the Committed Use Discount Analysis report, you get even greater transparency into your usage and cost savings so that you can maximize your discounts and minimize the time spent managing your commitments.Early adopters of the Committed Use Discount Analysis report are already seeing the benefits:”With this tool, we better understand our historical usage of eligible compute resources and how that compares to our commitment levels. Our commitment utilization and coverage is automatically calculated, enabling us to know when to purchase more commitments so that we can maximize our discounts. This gives us a higher level of confidence in purchasing commitments, allowing our teams to invest more in the innovations that drive Etsy’s vision.” – Dany Daya, Senior Program Manager, EtsyGoogle Cloud is dedicated to providing you with cost management tools that make it easier to manage and optimize your Google Cloud Platform (GCP) costs. With this new feature and Cloud Billing reports, you can gain greater visibility into your costs and the impact of your discounts at a glance. You can start using the new Committed Use Discount Analysis report in the Cloud Console today.Next stepsTo learn more about committed use discounts and Google Cloud cost management tools, check out the following:Documentation: Committed use discountsDocumentation: Analyze the effectiveness of your committed use discountsWebpage: Google Cloud cost management toolsVideos: Billing & cost managementFeedback: Contact us!
Quelle: Google Cloud Platform

3 cool Cloud Run features that developers love—and that you will too

Earlier this year, we announced Cloud Run, a managed serverless compute platform for stateless containers. Cloud Run abstracts away infrastructure management, and makes it easy to modernize apps. It allows you to easily run your containers either in your Google Kubernetes Engine (GKE) cluster with Cloud Run on GKE or fully managed with Cloud Run.Cloud Run has lots of great features and you can read the full list on the webpage. But in conversations with customers, three key features of the fully managed version of Cloud Run stand out:Pay for what you use pricingOnce above the always free usage limits, Cloud Run charges you only for the exact resources that you use.For a given container instance, you are only charged when:The container instance is starting, andAt least one request or event is being processed by the container instanceDuring that time, Cloud Run bills you only for the allocated CPU and memory, rounded up to the nearest 100 milliseconds. Cloud Run also charges for network egress and number of requests.As shared by Sebastien Morand, Team Lead Solution Architect at Veolia, and Cloud Run developer, this allows you to run any stateless container with a very granular pricing model:”Cloud Run removes the barriers of managed platforms by giving us the freedom to run our custom workloads at lower cost on a fast, scalable and fully managed infrastructure.”Read more about Cloud Run pricing here.Concurrency > 1Cloud Run automatically scales the number of container instances you need to handle all incoming requests or events. However, contrary to other Functions-as-a-Service (FaaS) solutions like Cloud Functions, these instances can receive more than one request or event at the same time.The maximum number of requests that can be processed simultaneously to a given container instance is called concurrency. By default, Cloud Run services have a maximum concurrency of 80.Using a concurrency higher than 1 has a few benefits:You get better performance by reducing the number of cold starts (requests or events that are waiting for a new container instance to be started)Optimized resource consumption, and thus lower costs: If your code often waits for network operations to return (like calling a third-party API), the allocated CPU and memory can be used to process other requests in the meantime.Read more about the concept of concurrency here.Secure event processing with Cloud Pub/Sub and Cloud IAMYour Cloud Run services can receive web requests, but also other kinds of events, like Cloud Pub/Sub messages. We’ve seen customers leverage Cloud Pub/Sub and Cloud Run to achieve the following:Transform data after receiving an event upon a file upload to a Cloud Storage bucketProcess their Stackdriver logs with Cloud Run by exporting them to Cloud Pub/SubPublish and process their own custom events from their Cloud Run services.The messages are pushed to your Cloud Run container instances via the HTTP protocol. And leveraging service accounts and Cloud IAM permissions, you can securely and privately push messages from Cloud Pub/Sub to Cloud Run without having to expose your Cloud Run service publicly. Only the Cloud Pub/Sub subscription that you have set up is able to invoke your service.You can achieve this with the following steps:Deploy a Cloud Run service to receive the messages (it listens for incoming HTTP requests, and returns a success response code when the message is processed)Create a Cloud Pub/Sub topicCreate a new service account and grant it the “Cloud Run Invoker” role on your Cloud Run serviceCreate a push subscription and give it the identity of the service account.Read more about using Cloud Pub/Sub push with Cloud Run here, and follow this tutorial for a step-by-step example.Run, don’t walk, to serverless containersThese are just a few of the neat things that developers appreciate about Cloud Run. To learn about all the other things to love about Cloud Run, check out these Cloud Run Quickstarts.
Quelle: Google Cloud Platform

Getting started with time-series trend predictions using GCP

Today’s financial world is complex, and the old technology used for constructing financial data pipelines isn’t keeping up. With multiple financial exchanges operating around the world and global user demand, these data pipelines have to be fast, reliable and scalable.Currently, using an econometric approach—applying models to financial data to forecast future trends—doesn’t work for real-time financial predictions. And data that’s old, inaccurate or from a single source doesn’t translate into dependable data for financial institutions to use. But building pipelines with Google Cloud Platform (GCP) can help solve some of these key challenges. In this post, we’ll describe how to build a pipeline to predict financial trends in microseconds. We’ll walk through how to set up and configure a pipeline for ingesting real-time, time-series data from various financial exchanges and how to design a suitable data model, which facilitates querying and graphing at scale.You’ll find a tutorial below on setting up and deploying the proposed architecture using GCP, particularly these products:Cloud Dataflow for a scalable data ingestion system that can handle late dataCloud Bigtable, our scalable, low-latency time series database that’s reached 40 million transactions per second on 3,500 nodes. Bonus: A scalable ML pipeline using TensorFlow eXtended, while not part of this tutorial, is a logical next step.The tutorial will explain how to establish a connection to multiple exchanges, subscribe to their trade feeds, and extract and transform these trades into a flexible format to be stored in Cloud Bigtable and be available to be graphed and analyzed.This will also set the foundation for ML online learning predictions at scale. You’ll see how to graph the trades, volume, and time delta from trade execution until it reaches our system (an indicator of how close to real time we can get the data). You can find more details on GitHub too.Before you get started, note that this tutorial uses billable components of GCP, including Cloud Dataflow, Compute Engine, Cloud Storage and Cloud Bigtable. Use the Pricing Calculator to generate a cost estimate based on your projected usage. However, you can try the tutorial for one hour at no charge in this Qwiklab tutorial environment.Getting started building a financial data pipelineFor this tutorial, we’ll use cryptocurrency real-time trade streams, since they are free and available 24/7 with minimum latency. We’ll use this framework that has all the data exchange streams definitions in one place, since every exchange has a different API to access data streams.Here’s a look at the real-time, multi-exchange observer that this tutorial will produce:First, we need to capture as much real-time trading data as possible for analysis. However, the large amount of currency and exchange data available requires a scalable system that can ingest and store such volume while keeping latency low. If the system can’t keep up, it won’t stay in sync with the exchange data stream. Here’s what the overall architecture looks like:The usual requirement for trading systems is low-latency data ingestion. To this, we add the need for near real-time data storage and querying at scale.How the architecture worksFor this tutorial, the source code is written in Java 8, Python 2.7, and JavaScript, and we use Maven and PIP for dependency/build management.There are five main framework units for this code:We’ll use XChange-stream framework to ingest real-time trading data with low latency from globally scattered data sources and exchanges, with the possibility to adopt data ingest worker pipeline location, and easily add more trading pairs and exchanges. This Java library provides a simple and consistent streaming API for interacting with cryptocurrency exchanges via WebSocket protocol. You can subscribe for live updates via reactive streams of RxJava library. This helps connect and configure some exchanges, including BitFinex, Poloniex, BitStamp, OKCoin, Gemini, HitBTC and Binance.For parallel processing, we’ll use Apache Beam for an unbounded streaming source code that works with multiple runners and can manage basic watermarking, checkpointing and record ID for data ingestion. Apache Beam is an open-source unified programming model to define and execute data processing pipelines, including ETL and batch and stream (continuous) processing. It supports Apache Apex, Apache Flink, Apache Gearpump, Apache Samza, Apache Spark, and Cloud Dataflow.To achieve strong consistency, linear scalability, and super low latency for querying the trading data, we’ll use Cloud Bigtable with Beam using the HBase API as the connector and writer to Cloud Bigtable. See how to create a row key and a mutation function prior to writing to Cloud Bigtable.For a real-time API endpoint , we’ll use a Flask web server at port:5000 plus a Cloud Bigtable client to query Cloud Bigtable and serve as an API endpoint. We’ll also use a JavaScript visualization with a Vis.JS Flask template to query the real-time API endpoint every 500ms. The Flask web server will run in the GCP VM instance.For easy and automated setup with project template for orchestration, we’ll use Terraform. Here’s an example of dynamic variable insertion from the Terraform template into the GCP compute instance.Define the pipelineFor every exchange and trading pair, create a different pipeline instance. This consists of three steps:UnboundedStreamingSource that contains ‘UnboundedStreamingSourceReader’Cloud Bigtable pre-writing mutation and key definitionCloud Bigtable write stepMake the Cloud Bigtable row key design decisionsIn this tutorial, our data transport object looks like this:We formulated the row key structure like this: TradingCurrency#Exchange#SystemTimestampEpoch#SystemNanosTime.So a row key might look like this: BTC/USD#Bitfinex#1546547940918#63187358085 with these definitions:BTC/USD: trading PairBitfinex : exchange1546547940918: Epoch timestamp63187358085: System nanotimeWe added nanotime at our key end to help avoid multiple versions per row for different trades. Two DoFn mutations might execute in the same Epoch millisecond time if there is a streaming sequence of TradeLoad DTOs, so adding nanotime at the end will split the millisecond to an additional one million.We also recommend hashing the volume-to-price ratio and attaching the hash at the end of the row key. Row cells will contain an exact schema replica of the exchange TradeLoad DTO (see the table above). This choice helps move from the specific (trading pair to exchange) to the general (timestamp to nanotime), avoiding hotspots when you query the data.Set up the environmentIf you are familiar with Terraform, it can save you a lot of time setting up the environment using Terraform instructions. Otherwise, keep reading.First, you should have a Google Cloud project associated with a billing account (if not, check out the getting started section). Log into the console, and activate a cloud console session.Next, create a VM with the following command:Note that we used the Compute Engine Service Account with Cloud API scope to make it easier to build up the environment.Wait for the VM to come up and SSH into it.Install the necessary tools like Java, Git, Maven, PIP, Python 2.7 and the Cloud Bigtable command line tool using the following command:Next, enable some APIs and create a Cloud Bigtable instance and bucket:In this scenario, we use a one-column family called “market” to simplify the Cloud Bigtable schema design (more on that here):Once that’s ready, clone the repository:Then build the pipeline:If everything worked, you should see this at the end and can start the pipeline:Ignore any illegal thread pool exceptions. After a few minutes, you’ll see the incoming trades in the Cloud Bigtable table:To observe the Cloud Dataflow pipeline, navigate to the Cloud Dataflow console page. Click on the pipeline and you’ll see the job status is “running”:Add a visualization to your dataTo run the Flask front-end server visualization to further explore the data, navigate to the front-end directory inside your VM and build the Python package.Open firewall port 5000 for visualization:Link the VM with the firewall rule:Then, navigate to the front-end directory:Find your external IP in the Google Cloud console and open it in your browser with port 5000 at the end, like this: http://external-ip:5000/streamYou should be able to see the visualization of aggregated BTC/USD pair on several exchanges (without the predictor part). Use your newfound skills to ingest and analyze financial data quickly!Clean up the tutorial environmentWe recommend cleaning up the project after finishing this tutorial to return to the original state and avoid unnecessary costs.You can clean up the pipeline by running the following command:Then empty and delete the bucket:Delete the Cloud Bigtable instance:Exit the VM and delete it from the console.Learn more about Cloud Bigtable schema design for time series data, Correlating thousands of financial time series streams in real time, and check out other Google Cloud tips.Special thanks to contributions from: Daniel De Leo, Morgante Pell, Yonni Chen and Stefan Nastic.Google does not endorse trading or other activity from this post and does not represent or warrant to the accuracy of the data.
Quelle: Google Cloud Platform

3 steps to gain business value from AI

Many customers have asked us this profound question: How do we realize business value from artificial intelligence (AI) initiatives after a proof of concept (POC)?  Enterprises are excited at the potential of AI, and some even create a POC as a first step. However, some are stymied by lack of clarity on the business value or return on investment. As a result we have heard the same question from data science teams that have created machine learning (ML) models that are under-utilized by their organizations.  At Google Cloud, we’re committed to helping organizations of all sizes to transform themselves with AI. We have worked with many of our customers to help them derive value from their AI investments.  AI is a team sport that requires strong collaboration between business analysts, data engineers, data scientists and machine learning engineers. As a result, we recommend discussing the following three steps with your team to realize the most business value from your AI projects:Step 1: Align AI projects with business priorities and find a good sponsor.Step 2: Plan for explainable ML in models, dashboards and displays.Step 3: Broaden expertise within the organization on data analytics and data engineering.Step 1: Align AI projects with business priorities and find a good sponsorThe first step to realizing value from AI is to identify the right business problem and a sponsor committed to using AI to solve that problem. Teams often get excited by the prospect of applying AI to a problem without deeply thinking about how that problem contributes to overall business value. For example, using AI to better classify objects might be less valuable to the bottom line, than, say, a great chatbot. Yet many businesses don’t start with the critical step of aligning the AI project with the business challenges that matter most.  Identify the right business problem. To ensure alignment, start with your organization’s business strategy and key priorities. Identify the business priorities that can gain the most from AI. The person doing this assessment needs to have a good understanding of the most common use cases for AI and ML. It could be a data science director, or a team of business analysts and data scientists.Keep a shortlist of the business priorities that can truly benefit from AI or ML.  During implementation, work through this list starting with the most feasible. By taking this approach, you’re more likely to generate significant business value as you build a set of ML models that solve specific business priorities.   Conversely, if a data science or machine learning team builds great solutions for problems that are not aligned with business priorities, the models they build are unlikely to be used at scale.Find a business sponsor. We’ve also found that AI projects are more likely to be successful when they have a senior executive sponsor that will champion them with other leaders in your organization. Don’t start an AI project without completing this critical step. Once you identify the right business priority, find the senior executive to own it.  Work with their team to get their buy-in and sponsorship. The more senior and committed, the better. If your CEO cares about AI, you can bet most of your employees will.Step 2:  Plan for explainable ML in models, dashboards and displaysAn important requirement from many business users is to have explanations from ML models. In many cases, it is not enough for an ML model to provide an outcome; it’s also important to understand why. Explanations help to build trust in the model’s predictions and offer useful factors with which business users can take action. In regulated industries such as financial services and healthcare, for example, there are regulations that require explanations of decisions. For example, in the United States the Equal Credit Opportunity Act (ECOA) enforced by the the Federal Trade Commission (FTC), gives consumers the right to know why their loan applications were rejected.  Lenders have to tell the consumer the specific reasons why they were rejected. Regulators have been seeking more transparency around how ML predictions are made.Choose new techniques for building explainable ML models. Until recently, most leading ML models have offered little or no explanations for their predictions. However, recent advances are emerging to provide explanations even for the most complex ML algorithms such as deep learning.  These include Local Interpretable Model-Agnostic Explanations (LIME),  Anchor, Integrated Gradients, and Shapley. These techniques offer a unique opportunity to meet the needs of business users even in regulated industries with powerful ML models.  Use the right technique to meet your users’ needs for model explanation. When you build ML models, be prepared to provide explanations globally and locally. Global explanations provide the model’s key drivers, and are the strongest predictors in the overall model. For example, the global explanation from a credit default prediction model will likely show the top predictors of default may include variables such as number of previous defaults, number of missed payments, employment status, length of time with your bank, length of time at your address, etc. In contrast, local explanations provide the reasons why a specific customer is predicted to default, and the specific reason will vary from one customer to another.  As you develop your ML models, build time into your plan to provide global and local explanations. We also recommend gathering user needs to help you choose the right technique for model explanation. For example, many financial regulators do not allow the use of surrogate models for explanations, which rules out techniques like LIME. In this instance, the Integrated Gradients technique would be more suited to this use case.Also, be prepared to share the model’s explanations wherever you show the model’s results — this can be on analytics dashboards, embedded apps or other displays. This will help to build confidence in your ML models. Business users are more likely to trust your ML model if it provides intuitive explanations for its predictions. Your business users are more likely to take action on the predictions if they trust the model. Similarly, with these explanations, your models are more likely to be accepted by regulators.Step 3: Broaden expertise in data analytics and data engineering within your organizationTo realize the full potential of AI, you need good people with the right skills. This is a big challenge for many organizations given the acute shortage of ML engineers — many organizations really struggle to hire them. You can address this skills shortage by upskilling your existing employees and taking advantage of a new generation of products that simplify AI model development.Upskill your existing employees. You don’t always need PhD ML engineers to be successful with ML. PhD ML engineers are great if your applications need research and development, for example, if you were building driverless cars.  But most typical applications of AI or ML do not require PhD experts. What you need instead are people who can apply existing algorithms or even pre-trained ML models to solve real world problems. For example, there are powerful ML models for image recognition, such as ResNet50 or Inception V3, that are available for free in the open source community. You don’t need an expert in computer vision to use them. Instead of searching for unicorns, start by upgrading your existing data engineers and business analysts and be sure they understand the basics of data science and statistics to use powerful ML algorithms correctly.At Google we provide a wealth of ML training — from Qwiklabs to Coursera courses (e.g. Machine Learning with TensorFlow on Google Cloud Platform Specialization or Machine Learning for Business Professionals). We also offer immersive training such as instructor-led courses and a four-week intensive machine learning training program at the Advanced Solutions Lab. These courses offer great avenues to train your business analysts, data engineers and developers on machine learning.Take advantage of products that simplify AI model development. Until recently, you needed sophisticated data scientists and machine learning engineers to build even the simplest of ML models. This workforce required deep knowledge in core ML algorithms in order to choose the right one for each problem. However, that is quickly changing. Powerful but simple ML products such as Cloud AutoML from Google Cloud make it possible for developers with limited knowledge of machine learning to train high-quality models specific to their business needs. Similarly, BigQuery ML enables data analysts  to build and operationalize  machine learning models in minutes in BigQuery using simple SQL queries. With these two products, business analysts, data analysts and data engineers can be trained to build powerful machine learning models with very little ML expertise.Make AI a team sport. Machine learning teams should not exist in silos; they must be connected to analytics and data engineering teams. This will facilitate operationalization of models. Close collaboration between ML engineers and business analysts will help the ML team tie their models to important business priorities through the right KPIs. It also allows business analysts to run experiments to demonstrate the business value of each ML model. Close collaboration between ML and data engineering teams also helps speed up data preparation and model deployment in production. The results of ML models need to be displayed in applications or analytics and operational dashboards. Data engineers are critical in the development of data pipelines that are needed to operationalize models and integrate them into business workflows for the right end users.  It is very tempting to think that you have to hire a large team of ML engineers to be successful. In our experience, this is not always necessary or scalable. A more pragmatic approach to scale is to use the right combination of business analysts working closely with ML engineers and data engineers. A good recommendation is to have six business analysts and three data engineers for each ML engineer. More details on the recommended team structure is available in our Coursera course, Machine Learning for Business Professionals.Conclusion  As many organizations start to explore AI and machine learning, they are confronted with the question of how to realize the business potential of these powerful technologies. Based on our experience working with customers across industries, we recommend the three steps in this blog post to realize business value from AI.To learn more about AI and machine learning on Google Cloud, visit our Cloud AI page.
Quelle: Google Cloud Platform

Leroy Merlin: Transforming the Russian home improvement market with APIs

Editors note:Today we hear from Sergei Lega, enterprise architect at Leroy Merlin Russia, a retail chain specializing in the sale of products for construction, decoration and home furnishing. Read on to learn how Leroy Merlin is using APIs and API management to simplify how partners integrate with its services.Leroy Merlin is expanding our network of retail stores rapidly in Russia, and as part of this expansion we are undertaking a digital transformation. Not only has this process tested our technological capabilities, but it also presents us with the challenge of transforming our mindset. To offer expanded services to our customers, we rely on a rich set of APIs and microservices created and managed in Google Cloud’s Apigee API Platform.Leroy Merlin Russia sells products for construction, home decoration, and furnishing. As a DIY-focused retailer, we see a great opportunity for differentiating ourselves in the marketplace by expanding the types of services we can offer our customers beyond just the sale of our products. We currently have more than 70 partners around Russia focused on three use cases: window installation, kitchen installation, and professional building materials. These partners offer customers and building professionals access to services that enhance their Leroy Merlin customer journey.But we wanted to make it even simpler and more seamless for customers to access these services. That required a clearly defined API strategy. We now offer a set of endpoints, built from microservices and exposed as APIs, that allow us to securely share pricing, inventory, and product information, along with payment services. These services let us connect our platform and services with all the third-party merchants in our ecosystem; they can easily get onboarded, and then upload and synchronize their product databases to the Leroy Merlin Marketplace quickly, and in a scalable environment.Now, when a customer purchases windows online or from one of our stores, they can continue their journey by acquiring necessary measurement and installation services at the same time, even though these services might be provided by one of our partners. The same goes for kitchen installation, which typically requires a complex set of services like plumbing and electricity that the customer would normally need to source independently.When Apigee announced its Istio integration in 2018, we knew that we could simplify and manage our exposure of microservices from an Istio mesh by adding API management capabilities via Istio’s native configuration mechanism. At the moment, we’re using Istio in a few Kubernetes instances, which makes sharing these services inside our development team—and our ability to consume them—much simpler.Apigee’s API management policies and reporting can be applied to any service, so management policies such as API key validation, quota enforcement, and JSON web token validation can be easily controlled from the Apigee UI. In the future, we plan to extend Istio company-wide as a cornerstone of our microservices management, which will provide us with very granular control of traffic flows and access policies. It will also give us 360-degree monitoring and security capabilities, along with service discovery in a multi-cluster environment.Many of our roughly 100 APIs are exposed to third-party developers, but some are exposed internally as well; we are working to make Apigee the focal point for integrations and new service development inside the company. As we continue to develop microservices and attract new developers to our marketplace, we are keeping a mindset of APIs as products, which reflects our customer journey-focused strategy. By the end of 2019, we expect to finish our developer platform and achieve full usability, and at that point we will really begin to scale our ecosystem and start to visualize concrete benefits for Leroy Merlin Russia, our customers, and our partners.Our API journey is all about maximizing connectivity and agility with an API-first architecture in seamless partnership with our partners nationwide. So far, Apigee has been a great partner on this journey.Learn more about API management on Google Cloud by visiting our Apigee page.
Quelle: Google Cloud Platform

Building hybrid blockchain/cloud applications with Ethereum and Google Cloud

Adoption of blockchain protocols and technologies can be accelerated by integrating with modern internet resources and public cloud services. In this blog post, we describe a few applications of making internet-hosted data available inside an immutable public blockchain: placing BigQuery data available on-chain using a Chainlink oracle smart contract. Possible applications are innumerable, but we’ve focused this post on a few that we think are of high and immediate utility: prediction marketplaces, futures contracts, and transaction privacy.Hybrid cloud-blockchain applicationsBlockchains focus on mathematical effort to create a shared consensus. Ideas quickly sprang up to extend this model to allow party-to-party agreements, i.e. contracts. This concept of smart contracts was first described in a 1997 article by computer scientist Nick Szabo. An early example of inscribing agreements into blocks was popularized by efforts such as Colored Coins on the Bitcoin blockchain.Smart contracts are embedded into the source of truth of the blockchain, and are therefore effectively immutable after they’re a few blocks deep. This provides a mechanism to allow participants to commit crypto-economic resources to an agreement with a counterparty, and to trust that contract terms will be enforced automatically and without requiring third party execution or arbitration, if desired.But none of this addresses a fundamental issue: where to get the variables with which the contract is evaluated. If the data are not derived from recently added on-chain data, a trusted source of external data is required. Such a source is called an oracle.In previous work, we made public blockchain data freely available in BigQuery through the Google Cloud Public Datasets Program for eight different cryptocurrencies. In this article, we’ll refer to that work as Google’s crypto public datasets. You can find more details and samples of these datasets in the GCP Marketplace. This dataset resource has resulted in a number of GCP customers developing business processes based on automated analysis of the indexed blockchain data, such as SaaS profit sharing, mitigating service abuse by characterizing network participants, and using static analysis techniques to detectsoftware vulnerabilities and malware. However, these applications share a common attribute: they’re all using the crypto public datasets as an input to an off-chain business process.In contrast, a business process implemented as a smart contract is performed on-chain, and that is of limited utility without having access to off-chain inputs. To close the loop and allow bidirectional interoperation, we need to be not only making blockchain data programmatically available to cloud services, but also cloud services programmatically available on-chain to smart contracts.Below, we’ll demonstrate how a specific smart contract platform (Ethereum) can interoperate with our enterprise cloud data warehouse (BigQuery) via oracle middleware (Chainlink). This assembly of components allows a smart contract to take action based on data retrieved from an on-chain query to the internet-hosted data warehouse. Our examples generalize to a pattern of hybrid cloud-blockchain applications in which smart contracts can efficiently delegate to cloud resources to perform complex operations. We will explore other examples of this pattern in future blog posts.How we built itAt a high level, Ethereum Dapps (i.e. smart contract applications) request data from Chainlink, which in turn retrieves data from a web service built with Google App Engine and BigQuery.To retrieve data from BigQuery, a Dapp invokes the Chainlink oracle contract and includes payment for the parameterized request to be serviced (e.g. gas price at a specified point in time). One or more Chainlink nodes are listening for these calls, and upon observing, one executes the requested job. External adapters are service-oriented modules that extend the capability of the Chainlink node to authenticated APIs, payment gateways, and external blockchains. In this case, the Chainlink node interacts with a purpose-built App Engine web service.On GCP, we implemented a web service using the App Engine Standard Environment. We chose App Engine for its low cost, high scalability, and serverless deployment model. App Engine retrieves data from BigQuery, which hosts the public cryptocurrency datasets. The data we’ve made available are from canned queries, i.e. we aren’t allowing arbitrary data to be requested from BigQuery, but only the results of parameterized queries. Specifically, an application can request the average gas price for either (A) a particular Ethereum block number, or (B) a particular calendar date.After a successful response from the web service, the Chainlink node invokes the Chainlink oracle contract with the returned data, which in turn invokes the Dapp contract and thus triggers execution of downstream Dapp-specific business logic. This is depicted in the figure below.For details on integrating your Dapp, please see our documentation for requesting data from BigQuery via Chainlink. Illustrative queries to BigQuery can be seen for gas price by date and by block number.How to use the BigQuery Chainlink oracleIn this section we’ll describe how useful applications can be built using Google Cloud and Chainlink.Use case 1: Prediction marketplacesParticipants in prediction marketplaces allocate capital to speculate on future events in general. One area of intense interest is which smart contract platform will predominate because, being networks ecosystems, their value will follow a power law (i.e. winner-take-all) distribution. There are many differing opinions about which platform will succeed, as well as how success can be quantified.By using the crypto public datasets, it’s possible for even complex predictions like the recent $500,000 bet about Ethereum’s future state to be settled successfully on-chain. We’ve also documented how the variety, volume, recency, and frequency of Dapp utilization can be measured by retrieving 1-, 7-, and 30-day activity for a specific Dapp.These metrics are known as daily-, weekly-, and monthly-active users and are frequently used by web analytics and mobile app analytics professionals to assess website and app and success.Use case 2: Hedging against blockchain platform riskThe decentralized finance movement is rapidly gaining adoption due to its successful reinvention of the existing financial system in blockchain environments which, on a technical basis, are more trustworthy and transparent than current systems.Financial contracts like futures and options were originally developed to enable enterprises to reduce/hedge their risk related to resources critical to their operation. Similarly, data about on-chain activity such as average gas prices, can be used to create simple financial instruments that provide payouts to their holders in cases where gas prices rise too high. Other qualities of a blockchain network, e.g. block times and/or miner centralization, create risks that Dapp developers want to protect themselves against. By bringing high quality data from the crypto public datasets to financial smart contracts, Dapp developers’ risk exposure can be reduced. The net result is more innovation and accelerated blockchain adoption.We’ve documented how an Ethereum smart contract can interact with the BigQuery oracle to retrieve gas price data at a particular point in time. We’ve also implemented a stub of a smart contract option showing how the oracle can be used to implement a collateralized contract on future gas prices, a critical input for a Dapp to function.Use Case 3: Enabling commit/reveals across Ethereum using submarine sendsOne of the commonly mentioned limitations in Ethereum itself is a lack of transaction privacy, creating the ability for adversaries to take advantage of on-chain data leakage to exploit users of commonly used smart contracts. This can take the form of front-running transactions involving distributed exchange (DEx) addresses. As described in To Sink Frontrunners, Send in the Submarines, the problem of front-running plagues all current DExs and slows down the Decentralized Finance movement’s progress, as exchanges are a key component of many DeFi products/applications.By using the submarine sends approach, smart contract users can increase the privacy of their transactions, successfully avoiding adversaries that want to front-run them, making DExs more immediately useful. Though this approach is uniquely useful in stopping malicious behavior like front-running, it also has its own limitations, if done without an oracle.Implementing submarine sends without an oracle produces blockchain bloat. Specifically, the Ethereum virtual machine allows a contract to see at maximum 256 blocks upstream in the chain, or approximately one hour. This maximum scope limits the practical usefulness of submarine sends because it creates unnecessary denormalization when rebroadcasting of data is required. In contrast, by implementing submarine sends with an oracle, bloat is eliminated because operating scope is increased to include all historical chain data.ConclusionWe’ve demonstrated how to use Chainlink services to provide data from the BigQuery crypto public datasets on-chain.This technique can be used to reduce inefficiencies (submarine sends use case) and in some cases add entirely new capabilities (hedging use case) to Ethereum smart contracts, enabling new on-chain business models to emerge (prediction markets use case).The essence of our approach is to trade a small amount of latency and transaction overhead for a potentially large amount of economic utility. As a concrete example, ordinary submarine sends require on-chain storage that scales O(n) with blocks added to the blockchain, but can be reduced to O(1) if the calling contract waits an extra two blocks to call the BigQuery oracle.We anticipate that this interoperability technique will lead developers to create hybrid applications that take the best of what smart contract platforms and cloud platforms have to offer. We’re particularly interested in bringing Google Cloud Platform’s ML services (e.g. AutoML and Inference APIs).By allowing reference to on-chain data that is out of scope, we improve the operational efficiency of the smart contract platform. In the case of submarine sends, storage consumption that scales O(n) with block height is reduced to O(1), at the trade-off cost of additional transactional latency to interact with an oracle contract.
Quelle: Google Cloud Platform

Sharing enthusiasm from the cloud community for our Looker acquisition

In the week since we announced our intent to acquire Looker, a unified platform for business intelligence, data applications and embedded analytics, we’ve heard from many customers, partners, and industry analysts that are enthusiastic about our decision to provide customers with a comprehensive analytics solution. By combining Looker’s robust business intelligence and analytics platform with BigQuery, our enterprise data warehouse, customers can solve more business challenges, faster—all while remaining in complete control of their data.Here are a few of the many responses we’ve heard about the addition of the Looker analytics platform to our portfolio:“As we serve the evolving needs of our customers, it’s critical for us to empower our teams with information,” said Barbara Sanders, VP and Chief Architect at The Home Depot. “BigQuery and Looker quickly provides our engineering teams with operational data and visualizations to help identify application or infrastructure issues that could impact the customer experience.””Our data platform provides a fully managed service that makes it easy and cost-effective to create, manage and scale advanced analytics capabilities for advertisers and marketers,” said Iain Niven-Bowling, EVP, 2Sixty and Essence/WPP.  “The combination of BigQuery and Looker provide the underlying technology and Google’s acquisition only strengthens this and enables us to continue to build highly valued products on top of this robust end to end solution.”“The data analytics market is rapidly evolving and changing, and 451 Research has identified that businesses who successfully turn data into insight via analytics have a competitive advantage,” said Matt Aslett, Research Vice President, 451 Research. “The acquisition of Looker is a key move for Google Cloud that will increase the value it can provide to customers across its six key industries.”“The acquisition of Looker makes sense for Google Cloud and for their customers,” said Anil Chakravarthy, CEO at Informatica. “Looker’s rich analytics platform complements Google Cloud’s high-scale infrastructure and digital transformation capabilities. As the leader in enterprise cloud data management, we talk to a lot of customers who want to get more value from their data, and we believe every business interested in cloud analytics should be excited about this acquisition.”“Looker provides Google Cloud the ability to provide advanced analytics, visualization, and insight generation to all parts of an organization,” said Tom Galizia, Principal, Deloitte Consulting LLP. “It shows continued commitment and alignment to Google Cloud’s vision of democratizing and supercharging their customer’s data and information. Google organized the world’s information and now they want to do the same for the enterprise.”“Google Cloud is building an end-to-end platform for enterprise transformation and its acquisition of Looker will help bring more complete business intelligence, analytics and visualization capabilities to its customers,” said Sanjeev Vohra, group technology officer and data business group lead at Accenture. “Looker’s support for multiple public clouds and databases aligns well with Google’s multi-cloud approach and we look forward to working with our enterprise clients to implement these capabilities at scale.”I’m personally very excited about all the ways bringing Google Cloud and Looker together can help our customers. We share a common philosophy around solving business problems for customers across all industries while also supporting our customers where they are, be it on Google Cloud, in other public clouds, or on premises. I look forward to sharing more once the deal closes.
Quelle: Google Cloud Platform

Google Cloud networking in-depth: How Andromeda 2.2 enables high-throughput VMs

Here at Google Cloud, we’ve always aimed to provide great network bandwidth for Compute Engine VMs, thanks in large part to our custom Jupiter network fabric and Andromeda virtual network stack. During Google Cloud Next ‘19, we improved that bandwidth even further by doubling the maximum network egress data rate to 32 Gbps for common VM types. We also announced VMs with up to 100 Gbps bandwidth on V100 and T4 GPU accelerator platforms—all without raising prices or requiring you to use premium VMs.Specifically, for any Skylake or newer VM with at least 16 vCPUs, we raised the egress bandwidth cap to 32 Gbps for same-zone VM-to-VM traffic; this capability is now generally available. This includes n1-ultramem VMs, which provide more compute resources and memory than any other Compute Engine VM instance type. There is no additional configuration needed to get that 32 Gbps throughput.Meanwhile, 100 Gbps Accelerator VMs are in alpha, soon in beta. Any VM with eight V100 or four T4 GPUs attached will have bandwidth caps raised to 100 Gbps.These high-throughput VMs are ideal for running compute-intensive workloads that also need a lot of networking bandwidth. Some key applications and workloads that can leverage these high-throughput VMs are:High-performance computing applications, batch processing, scientific modelingHigh-performance web serversVirtual network appliances (firewalls, load balancers)Highly scalable multiplayer gamingVideo encoding servicesDistributed analyticsMachine learning and deep learningIn addition, services built on top of Compute Engine like CloudSQL, Cloud Filestore and some partner solutions can leverage 32 Gbps throughput already.One use case that is particularly network- and compute-intensive is distributed machine learning (ML). To train large datasets or models, ML workloads use a distributed ML framework, e.g., TensorFlow. The dataset is divided and trained by separate workers, which exchange model parameters with each other. These ML jobs consume substantial network bandwidth due to large model size and frequent data exchanges among workers. Likewise, the compute instances that run the worker nodes create high throughput requirements for VMs and the fabric serving the VMs. One customer, a large chip manufacturer, leverages 100 Gbps GPU-based VMs to run these massively parallel ML jobs, while another customer uses our 100 Gbps GPU machines to test a massively parallel seismic analysis application.Making it all possible: Jupiter and AndromedaOur highly-scalable Jupiter network fabric and high-performance, flexible Andromeda virtual network stack are the same technologies that power Google’s internal infrastructure and services.Jupiter provides Google with tremendous bandwidth and scale. For example, Jupiter fabrics can deliver more than 1 Petabit/sec of total bisection bandwidth. To put this in perspective, this is enough capacity for 100,000 servers to exchange information at a rate of 10 Gbps each, or enough to read the entire scanned contents of the Library of Congress in less than 1/10th of a second.Andromeda, meanwhile, is a Software Defined Networking (SDN) substrate for our network virtualization platform, acting as the orchestration point for provisioning, configuring, and managing virtual networks and in-network packet processing. Andromeda lets us share Jupiter networks for many different uses, including Compute Engine and bandwidth-intensive products like Cloud BigQuery and Cloud Bigtable.Since we last blogged about Andromeda, we launched Andromeda 2.2. Among other infrastructure improvements, Andromeda 2.2 features increased performance and improved performance isolation through the use of hardware offloads, enabling you to achieve the network performance you want, even in a multi-tenant environment.Increasing performance with offload enginesIn particular, Andromeda now takes full advantage of the Intel QuickData DMA Engines to offload payload copies of larger packets. Driving the DMA hardware directly from our OS-bypassed Andromeda SDN enables the SDN to spend more time processing packets rather than moving data around. We employ the processor’s IOMMU to provide security and safety isolation for DMA Engine copies.In Google Cloud Platform (GCP), we encrypt all network traffic in transit that leaves a physical boundary not controlled by Google or on behalf of Google. Andromeda 2.2 now utilizes special-purpose network hardware in the Network Interface Card (NIC) to offload that encryption, freeing the host machine’s CPUs to run guest vCPUs more efficiently.Furthermore, Andromeda’s unique architecture allows us to offload other virtual network processing to hardware opportunistically, improving performance and efficiency under the hood without requiring the use of SR-IOV or other specifications that tie a VM to a physical machine for its lifetime. This architecture also enables us to perform a “hitless upgrade” of the Andromeda SDN as needed to improve performance, add features, or fix bugs.Combined, these capabilities have allowed us to seamlessly upgrade our network infrastructure across five generations of virtual networking—increasing VM-to-VM bandwidth by nearly 18X (and more than 50X for certain accelerator VMs) as well as reducing latency by 8X—all without introducing downtime for our customers.Performance isolationAll that performance is meaningless if your VM is scheduled on a host with other VMs that are overloading or abusing the network and preventing your VM from achieving the performance you expect. Within Andromeda 2.2, we’ve made several improvements to provide isolation, ensuring that each VM receives its expected share of bandwidth. Then, for the rare cases when too many VMs are trying to push massive amounts of network traffic simultaneously, we reengineered the algorithm to optimize for fairness.For VM egress traffic, we schedule the act of looking for work on each VM’s transmit queues such that each VM gets its fair share of bandwidth. If we need to throttle a VM because it has reached its network throughput limits, we provide momentary back-pressure to the VM, which causes a well-behaved guest TCP stack to reduce its offered load slightly without causing packet loss.For VM ingress traffic, we use offloads in the NIC to steer packets into per-VM NIC receive queues. Then, similarly to egress, we look for work on each of those queues in proportion to each VM’s fair share of network bandwidth. In the rare event that a VM is receiving an excessive amount of traffic, its per-VM queue fills up and eventually starts dropping packets. Those drops will again cause a well-behaved TCP connection, originating perhaps from another VM or the internet, to back off slightly, preserving performance for that connection. A VM with a badly behaved connection might not back off, due possibly to bugs in a customer’s workload, or even malicious intent. Either way, per-VM receive queues mean we don’t need to drop packets for other VMs on the host, protecting those VMs from the performance pathologies of a bad actor.You can never have too good a networkAt Google we’re constantly working to improve the performance and reliability of our network infrastructure. Stay tuned for new advances from Google Cloud, including low-latency products focused on HPC use cases, and even higher bandwidth VMs. We’d love your feedback and what else you’d like to see in networking. You can reach us at gcp-networking@google.com.
Quelle: Google Cloud Platform

Jupyter Notebook Manifesto: Best practices that can improve the life of any developer using Jupyter notebooks

Many data science teams, both inside and outside of Google, find that it’s easiest to build accurate models when teammates can collaborate and suggest new hyperparameters, layers, and other optimizations. And notebooks are quickly becoming the common platform for the data science community, whether in the form of AI Platform Notebooks, Kaggle Kernels, Colab, or the notebook that started it all, Jupyter.A Jupyter Notebook is an open-source web application that helps you create and share documents that contain live code, equations, visualizations, and narrative text. Because Jupyter Notebooks are a relatively recently-developed tool, they don’t (yet) follow or encourage consensus-based software development best practices.Data scientists, typically collaborating on a small project that involves experimentation, often feel they don’t need to adhere to any engineering best practices. For example, your team may have the odd Python or Shell script that has neither test coverage nor any CI/CD integration.However, if you’re using Jupyter Notebooks in a larger project that involves many engineers, you may soon find it challenging to scale your environment, or deploy to production.To set up a more robust environment, we established a manifesto that incorporates best practices that can help simplify and improve the life of any developer who uses Jupyter tools.It’s often possible to share best practices across multiple industries, since the fundamentals remain the same. Logically, data scientists, ML researchers, and developers using Jupyter Notebooks should carry over the best practices already established by the older fields of computer science and scientific research.Here is a list of best practices adopted by those communities, with a focus on those that still apply today:Our Jupyter Notebooks development manifesto0. There should be an easy way to use Jupyter Notebooks in your organization, where you can “just write code” within seconds.1. Follow established software development best practices: OOP, style guides, documentation2. You should institute version control for your Notebooks3. Reproducible Notebooks4. Continuous Integration (CI)5. Parameterized Notebooks6. Continuous Deployment (CD)7. Log all experiments automaticallyBy following the above guidelines in this manifesto, we want to help you to achieve this outcome:Note: Security is a critical part of Software Development practices. In a future blog we will cover best practices for secure software development with Jupyter Notebooks, currently this topic is not covered in this blog post, but is something critical you must consider.PrinciplesEasy access to Jupyter NotebooksCreating and using a new Jupyter Notebook instance should be very easy. On Google Cloud Platform (GCP), we just launched a new service called AI Platform Notebooks. AI Platform Notebooks is a managed service that offers an integrated JupyterLab environment, in which you can create instances running JupyterLab that come pre-installed with the latest data science and machine learning frameworks in a single click.Follow established software development best practicesThis is essential. Jupyter Notebook is just a new development environment for writing code. All the best practices of software development should still apply:Version control and code review systems (e.g. git, mercurial).Separate environments: split production and development artifacts.A comprehensive test suite (e.g. unitests, doctests) for your Jupyter Notebooks.Continuous integration (CI) for faster development: automate the compilation and testing of Jupyter notebooks every time a team member commits changes to version control.Just as an Android Developer would need to follow the above best practices to build a scalable and successful mobile app, a Jupyter Notebook focused on sustainable data science should follow them, too.Using a version control system with your Jupyter NotebooksVersion control systems record changes to your code over time, so that you can revisit specific versions later. This also lets you develop separate branches in parallel, such as allowing you to perform code reviews and providing CI/CD revision history to know who is the expert in certain code areas.In order to unblock effective use of a version control system like git, there should be a tool well integrated into the Jupyter UI that allows every data scientist on your team to effectively resolve conflicts for the notebook, view the history for each cell, and commit and push particular parts of the notebook to your notebook’s repository right from the cell.Don’t worry, though: if you perform a diff operation in git and suddenly see that multiple lines have changed, instead of one, this is the intended behavior, as of today. With Jupyter notebooks, there is a lot of metadata that can change with a simple one-line edit, including kernel spec, execution info, and visualization parameters. To apply the principles and corresponding workflows of traditional version control to Jupyter notebooks, you need the help of two additional tools:nbdime: tool for “diffing” and merging of Jupyter Notebooksjupyterlab-git: a JupyterLab extension for version control using gitIn this demo, we clone a Github repository, then after this step is completed, we modified some minor parts of the code. If you execute a diff command, you would normally expect git to show only the lines that changed, but as we explained above, this is not true for Jupyter notebooks. nbdime allows you to perform a diff from Jupyter notebook and also from CLI, without the distraction of extraneous JSON output.Reproducible notebooksYou and your team should write notebooks in such a way that anyone can rerun it on the same inputs, and produce the same outputs. Your notebook should be executable from top to bottom and should contain the information required to set up the correct, consistent environment.How to do it?If you are using AI Platform notebooks, for example on the TensorFlow M22 image, this platform information should be embedded in your notebook’s metadata for future use.Let’s say you create a notebook and install TensorFlow’s nightly version. If you execute the same notebook in a different Compute Engine instance, you need to make sure that this dependency is already installed. A notebook should have a notion of dependencies and its dependencies appropriately tracked, this can be in the environment or in the notebook metadata.In summary, a notebook is reproducible if it meets the following requirements:The Compute Engine image and underlying hardware used for creating the Notebook should be embedded in the notebook itself.All dependencies should be installed by the notebook itself.A notebook should be executable from top to bottom without any errors.In this demo we clone a GitHub repository that contains a few notebooks, and then activate the new Nova plugin, which allows you to execute notebooks directly from your Jupyter UI. Nova and its corresponding compute workload runs on a separate Compute Engine instance using Nteract papermill. AI Platform notebooks support this plugin by default—to enable it, run the enable_notebook_submission.sh script.Nova pluginContinuous integrationContinuous integration is a software development practice that requires developers to integrate code into a shared repository. Each check-in is verified by an automated build system, allowing teams to detect problems at early stages. Each change to a Jupyter notebook should be validated by a continuous integration system before being checked in; this can be done using different setups (non-master remote branch, remote execution in local branch, etc)In this demo, we modified a notebook so that it contains invalid Python code, and then we commit the results to git. This particular git repository is connected to Cloud Build. The notebook executes and the commit step fails as the engine finds an invalid cell at runtime. Cloud Build creates a new notebook to help you to troubleshoot your mistake. Once you correct the code, you’ll find that your notebook runs successfully, and Cloud Build can then integrate your code.Parameterized NotebooksReusability of code is another software development best practice.You can think of a production-grade notebook as a function or a job specification: A notebook takes a series of inputs, processes them, and generates some outputs—consistently. If you’re a data scientist you might start running grid search to find your model’s optimal hyperparameters for training, stepping through different parameters such as learning rate, num_steps or batch_size:During notebook execution, you can pass different parameters to your models, and once results are generated, pick the best options using the same notebook. For the previous execution steps, consider using Papermill and its ability to configure different parameters, these parameters will be used by the notebook during execution. This means you can override the default source of data for training or submit the same notebook with different input (for example different learning rate, epochs, etc).In this demo, we execute a notebook passing different extra parameters. Here we’re using information about bike rentals in San Francisco, with the bike rental data stored in BigQuery. This notebook queries the data and generates a top ten list and station map of the most popular bike rental stations, using start and end date as parameters. By tagging the cells with a parameters tags so Papermill can use these options, you can run reuse your notebook without making any updates to it, but still generate a different dashboard.Continuous deploymentEach version of a Jupyter Notebook that has passed all the tests should be used to automatically generate a new artifact and deploy it to staging and production environments.In this demo, we show you how to perform continuous deployment on GCP, incorporating Cloud Functions, Cloud Pub/Sub, and Cloud Scheduler.Now that you’ve established a CI system that generates a tested, reproducible, and parameterized notebook, let’s automate the generation of artifacts for a continuous deployment system.Based on the previous CI system, there is an additional step in CI to upload a payload to Cloud Functions when tests are successful. When triggered, this payload sends the same artifact build request with parameters to Cloud Build, spinning up the instance and storing the results. To add the automation, we’ll orchestrate using Cloud Pub/Sub (message passing) and Cloud Scheduler (cron). The first time the cloud function is deployed, it will create a new Pub/Sub topic and subscribe to it, later any published message will start the cloud function.  This notification is published using Cloud Scheduler, which sends messages based on time. Cloud Scheduler can use different interfaces, for example new data arriving in Cloud Storage or a manual job request.Log all experimentsEvery time you try to train a model, metadata about the training session should be automatically logged. You’ll want to keep track of things like the code you ran, hyperparameters, data sources, results, and training time. This way, you remember past results and won’t find yourself wondering if you already tried running that experiment.ConclusionBy following the guidelines defined above, you can make your Jupyter notebooks deployments more efficient. To learn more, read our AI Platform Notebooks overview.Acknowledgements: Gonzalo Gasca Meza, Developer Programs Engineer and Karthik Ramachandran, Product Manager contributed to this post.
Quelle: Google Cloud Platform