Supporting your compliance journey with Compliance Resource Center

Building and maintaining a compliance program can be complex and challenging. It requires implementing policies, operational and physical security controls, and various reporting mechanisms. We know our customers have to manage a wide variety of regulatory and industry-specific compliance requirements, and Google Cloud is committed to being a partner in your compliance journey. To help you manage your compliance initiatives, today we’re announcing an updated Compliance Resource Center. It provides on-demand access to helpful resources to support your compliance efforts, verify technical compliance and control requirements, and help you understand region- and industry-specific regulations. Compliance Resource Center can help you: Learn more about industry-specific compliance requirements and how we support compliance needs for Retail,Education, Media & Entertainment, Government & Public Sector, Financial Services, and Healthcare & Life SciencesQuickly download compliance evidence via Compliance Reports Manager, which provides access to documentation such as our ISO/IEC certificates, SOC reports, self-assessments, and cloud control to requirement mappingsObtain an insider view into Google Cloud’s security, risk, and compliance practices via our Data Protection and Compliance pageGet answers to the most frequently asked questions forFIPS 140-2,FedRAMP,PCI,HIPAA,ISO 27001, andISO 27018Navigate directly to region-specific compliance offerings pagesUnderstand the products and services we offer to help support your specific compliance needsAccess information on the tools, guidance, and legal commitments we provide to help our customers align with laws, regulations, alignments, and frameworks that may not require formal certification or attestationCompliance Resource Center is part of our ongoing commitment to make Google Cloud the most trusted and transparent cloud provider. As the global regulatory landscape evolves, we’ll continue to update Compliance Resource Center to make sure we support your compliance needs, whatever they may be. To learn more about our most up-to-date compliance offerings, please check out our compliance offerings page.
Quelle: Google Cloud Platform

Using Recommenders to keep your cloud running optimally

As a cloud project owner, you want your environment to run smoothly and efficiently. At Google Cloud, one of the ways we help you do that is through a family of tools we call Recommenders, which leverage analytics and machine learning to automatically detect issues and present you with optimizations that you can act on. With Recommenders, our goal is to suggest quick, easy ways to optimize your cloud for price, performance, and security. Several Recommenders are already generally available, including VM Recommenders, Firewall Insights and IAM Recommender. In fact, there are many teams at Google Cloud who are working to build Recommenders that help you improve your cloud. But, we want to make sure it’s effortless and simple for you to find and take action on those recommendations. That’s why we’re also releasing the beta of our new Recommendation Hub, which highlights proactive recommendations in one place for you to view and act on. Recommendation Hub is vital to bringing all of these optimization efforts together for you to see and take action on. Not only does the Hub capture the most impactful opportunities in your projects, but it also helps guide you across Google Cloud in general. Whether it’s networking, security, compute and storage resources, cost and billing, or Anthos, the Recommendation Hub will give you the tools you need to prioritize, analyze, and act on all of these valuable insights and recommendations.Click to enlargeRecommendation Hub and Recommenders are also part of a bigger initiative at Google Cloud to use machine learning and analytics to help you make better decisions, drive down costs, and automate your operations. There will be more announcements on that soon, but for now, let’s explore some of the Recommenders currently available for you to use.Optimize resources for cost and performance with VM RecommendersThere will come a day when you might need to scale your virtual machine (VM) instances up or down. For that, we’ve got two types of Recommenders available: one to help you optimize your VMs for cost and performance, and a second to help you identify and delete (or back up) your unused VMs and persistent disks (PD) to avoid paying for resources you don’t use. All of this helps you properly balance your performance and cost based on your unique situation. One customer, VuClip, decided to experiment with the Idle VM Recommender and is now making it a key part of how they optimize their cloud environment: “We were in the midst of a hackathon recently, and we decided to test out Google Cloud’s Idle VM Recommender. We quickly learned that we had over 200 VMs that were sitting idle, but ultimately costing us money, that we wouldn’t have otherwise known about. The real bonus was that it only took a matter of seconds for Google Cloud to shine light on these idle VMs.” – Hrushikesh Kulkarni, Associate Director of Technology, VuClipSecure your network with Firewall InsightsFirewall rule management is a constant challenge for security and network engineers. Firewall configuration can grow in complexity as more accesses are added over time, making it really hard to maintain. Firewall Insights, now in beta, is a new tool that helps secure your cloud environment by detecting and providing easy remediation options for a number of key firewall issues, including:Shadowed rules that can’t be reached during firewall rule evaluation because they overlap with higher-priority rulesUnnecessary allow rules, open ports and IP rangesSudden hit increases on firewall rules (and a drill down into the source of the traffic) that signal an emerging attackRedundant firewall rules, which can be cleaned up to reduce the total firewall rule countDeny firewall rules with hit counts from sources trying to access unauthorized IP ranges and portsFlowmon, a company that develops network performance monitoring and network security products, has been using Firewall Insights to gain new insights into its existing firewall rules:“Firewall Insights has already proven to be an extremely valuable tool. With barely any effort, it gives us precise knowledge about what our firewall rules are actually doing. Through that, we’re able to optimize all of our firewall rules quickly and easily.” – Boris Parák, Cloud Product Manager, FlowmonFor more information on using Firewall Insights (which is also available in Network Intelligence Center), please reference our documentation or check out this video:Lock down unwanted access with IAM RecommenderIn addition to firewall rules, permissions play another crucial role in your overall security posture. WithIAM Recommender, you can remove unwanted access to Google Cloud resources with smart access control recommendations. IAM Recommender uses machine learning to automatically detect overly permissive access and help security teams figure out what permissions their project members really need. Not only does this help establish least-privilege best practices and reduce your organization’s security risks, but also prevents accidental changes to your data and cloud infrastructure. Here’s a video to show you how it works:Many more Recommenders coming soonWe’re busy building more Recommenders which will appear in Recommender Hub. Here are a few that you can expect to see within the next few months: Cost and performanceCompute Engine cross-family recommendations: Select the optimal VM family for your workload (e.g., memory-optimized).Committed Use Discount (CUD) maximizer: Keep your cloud costs on budget by making sure you utilize your discounts to the fullest. SecurityGKE RBAC: Assess and remove over-granted permissions.Security keys: Protect high-risk users against phishing by implementing phone-as-a-security-key.Reliability, availabilityCompute Engine predictive auto-scaling: Reduce latency and costs by scaling compute proactively.VPN tunnel: Proactively detect overutilized tunnels to prevent network packet loss.With Recommenders, we’re trying to take the guesswork and toil out of keeping your cloud running optimally. To learn more about how Recommenders can help you, please check out our upcoming session “Cloud is Complex. Managing it Shouldn’t Be” during our Next OnAir digital event.
Quelle: Google Cloud Platform

Last month today: May in Google Cloud

Last month brought new and continued challenges around the world, and new ways technology can help meet them. Top posts in May on the Google Cloud blog covered news on productivity, G Suite, and much more. Here’s what you missed.  Understanding cloud infrastructure to serve more people fasterThis post goes in-depth on how our Technical Solutions Engineers (TSE) team solved the case of a Google Cloud customer support ticket. Along the way to find the missing DNS packets, you’ll get a look at how support teams evaluate and troubleshoot on the way to finding a solution for customer issues, and what you can do to help fix issues if they occur.In May, we introduced Google Cloud VMware Engine, designed to make it easy to migrate or extend your on-prem workloads to Google Cloud. VMware Engine lets you run your workloads natively in a dedicated VMware environment in Google Cloud, so you don’t have to change any of your tools, processes, or policies.Mark your calendars for Google Cloud Next ‘20: OnAir from July 14 to September 8, where you’ll be able to access developer programs, keynotes, and hundreds of sessions—all free of charge. Each week you’ll find programming on a different topic, including infrastructure, security, app modernization, and cloud AI. Register and get more details on speakers and topics now.Making it easy to get started with G SuiteG Suite Essentials launched last month, giving groups and teams a faster, easier way to get started with G Suite. G Suite Essentials includes premium video conferencing with Google Meet, real-time collaboration and content management with Google Docs, Sheets, Slides, and Drive, and enterprise-grade security and reliability. It’s great for teams that aren’t ready to replace their current email or calendar tools, and it’s completely free through September 30. Doing more with what you haveFor many businesses, using their resources wisely has become especially important over the past few months. This post on understanding the principles of cloud cost optimization offers an overview of cost optimization concepts, tools, and tips on prioritizing your cost optimization projects. That’s a wrap for May. Stay tuned to what’s new in cloud on Twitter.
Quelle: Google Cloud Platform

5 ways to enhance your cloud storage security and data protection

Cloud storage is a foundational technology for many modern businesses, helping to store vast amounts of data that users can easily access and use to power modern data projects. At Google Cloud, we continually invest in protecting our customers’ data across all our products, including Cloud Storage.  For every Google Cloud product, security is always a top priority. As enterprise storage needs grow, our security and compliance protections grow too. Cloud Storage secures data by default with rich security controls and the ability to audit as needed. Features like Bucket Lock, Cloud Key Management Service (KMS), and Access Transparency already help keep your data safe in Cloud Storage. We’re announcing further product updates, now generally available, to protect your data, even in complex, multi-cloud environments. Let’s take a look at some of the new security features available in Cloud Storage.What’s new with Cloud Storage securityV4 signature support with Cloud StorageWe are happy to announce the GA launch of V4 signature support withCloud Storage. This is a critical multi-cloud security capability for our customers and partners. V4 signature capability enables customers to generate signed URLs (also referred to as pre-signed URLs) with limited permissions and duration, which they can issue to their clients/users who don’t need to have a Google identity. Signature-based authentications, especially through signed URLs, is a very common security posture used for content storage and delivery, SaaS platforms and applications, and analytics (enterprise data warehouses and analytics pipelines). You can take a look at a signature-based multimedia content storage and distribution setup example here. Hash-based message authentication (HMAC) for Cloud Storage service accountsYou can now manage and use hash-based message authentication (HMAC) credentials associated with Cloud Storage service accounts, rather than user accounts. This feature strengthens your authentication and security by not having to rely on credentials tied to the user accounts. This feature also lets you interoperate seamlessly among multiple cloud vendors with regards to security and authentication setups and practices.Uniform bucket-level access for Cloud IAMCloud Storage’s support for Cloud Identity and Access Management (Cloud IAM) enables you to apply access policies by role to Cloud Storage users, along with other Google Cloud products. The new uniform bucket-level access feature lets you uniformly configure access through Cloud IAM Policies to your Cloud Storage resources, allowing for manageability at scale. When it’s enabled on a bucket, only bucket-level Cloud IAM permissions grant access to that bucket and the objects it contains.Putting Cloud Storage security best practices into actionSecuring your enterprise storage data requires thinking ahead to protect your data against new threats and challenges. We often hear best practices and tips from Cloud Storage users on how they use Google Cloud products to enhance their company’s security posture. Here are five recommendations to use these new features and help prevent data leaks or hacks:1. Turn on uniform bucket-level access and its org policyUniform bucket-level access for Cloud Storage buckets lets you configure and enforce uniform Cloud IAM policies for your buckets. Turning this feature also ensures that you are safeguarded against any object-level ACLs, which become a challenge to manage access, especially at scale. This feature also offers an organizational policy that lets you enforce the use of uniform IAM access policies on all new buckets, if desired. Enforcing IAM policies at the bucket level can help prevent inadvertent public exposures, which can happen in the absence of this feature if users make individual objects public.This feature has been very useful for our customers in particular from financial services and big tech industries. It lets you manage uniform permissions at scale in situations where there are lots of developers/employees who need to access the data, but it can’t be exposed outside the company.2. Enable domain-restricted sharingOnce you’ve turned on uniform bucket-level access, another useful tool in Cloud Storage is to enforce the domain-restricted sharing constraint in an organization policy to prevent accidental public data sharing, or sharing beyond your organization. With this feature, organizations and development teams can move quickly, while security and governance teams can enforce security at scale and trust that resources have the right controls in place. Domain-restricted sharing can be used in conjunction with uniform bucket-level access to configure rock-solid access control policies and safeguard against accidental public exposures. 3. Encrypt your Cloud Storage data with Cloud KMSRegulations for data access and control are increasingly becoming more strict. For example, GDPR made many companies change the way they collect, store and process personal information. An important piece of this puzzle is encryption key management. Cloud KMS is a cloud-hosted key management service supported by Cloud Storage that lets you manage encryption keys for your cloud storage data. You can generate, use, rotate, and destroy AES256, RSA 2048, RSA 3072, RSA 4096, EC P256, and EC P384 cryptographic keys. This feature offers state-of-the-art encryption management and can help you with various regulations.4. Audit your Cloud Storage data with Cloud Audit LoggingCloud Audit Logs bring visibility into user activity and data access across Google Cloud, including Cloud Storage. Cloud Audit Logs reside in highly protected Cloud Storage, resulting in a secure, immutable, and highly durable audit trail. You can also use Operations (formerly Stackdriver) APIs for programmatic access and ingesting Cloud Storage audit logs into your threat detection analytics systems.5. Secure your data with VPC Service ControlsWith VPC Service Controls, you can configure security perimeters around the resources of your Cloud Storage service and control exfiltration of data across the perimeter boundary. For example, a VM within a VPC network that is part of the service perimeter can read from/write to a Cloud Storage bucket. Any attempt to access data from outside the perimeter will be denied. With your Cloud Storage buckets behind a VPC Service Control security perimeter, you have a private cloud-like security posture for your Cloud Storage data.To learn even more about Cloud Storage and ways to enhance data protection and security, check out the access control documentation and our presentation at Cloud Next ‘19.
Quelle: Google Cloud Platform

How to find—and use—your GKE logs with Cloud Logging

Logs are an important part of troubleshooting and it’s critical to have them when you need them. When it comes to logging, Google Kubernetes Engine (GKE) is integrated with Google Cloud’s Logging service. But perhaps you’ve never investigated your GKE logs, or Cloud Logging?  Here’s an overview of how logging works in GKE, and how to configure, find, and interact effectively with the GKE logs stored in Cloud Logging.How your GKE logs get to Cloud LoggingAny containerized code that is running in a GKE cluster—either your code or pre-packaged software—typically generates a variety of logs. These logs are usually written to standard output (‘stdout’) and standard error ‘stderr’, and include error, informational and debugging messages. When you set up a new GKE cluster in Google Cloud, system and app logs are enabled by default. A dedicated agent is automatically deployed and managed on the GKE node to collect logs, add helpful metadata about the container, pod and cluster and then send the logs to Cloud Logging. Both system logs and your app logs are then ingested and stored in Cloud Logging, with no additional configuration needed. Find your GKE logs in Cloud LoggingIn order to find these logs in the Cloud Logging service, all you need to do is filter your logs by GKE-related Kubernetes resources, by clicking this link, or by running the following query in the log viewer:  resource.type=(“k8s_container” OR “container” OR “k8s_cluster” OR “gke_cluster” OR “gke_nodepool” OR “k8s_node”)This query surfaces logs that are related to Kubernetes resources in GKE: clusters, nodes, pods and containers. Alternatively, you can access any of your workloads in your GKE cluster and click on the container logs links in your deployment, pod or container details; this also brings you directly to your logs in the Cloud Logging console.If no log entries return with your query, it’s time to look for reasons your logs aren’t being generated or collected into Cloud Logging.   Make sure you’re collecting GKE logsAs mentioned above, when you create a GKE cluster, system and app logs are set to be collected by default. You can update how you configure log collection either when you create the cluster or by updating the cluster configuration. If you don’t see any of your logs in Cloud Logging, check whether the GKE integration with Cloud Logging is properly enabled. Follow these instructions to check the status of your cluster’s configuration.If the GKE integration is not enabled, you can enable log collection for the cluster by editing the cluster in the Google Cloud Console, or by using the gcloud container clusters update command line.If you have already enabled the GKE integration with Cloud Logging and Cloud Monitoring and still don’t see any of your GKE logs, check whether your logs they’ve been excluded. Logging exclusions may have been added to exclude logs from ingestion into Cloud Logging either for all or specific GKE logs. Adjusting these exclusions allows you to ingest the GKE logs that you need into Cloud Logging. Beginning with GKE version 1.15.7, you can configure a GKE cluster to only capture system logs. If you have already enabled the GKE integration with Cloud Logging and Cloud Monitoring and only see system logs in Cloud Logging, check whether you have selected this option. To check whether application log collection is enabled or disabled, and to then enable app log collection, follow these instructions. Make your GKE logs more effectiveHaving structured logs can help you create more effective queries. With Cloud Logging, structuring your logs means it parses your JSON object which makes it easier to build queries for your application JSON messages. GKE automatically adds structure to its log messages if your logs contain JSON objects in the log message. As a developer, you can also add specific elements in your JSON object that Cloud Logging will automatically map to the corresponding fields when stored in Cloud Logging. This may be useful to set the severity, traceId or labels for your log messages.Using traces in conjunction with log messages is another common practice to monitor and maintain the health and performance of your app. Traces offer valuable context for every transaction in your application and thus make the troubleshooting effort significantly more effective, especially in distributed applications. If you use Cloud Trace (or any other tracing solution) to monitor distributed application tracing, another way to make your logs more useful is to include the trace id in the log message. With this connection, you can link to Cloud Trace directly from your log messages when you’re troubleshooting your app.Reduce your GKE log usage GKE produces both system and application logs. While useful, sometimes the volume of logs may be higher than you expected. For example, certain log messages generated by Kubernetes such as the kublet logs on the node can be quite chatty and repetitive. These logs can be useful if you’re operating a production cluster for troubleshooting purposes, but may not be as useful in a purely development environment. If you feel you have too many logs, you can use Logging exclusions along with a specific filter to exclude log messages that you may not use. But be thoughtful about excluding logs, since you often won’t need the logs until later when you are for troubleshooting a problem. Excluding some repetitive logs (or excluding a certain percentage of them) can reduce the noise. Kubernetes produces many different kinds of logs and Cloud Logging can help you to make sense of them. For more details about using Cloud Logging with your GKE apps, check out our blog post.
Quelle: Google Cloud Platform

Introducing cross-region replica for Cloud SQL

Being responsible for business continuity isn’t easy. You must consider a wide variety of failure scenarios, including the outage of a Google region. In the event of a regional outage, you want your application and database to quickly start serving your customers in another available region if a Google Cloud region fails.We’ve worked closely with Cloud SQL customers facing business continuity challenges to simplify the experience, and we are excited to launch Cloud SQL cross-region replication, which is available for MySQL and PostgreSQL database engines. What is a cross-region replica for Cloud SQL?Cross-region replica makes it easy to create a fully managed read replica in a different region than that of the primary instance. You can create a replica in any Google Cloud region.We’ve heard from Major League Baseball (MLB) that cross-region replicas have been useful. “We store all our important tracking information such as location of player, pitch velocity, and even the wind data on Cloud SQL for PostgreSQL,” says Greg Cain, MLB vice president, Baseball Data. We take great pride as the national pastime with millions of fans across the U.S., but we also have a large fanbase beyond that which spans all seven continents around the world. Our global audiences enjoy watching games at all times of day on MLB.com and our different consumer products. Cross-region replication was a very critical feature for us to implement to provide uninterrupted services to our fans.”Using Cloud SQL cross-region replicasWith cross-region replica, you can: Minimize recovery point objective (RPO): A cross-region replica is a copy of the primary that reflects changes to the primary instance in almost real time, so data loss is very small in the event of a Google Cloud region failure. Minimize recovery time objective (RTO): Cross-region replica maintains an online copy of your data in another region. In the event of Google Cloud region failure, a replica can be promoted within minutes.Make globally distributed applications faster: Read replicas are closer to their application in another region.Migrate data between regions: Use cross-region replicas to minimize downtime when moving data between regions.Simple and secure, by defaultCloud SQL cross-region replication reduces operational overhead and is fully integrated with Google Cloud’s Cloud SQL security and privacy features.Fully managed Easily set up, maintain, manage, and administer replicas in any region on Google Cloud.Google Cloud networkingCreating a cross-region replica requires no networking setup. Global VPC uses private IP for replication traffic between regions—eliminating the need of complex VPN and VPC configuration, which would be otherwise needed to set up cross-region networking.Cross-region replication traffic uses reliable, high-performing, and scalable Google Cloud networking.Network monitoring, verification, and optimization is simplified using proactive network operations with Network Intelligence Center.Cloud SQL security and privacy Data at rest in replicas is encrypted using customer-managed encryption keys (CMEK).Cross-region replication traffic remains private, without access to and from the public internet, when a private IP option is used.Cross-region replicas are supported as part of Access Transparency, which represents Google’s long-term commitment to security and transparency by providing you with logs that capture the actions Google personnel take when accessing your content. Connection org policy control provides centralized control of the public IP settings of Cloud SQL to reduce the security attack surface of Cloud SQL instances from the internet.Cloud SQL will enforce the data residency policy you define. Replicas can only be created in permitted regions.Getting started with cross-region replicaCreating a cross-region replica is as simple as creating a read replica.Get started with cross-region replication today.
Quelle: Google Cloud Platform

Introducing skill badges, certification preparation learning paths, and online proctored certification testing

Finding the right cloud talent and expertise is important for virtually all businesses today. Almost 70 percent of IT leaders report that hiring was somewhat or extremely difficult in 2019 and that finding qualified cloud computing talent was a top challenge. Our Google Cloud training allows you to build cloud skills while our certifications help organizations grow the expert cloud talent they need to effectively transform their business and help individuals elevate their IT careers with validated cloud skills. As thousands of technical professionals are looking for ways to stay productive and keep their skills current, we have seen a spike in demand for Google Cloud learning resources. In the month of April, enrollments in Google Cloud training on Coursera increased by more than 500% year-over-year. Google Cloud training completions more than doubled year-over-year across all platforms and partners. We’re committed to developing cloud professionals across all stages of their career as well as enabling enterprises who need cloud expertise to respond, adapt, and transform to dynamic market pressures. To help, we continue to grow our training and certification programs to empower both learners and employers.Today, we’re excited to announce three new initiatives. Firstly, we are introducing Google Cloud skill badges which will recognize and help employers identify those of you with demonstrated Google Cloud technology skills. For experienced professionals, we’ve created new six-week learning paths to guide you through the certification preparation journey. Lastly, in response to overwhelming market demand, we’ve made remote certification exams available, so you can take your exam from home. Show your growing cloud skillset with skill badges Demonstrate your growing Google Cloud-recognized skillset to employers and share your progress with your network through exclusive digital Google Cloud skill badges. The digital badges are earned through completing labs and a rigorous hands-on skill test on Qwiklabs. We’ve made Qwiklabs available at no cost for 30 days through the end of 2020, making hands-on practice and skill building accessible to anyone interested in starting a career in cloud. We have several skill badges available now for beginners, such as deploying and managing cloud environments and performing foundational data, machine learning and AI tasks. Get started with free access to Qwiklabs and skill badges here.Start your certification preparation journey These six-week learning paths will outline recommended Google Cloud training to help experienced cloud professionals prepare for either the Associate Cloud Engineer, Professional Data Engineer, or the Professional Cloud Architect certifications. Through our training partner, Pluralsight, the first month of training will be available at no cost as well as 30 days of unlimited Qwiklabs access at no cost. To start, choose either the Associate Cloud Engineer, Professional Data Engineer, or Professional Cloud Architect certification, and we’ll send you a dedicated learning path with relevant training offers. If you’d like to prepare for certifications not covered by the learning paths, you can check out our latest offers for training courses here. If you’re interested in mastering the ability to deploy applications, monitor operations, and manage enterprise solutions, the Associate Cloud Engineer learning path is for you. We recommend at least six months of hands on experience with Google Cloud before attempting the Associate Cloud Engineer exam. To earn the Professional Data Engineer certification, you have to prove your expertise in designing, building, operationalizing, securing, and monitoring data processing systems. We recommend you have three or more years of cloud industry experience and at least one year of experience designing and managing solutions using Google Cloud prior to preparing for this certification. The Google Cloud Professional Cloud Architect certification, which was ranked the highest-paying IT certification for the second year in a row in the US, is recommended for individuals with three or more years cloud industry experience, including at least one year of Google Cloud experience. The learning path for this certification will guide you through how to securely design, develop, and manage robust, scalable, highly available, and dynamic solutions to drive business objectives. Take your certification exam  We know many of you have already prepared and are ready to take your certification exams but are unable to do so because exam centers around the world are closed in response to COVID-19. To help, we’re making online proctored testing available for three of our exams; Associate Cloud Engineer, Professional Data Engineer, and Professional Cloud Architect. You can learn more about online proctored testing here and register for exams here. You can start earning your Google Cloud skill badges here. Already have some cloud experience and ready to begin your certification preparation journey? Sign up here to get started with your six-week learning plan.
Quelle: Google Cloud Platform

How Migrate for Anthos streamlines legacy Java app modernization

Recently, we’ve been highlighting all the ways that Anthos, our hybrid and multi-cloud application platform, can help you modernize your Java applications and development and delivery processes. This week we’ll focus on how Migrate for Anthos, which takes your existing VM-based applications and intelligently converts them to run in containers on Google Kubernetes Engine (GKE), can also help you move your legacy Java applications. Whether it’s to enable new functionality, decommission an on-premises data center, or to save on maintenance costs, many organizations are actively trying to modernize legacy Java applications—preferably by running them in containers on GKE and Anthos. Unfortunately, the way that some legacy applications acquire resource configuration and usage information is incompatible with standard-issue Kubernetes, and requires some complicated workarounds. To help with this, the most recent release of Migrate for Anthos has a new feature to help streamline and simplify legacy application migration, automatically augmenting container resource visibility for legacy Linux-based applications, such as those that use Oracle Java SE 7 and 8 (prior to update 191). This is crucial if you want to successfully convert your legacy Java applications into containers without having to upgrade or refactor them. Migrate for Anthos helps you successfully move Java applications into containers by transparently and automatically implementing a userspace filesystem that addresses the limitations of the Linux filesystem. As you probably know, Linux uses cgroups to enforce container resource allocations. However, a known issue when running in Kubernetes, is that the Kubernetes node’s procfs /proc file system is mounted by default in the container, and reflects host resources rather than those allocated to the container itself. And because some legacy applications still acquire resource configuration and usage information from files like meminfo and cpuinfo in the /proc directory, rather than from cgroups files, running those applications in a container can result in errors and instability. For example, older Java versions may use the information from meminfo and cpuinfo to determine how much memory to allocate to its JVM heap, how many threads to run in parallel for garbage collection (GC), etc. Running an older Java application in a container that hasn’t been properly configured can result in processes being killed due to out-of-memory errors, which can be difficult to triage and troubleshoot. For legacy applications for which you cannot upgrade Java versions, Migrate for Anthos takes a common approach used in the community: it implements the LXCFS filesystem. It does this without requiring user intervention, special configuration or application rebuild. Our goal is to help you migrate all your applications—not just the easy ones—quickly and effectively, so you can make progress on your modernization goals.The sample legacy Java web applicationLet’s take a look at the difference in behaviors of a legacy Java application migrated with and without Migrate for Anthos. For this test, we’re using a JBOSS 8.2.1 server using an older version of Oracle Java SE 7 update 80. You can download this version from Oracle’s Java SE 7 Archives. We package it in two ways: as a regular Docker container image, and as a server VM from which we have migrated the application to a container using Migrate for Anthos. For the application, we use a sample JBoss node-info application with some additional lines of code to simulate memory pressure for each request served. The following modifications were applied:src/main/java/pl/goldmann/work/helloworld/NodeInfoServlet.javaTesting the application on GKEWhen deploying the two application containers, we apply the following resource restrictions in the GKE Pod spec, allocating 1 vCPU and 1 GiB of RAM, on a GKE node that has 4 vCPU and 16 GiB of RAM:We then run the two application instances. First let’s check basic application output by directing a web browser to the application URL.Here’s what happens on the standard container:But here’s what happens on the Migrate for Anthos migrated container:You can immediately see a difference between the results. In the standard container, as already reported in many such tests, Java reports resource values from the host node, and not from the container resource allocations. In the standard container, the reported maximum heap size is derived from Java 7’s sizing algorithm, which, by default, is one quarter of the host’s physical memory. However, in this case of the Migrate for Anthos migrated container, the values are reported correctly.You can see a similar impact when querying the Java Garbage Collection (GC) threading plan. Connect to shell, and run:java -XX:+PrintFlagsFinal -version | grep ParallelGCThreadsOn the standard container, you get:   uintx ParallelGCThreads                         = 4               {product}But on the migrated workload container, you get:   uintx ParallelGCThreads                         = 0               {product}So here as well, you see the correct concurrency from the Migrate for Anthos container, but not in the standard container.Now let’s see the impact of these differences under load. We generate application load using Hey. For example, the following command generates application load for two minutes, with a request concurrency of 50: ./hey_linux_amd64 -z 2m http://##.###.###.###:8080/node-info/Here are the test results with the standard container:Status code distribution:  [200] 332 responses  [404] 8343 responsesError distribution:  [29]  Get http://##.###.###.###:8080/node-info/: EOF  [10116]       Get http://##.###.###.###:8080/node-info/: dial tcp ##.###.###.###:8080: connect: connection refused  [91]  Get http://##.###.###.###:8080/node-info/: net/http: request canceled while waiting for connection (Client.Timeout exceeded while awaiting headersThis is a clear indication that the service is not handling the load correctly, and indeed when inspecting the container logs, we see multiple occurrences of *** JBossAS process (79) received KILL signal ***This is due to an out-of-memory (OOM) error. The Kubernetes deployment took care of automatically restarting the OOM-killed container, during which time the service was unavailable. The reason for this is a miscalculated Java heap size from considering the host resources, instead of the container resource constraints. When not calculated right, Java tries to allocate more memory than available and therefore gets killed, disrupting the app.In contrast, executing the same load test on the container migrated with Migrate for Anthos results in:Status code distribution: [200] 1676 responses [202] 76 responsesThis indicates the application handled the load successfully even when memory pressure was high.Unlock the power of containers for your legacy appsWe showed how Migrate for Anthos automatically augments a known container resource visibility issue in Kubernetes. This helps ensure that  legacy applications that run on older Java versions behave correctly after being migrated, without having to manually tune or reconfigure them to fit dynamic constraints applied through the Kubernetes Pod specs. We also demonstrated how the legacy application remains stable and responsive under memory load, without experiencing errors or restarts. With this feature, Migrate for Anthos can help you harness the benefits of containerization and container orchestration with Kubernetes, to modernize your operations and management of legacy applications. You’ll be able to leverage the power of CI/CD with image-based management, non-disruptive rolling updates, and unified policy and application performance management across cloud native and legacy applications, without requiring access to source code or application rewrite. For more information, see our original release blog that outlines support for day-two operations and more or fill out this form for more info (please mention ‘Migrate for Anthos’ in the comment box).
Quelle: Google Cloud Platform

Performance tuning best practices for Memorystore for Redis

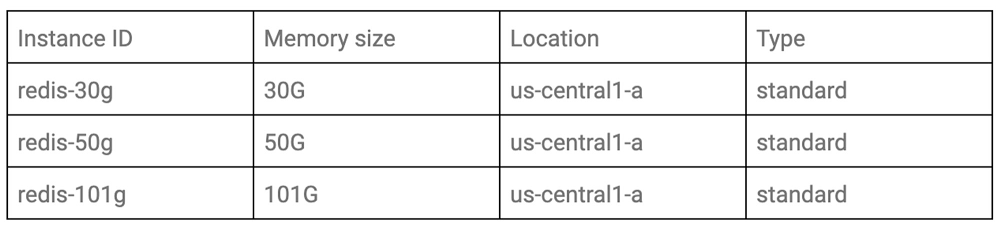
Redis is one of the most popular open source in-memory data stores, used as a database, cache and message broker. There are several deployment scenarios for running Redis on Google Cloud, with Memorystore for Redis our integrated option. Memorystore for Redis offers the benefits of Redis without the cost of managing it. It’s important to benchmark the system and tune it according to your particular workload characteristics before you expose it in production, even if that system depends on a managed service. Here, we’ll cover how you can measure the performance of Memorystore for Redis, as well as performance tuning best practices. Once you understand the factors that affect the performance of Memorystore for Redis and how to tune it properly, you can keep your applications stable.Benchmarking Cloud MemorystoreFirst, let’s look at how to measure the benchmark.Choose a benchmark toolThere are a few tools available to conduct benchmark testing for Memorystore for Redis. The tools listed below are some examples.Redis-benchmarkMemtier-benchmarkYCSBPerfKit BenchmarkIn this blog post, we’ll use YCSB, because it has a feature to control traffic and field patterns flexibly, and is well-maintained in the community. Analyze the traffic patterns of your applicationBefore configuring the benchmark tool, it’s important to understand what the traffic patterns look like in the real world. If you have been running the application to be tested on Memorystore for Redis already and have some metrics available, consider analyzing them first. If you are going to deploy a new application with Memorystore for Redis, you could conduct preliminary load testing against your application in a staging environment, with Cloud Monitoring enabled. To configure the benchmark tool, you’ll need this information:The number of fields in each recordThe number of recordsField length in each rowQuery patterns such as SET and GET ratioThroughput in normal and peak timesConfigure the benchmark tool based on the actual traffic patternsWhen conducting performance benchmarks for specific cases, it’s important to design the content of the benchmark by considering table data patterns, query patterns, and traffic patterns of the actual system.Here, we’ll assume the following requirements.The table has two fields per rowThe maximum length of a field is 1,000,000The maximum number of records is 100 millionQuery pattern of GET:SET is 7:3Usual traffic is 1k ops/sec and peak traffic is 20k ops/secYCSB can control the benchmark pattern with the configuration file. Here’s an example using these requirements. (Check out detailed information about each parameter.)The actual system contains various field lengths, but you can use only solid fieldlength with YCSB. So, configuring fieldlength=1,000,000 and recordcount=100,000,000 at the same time, the benchmark data size will be far from one of the actual systems.In that case, run the following two tests:The test in which fieldlength is the same as the actual system;The test in which recordcount is the same as the actual system.We will use the latter condition as an example for this blog post.Test patterns and architectureAfter preparing the configuration file, consider the test conditions, including test patterns and architecture.Test patternsIf you’d like to compare performance with instances under different conditions, you should define the target condition. In this blog post, we’ll test with the following three patterns of memory size according to capacity tier.ArchitectureYou need to create VMs to run the benchmark scripts. You should select a sufficient number and machine types so that VM resources don’t become a bottleneck when benchmarking. In this case, we’d like to measure the performance of Memorystore itself, so VMs should be in the same zone as the target Memorystore to minimize the effect of network latency. Here’s what that architecture looks like:Run the benchmark toolWith these decisions made, it’s time to run the benchmark tool. Runtime options to control the throughput patternYou can control the client throughput by using both operationcount parameter in the configuration file, and the -target <num> command line option.Here is an example of the execution command of YCSB:The parameter operationcount=3000 is in the configuration file and running the above command. This means that YCSB sends 10 requests per second, and the number of total requests is 3,000. So YCSB throws 10 requests during 300sec.You should run the benchmark with incremental throughput, as shown below. Note that a single benchmark run time should be somewhat longer in order to reduce the impact of outliers.: Client throughput patterns: 10, 100, 1,000, 10,000, 100,000Load benchmark dataBefore running the benchmark, you’ll need to load data to the Memorystore instance that you’re testing. Here is the example of a YCSB command for loading data:Run benchmarkNow that you have your data loaded and command chosen, you can run the benchmark test. Adjust the number of processes and instances to execute YCSB according to the load amount. In order to identify performance bottlenecks, you need to look at multiple metrics. Here are the typical indicators to investigate:LatencyYCSB outputs latency statistics such as average, min, max, 95th and 99th percentile for each operation such as READ(GET) and UPDATE(SET). We recommend using 95th percentile or 99th percentile for the latency metrics, according to customer service-level agreement (SLA).ThroughputYou can use throughput for overall operation, which YCSB outputs.Resource usage metricsYou can check resource usage metrics such as CPU utilization, memory usage, network bytes in/out, and cache-hit ratio using Cloud Monitoring.Performance tuning best practices for MemorystoreNow that you’ve run your benchmarks, you should tune your Memorystore using the benchmark results. Depending on your results, you may need to remove a bottleneck and improve performance of your Memorystore instance. Since Memorystore is a fully managed service, various parameters are optimized in advance, but there are still items that you can tune based on your particular use case.There are a few common areas of optimization: Data storing optimizationsMemory managementQuery optimizationsMonitoring MemorystoreData storing optimizationsOptimizing the way to store data not only saves memory usage, but also reduces I/O and network bandwidth.Compress dataCompressing data often results in significant savings in memory usage and network bandwidth.We recommend Snappy and LZO tools for latency-sensitive cases, and GZIP for maximum compression rate. Learn more details.JSON to MessagePackMsgpack and protocol buffers have schemas like JSON and are more compact than JSON. And Lua scripts has support for MessagePack.Use Hash data structureHash data structure can reduce memory usage. For example, suppose you have data stored by the query SET “date:20200501” “hoge”. If you have a lot of data that’s keyed by such consecutive dates, you may be able to reduce the memory usage that dictionary encoding requires by storing it as HSET “month:202005” “01” “hoge”. But note that it can cause high CPU utilization when the value of hash-map-ziplist-entries is too high. See here for more details.Keep instance size small enoughThe memory size of a Memorystore instance can be up to 300GB. However, data larger than 100GB may be too large for a single instance to handle, and performance may degrade due to a CPU bottleneck. In such cases, we recommend creating multiple instances with small amounts of memory, distributing them, and changing their access points using keys on the application side. Memory managementEffective use of memory is important not only in terms of performance tuning, but also in order to keep your Memorystore instance running stably without errors such as out of memory (OOM). There are a few techniques you can use to manage memory:Set eviction policiesEviction policies are rules to evict data when the Memorystore instance memory is full. You can increase the cache hit ratio by specifying these parameters appropriately. There are the following three groups of eviction policies:Noeviction: Returns an error if the memory limit has been reached when trying to insert more dataAllkeys-XXX: Evicts chosen data out of all keys. XXX is the algorithm name to select the data to be evicted.Volatile-XXX: evicts chosen data out of all keys with an “expire” field set. XXX is the algorithm name to select the data to be evicted.volatile-lru is the default for Memorystore. Change the algorithm of data selection for eviction and TTL of data. See here for more details.Memory defragmentationMemory fragmentation happens when the operating system allocates memory pages, which Redis cannot fully utilize after repeated write and delete operations. The accumulation of such pages can result in the system running out of memory and eventually causes the Redis server to crash.If your instances run Redis version 4.0 or higher, you can turn on activedefrag parameter for your instance. Active Defrag 2 has a smarter strategy and is part of Redis version 5.0. Note that this feature is a tradeoff with CPU usage. See here for more details.Upgrade Redis versionAs we mentioned above, activedefrag parameter is only available in Redis version 4.0 or later, and version 5.0 has a better strategy. In general, with the newer version of Redis, you can reap the benefits of performance optimization in many ways, not just in memory management. If your Redis version is 3.2, consider upgrading to 4.0 or higher.Query optimizationsSince query optimization can be performed on the client side and doesn’t involve any changes to the instance, it’s the easiest way to optimize an existing application that uses Memorystore.Note that the effect of query optimization cannot be checked with YCSB, so run your query in your environment and check the latency and throughput.Use pipelining and mget/msetWhen multiple queries are executed in succession, network traffic caused by round trips can become a latency bottleneck. In such cases, using pipelining or aggregated commands such as MSET/MGET is recommended.Avoid heavy commands on many elementsYou can monitor slow commands using slowlog command. SORT, LREM, and SUNION, which use many elements, can be computationally expensive. Check if there are problems with these slow commands, and if there are, consider reducing these operations.Monitoring Memorystore using Cloud MonitoringFinally, let’s discuss resource monitoring for predicting performance degradation of existing systems. You can monitor the resource status of Memorystore using Cloud Monitoring.Even when you benchmark Memorystore before deploying, the performance of Memorystore in production may degrade due to various influences such as system growth and changes of usage trends. In order to predict such performance degradation at an early stage, you can create a system that will alert you or scale the system automatically, when the state of the resource exceeds a certain threshold.If you would like to work with Google Cloud experts to tune your Memorystore performance, get in touch and learn more here.
Quelle: Google Cloud Platform

Google Cloud adds smart analytics frameworks for AI Platform Notebooks

Google Cloud is announcing the beta release of smart analytics frameworks for AI Platform Notebooks. Smart Analytics Frameworks  brings closer the model training and deployment offered by AI Platform with the ingestion, preprocessing, and exploration capabilities of our smart analytics platform. With smart analytics frameworks for AI Platform Notebooks, you can run petabyte-scale SQL queries with BigQuery, generate personalized Spark environments with Dataproc Hub, and develop interactive Apache Beam pipelines to launch on Dataflow, all from the same managed notebooks service that provides Google Cloud AI Platform.These new frameworks can help bridge the gap between cloud tools and bring a secure way to explore all kinds of data. Whether you’re sharing visualizations, presenting an analysis, or interacting with live code in more than 40 programming languages, the Jupyter notebook is the prevailing user interface for working with data. As data volumes grow and businesses aim to get more out of that data, there has been a rapid uptake in the types of data pipelines, data source availability, and plugins offered by these notebooks. While this proliferation of functionality has enabled data users to discover deep insights into the toughest business questions, the increased data analysis capabilities have been coupled with increased toil: Data engineering and data science teams spend too much time with library installations, piecing together integrations between different systems, and configuring infrastructure. At the same time, IT operators struggle to create enterprise standards and enforce data protections in these notebook environments.Our new smart analytics frameworks for AI Platform Notebooks powers Jupyter notebooks with our smart analytics suite of products, so data scientists and engineers can quickly tap into data without the integration burden that comes with unifying AI and data engineering systems. IT operators can also rest assured that notebook security is enforced through a single hub, whether the data workflow is pulling data from BigQuery, transforming data with Dataproc, or running an interactive Apache Beam pipeline. End-to-end support in AI Platform Notebooks allows the modern notebook interface to act as the trusted gateway to data in your organization. How to use the new frameworksTo get started with a smart analytics framework, go to the AI Platform Notebooks page in the Google Cloud Console. Select New Instance, then from the Data Analytics menu choose either Apache Beam or Dataproc Hub. The Apache Beam option will launch a VM that is pre-configured with an interactive environment for prototyping Apache Beam pipelines on Beam’s direct runner. The Dataproc Hub option will launch a VM running a customized JupyterHub instance that will spawn production-grade, isolated, autoscaling Apache Spark environments that can be pre-defined by administrators but personalized by each data user. All AI Notebooks Platform frameworks come pre-packaged with BigQuery libraries, making it easy to use BigQuery as your notebook’s data source. Apache Beam is an open source framework that unifies batch and streaming pipelines so that developers don’t need to manage two separate systems for their various data processing needs. The Apache Beam framework in AI Platforms Notebooks allows you to interactively develop your pipelines in Apache Beam, using a workflow that simplifies the path from prototyping to production. Developers can inspect their data transformations and perform analytics on intermediate data, then launch onto Dataflow, a fully managed data processing service that distributes your workload across a fleet of virtual machines with zero to little overhead. With the Apache Beam interactive framework, it is easier than ever for Python developers to get started with streaming analytics, and setting up your environment is a matter of just a few clicks. We’re excited to see what this innovative community will build once they start adopting Apache Beam in notebooks and launching Dataflow pipelines in production.In the past, companies have hit roadblocks along the cloud journey because it has been difficult to transition from the monolithic architecture patterns that are ingrained into Hadoop/Spark. Dataproc Hub makes it simple to modernize the inefficient multi-tenant clusters that were running on prem. With this new approach to Spark notebooks, you can provide users with an environment that data scientists can fully control and personalize in accordance with the security standards and data access policies of their company. The smart analytics frameworks for AI Notebooks Platform is a publicly available beta that you can use now. There is no charge for using any of the notebooks. You pay only for the cloud resources you use within the instance: BigQuery, Cloud Storage, Dataproc, or Compute Engine.Learn more and get started today.
Quelle: Google Cloud Platform