Comparing containerization methods: Buildpacks, Jib, and Dockerfile

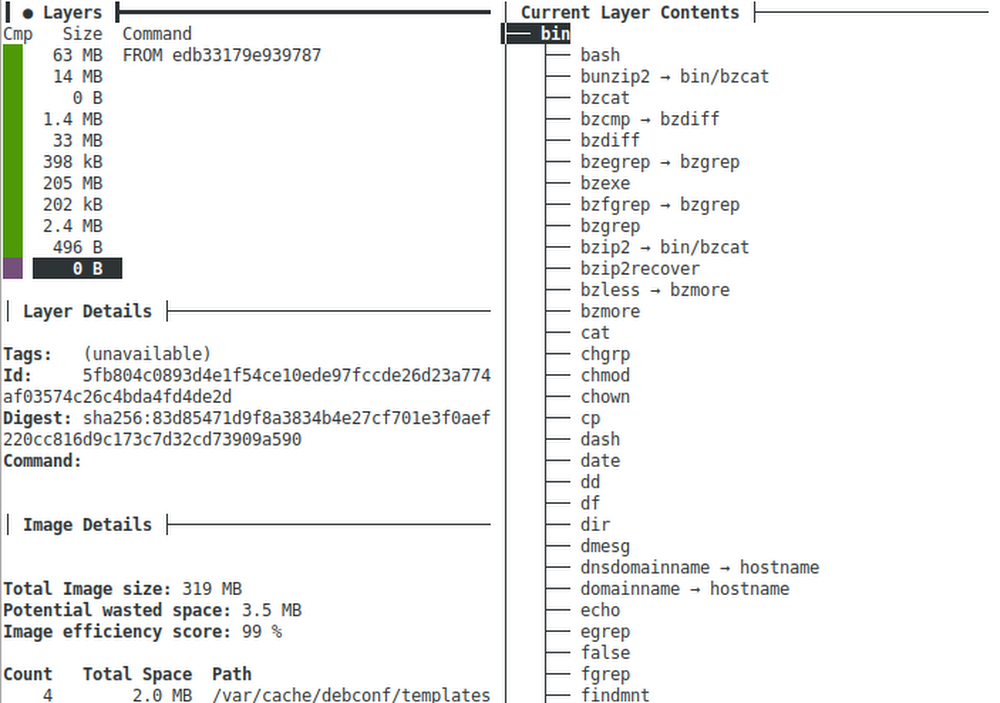
As developers we work on source code, but production systems don’t run source, they need a runnable thing. Starting many years ago, most enterprises were using Java EE (aka J2EE) and the runnable “thing” we would deploy to production was a “.jar”, “.war”, or “.ear” file. Those files consisted of the compiled Java classes and would run inside of a “container” running on the JVM. As long as your class files were compatible with the JVM and container, the app would just work.That all worked great until people started building non-JVM stuff: Ruby, Python, NodeJS, Go, etc. Now we needed another way to package up apps so they could be run on production systems. To do this we needed some kind of virtualization layer that would allow anything to be run. Heroku was one of the first to tackle this and they used a Linux virtualization system called “lxc” – short for Linux Containers. Running a “container” on lxc was half of the puzzle because still a “container” needed to be created from source code, so Heroku invented what they called “Buildpacks” to create a standard way to convert source into a container.A bit later a Heroku competitor named dotCloud was trying to tackle similar problems and went a different route which ultimately led to Docker, a standard way to create and run containers across platforms including Windows, Mac, Linux, Kubernetes, and Google Cloud Run. Ultimately the container specification behind Docker became a standard under the Open Container Initiative (OCI) and the virtualization layer switched from lxc to runc (also an OCI project).The traditional way to build a Docker container is built into the docker tool and uses a sequence of special instructions usually in a file named Dockerfile to compile the source code and assemble the “layers” of a container image.Yeah, this is confusing because we have all sorts of different “containers” and ways to run stuff in those containers. And there are also many ways to create the things that run in containers. The bit of history is important because it helps us categorize all of this into three parts:Container Builders – Turn source code into a Container ImageContainer Images – Archive files containing a “runnable” applicationContainers – Run Container ImagesWith Java EE those three categories map to technologies like:Container Builders == Ant or MavenContainer Images == .jar, .war, or .earContainers == JBoss, WebSphere, WebLogicWith Docker / OCI those three categories map to technologies like:Container Builders == Dockerfile, Buildpacks, or JibContainer Images == .tar files usually not dealt with directly but through a “container registry”Containers == Docker, Kubernetes, Cloud RunJava Sample ApplicationLet’s explore the Container Builder options further on a little Java server application. .  If you want to follow along, clone my comparing-docker-methods project:git clone https://github.com/jamesward/comparing-docker-methods.gitcd comparing-docker-methodsIn that project you’ll see a basic Java web server in src/main/java/com/google/WebApp.java that just responds with “hello, world” on a GET request to /. Here is the source:This project uses Maven with a minimal pom.xml build config file for compiling and running the Java server:If you want to run this locally make sure you have Java 8 installed and from the project root directory, run:./mvnw compile exec:javaYou can test the server by visiting: http://localhost:8080Container Builder: BuildpacksWe have an application that we can run locally so let’s get back to those Container Builders. Earlier you learned that Heroku invented Buildpacks to create standard, polyglot ways to go from source to a Container Image. When Docker / OCI Containers started gaining popularity Heroku and Pivotal worked together to make their Buildpacks work with Docker / OCI Containers. That work is now a sandbox Cloud Native Computing Foundation project: https://buildpacks.io/To use Buildpacks you will need to install Docker and the pack tool. Now from the command line tell Buildpacks to take your source and turn it into a Container Image:pack build –builder=gcr.io/buildpacks/builder:v1 comparing-docker-methods:buildpacksMagic! You didn’t have to do anything and the Buildpacks knew how to turn that Java application into a Container Image. It even works on Go, NodeJS, Python, and .Net apps out-of-the-box. So what just happened?  Buildpacks inspect your source and try to identify it as something it knows how to build. In the case of our sample application it noticed the pom.xml file and decided it knows how to build Maven-based applications. The –builder flag told it where to get the Buildpacks from. In this case, gcr.io/buildpacks/builder:v1 are the Container Image coordinates to Google Cloud’s Buildpacks. Alternatively you could use the Heroku or Paketo Buildpacks. The parameter comparing-docker-methods:buildpacks is the Container Image coordinates for where to store the output. In this case it stores on the local docker daemon. You can now run that Container Image locally with docker:docker run -it -ePORT=8080 -p8080:8080 comparing-docker-methods:buildpacksOf course you can also run that Container Image anywhere that runs Docker / OCI Containers like Kubernetes and Cloud Run.Buildpacks are nice because in many cases they just work and you don’t have to do anything special to turn your source into something runnable. But the resulting Container Images created from Buildpacks can be a bit bulky. Let’s use a tool called dive to examine what is in the created container image:dive comparing-docker-methods:buildpacksHere you can see the Container Image has 11 layers and a total image size of 319MB. With dive you can explore each layer and see what was changed. In this Container Image the first 6 layers are the base operating system. Layer 7 is the JVM and layer 8 is our compiled application. Layering enables great caching so if only layer 8 changes, then layers 1 through 7 do not need to be re-downloaded. One downside of Buildpacks is how (at least for now) all of the dependencies and compiled application code are stored in a single layer. It would be better to have separate layers for the dependencies and the compiled application.To recap, Buildpacks are the easy option that “just works” right out-of-the-box. But the Container Images are a bit large and not optimally layered.Container Builder: JibThe open source Jib project is a Java library for creating Container Images with Maven and Gradle plugins. To use it on a Maven project (like the one we from above), just add a build plugin to the pom.xml file:Now a Container Image can be created and stored in the local docker daemon by running:./mvnw compile jib:dockerBuild -Dimage=comparing-docker-methods:jibUsing dive we will see that the Container Image for this application is now only 127MB thanks to slimmer operating system and JVM layers. Also, on a Spring Boot application we can see how Jib layers the dependencies, resources, and compiled application for better caching:In this example the 18MB layer contains the runtime dependencies and the final layer contains the compiled application. Unlike with Buildpacks the original source code is not included in the Container Image. Jib also has a great feature where you can use it without docker being installed, as long as you store the Container Image on an external Container Registry (like DockerHub or the Google Cloud Container Registry). Jib is a great option with Maven and Gradle builds for Container Images that use the JVM.Container Builder: DockerfileThe traditional way to create Container Images is built into the docker tool and uses a sequence of instructions defined in a file usually named Dockerfile. Here is a Dockerfile you can use with the sample Java application:In this example, the first four instructions start with the AdoptOpenJDK 8 Container Image and build the source to a Jar file. The final Container Image is created from the AdoptOpenJDK 8 JRE Container Image and includes the created Jar file. You can run docker to create the Container Image using the Dockerfile instructions:docker build -t comparing-docker-methods:dockerfile Using dive we can see a pretty slim Container Image at 209MB:With a Dockerfile we have full control over the layering and base images. For example, we could use the Distroless Java base image to trim down the Container Image even further. This method of creating Container Images provides a lot of flexibility but we do have to write and maintain the instructions.With this flexibility we can do some cool stuff. For example, we can use GraalVM to create a “native image” of our application. This is an ahead-of-time compiled binary which can reduce startup time, reduce memory usage, and alleviate the need for a JVM in the Container Image. And we can go even further and create a statically linked native image which includes everything needed to run so that even an operating system is not needed in the Container Image. Here is the Dockerfile to do that:You will see there is a bit of setup needed to support static native images. After that setup the Jar is compiled like before with Maven. Then the native-image tool creates the binary from the Jar. The FROM scratch instruction means the final container image will start with an empty one. The statically linked binary created by native-image is then copied into the empty container.Like before you can use docker to build the Container Image:docker build -t comparing-docker-methods:graalvm .Using dive we can see the final Container Image is only 11MB!And it starts up super fast because we don’t need the JVM, OS, etc. Of course GraalVM is not always a great option as there are some challenges like dealing with reflection and debugging. You can read more about this in my blog, GraalVM Native Image Tips & Tricks.This example does capture the flexibility of the Dockerfile method and the ability to do anything you need. It is a great escape hatch when you need one.Which Method Should You Choose?The easiest, polyglot method: BuildpacksGreat layering for JVM apps: JibThe escape hatch for when those methods don’t fit: DockerfileCheck out my comparing-docker-methods project to explore these methods as well as the mentioned Spring Boot + Jib example.Related ArticleAnnouncing Google Cloud buildpacks—container images made easyGoogle Cloud buildpacks make it much easier and faster to build applications on top of containers.Read Article
Quelle: Google Cloud Platform

How one telecom reimagined IT to better serve customers with more personalized content

Telecommunications providers are under a lot of pressure. Customers increasingly expect one provider to meet all their telephony, digital entertainment, and broadband needs. And as the choice of providers increases and switching costs decrease, it’s harder than ever to create and maintain loyalty. At UPC Polska, we know this challenge all too well. As a leading telecommunications provider in Poland, we serve 1.5 million of customers with 3 million services each day, via an IT infrastructure built over the past 20 years. While we still run several business critical applications on premises, it also became increasingly clear to us that we could not develop, test, and deploy new features fast enough in our existing environment. As a result, we came to a stark realization: we had to transform our IT infrastructure to accelerate our feature release process, or risk losing customers. After considering several options, we selectedGoogle Cloud’s Anthos because it offered a uniform management experience across our hybrid environment and easy application modernization. We wanted to implement Anthos as soon as possible, but also knew we needed an experienced global systems integrator to help us do so securely and effectively. As a result, we turned to Accenture who helped us complete the project in just six weeks.Blending cultural and technology transformationOur customer service application allows us to build highly personalized relationships with over a million customers. Since rapid feature releases are critical to our commercial success, that application was one of the first targets for modernization with Anthos. Accenture came in, worked hard to understand our architecture, and provided the cloud-first strategy and assurance we needed to confidently migrate the app to the new hybrid environment. With the support of Google Cloud and Accenture, our team embraced the shift in management and development models from Waterfall to Agile. Although this was a difficult transition due to significant technological and infrastructure shifts and changes in processes, responsibilities, and ways of working, it ultimately increased speed-to-market on new features .To help ensure success for our DevOps team with this new approach, we deployed Anthos in our on-premises data centers. With Anthos, we can uniformly set policy at scale and continuously release features without worrying about security, vulnerability management or downtime across different environments. Our developers can then focus on writing better code, while operators use Anthos to effectively manage and run those applications anywhere. Accenture further drove the cloud-first DevOps culture shift we needed to make this all work, through training and support that quickly got our staff up to speed.The biggest advantage of working with Google Cloud and Accenture to deploy Anthos has been increased engagement among our staff. Teams are working passionately to achieve as much as possible because they can now focus on their core responsibilities rather than infrastructure management. Anthos helps us control which workloads, features, and data go into the cloud, and which are better suited for our on-premises infrastructure. Anyone working on this project today at UPC Polska would tell you that Anthos gives us the best of both worlds—the agility and speed of the cloud along with the power and comfort of still being able to use our traditional on-premises infrastructure.With the incredible collaboration between our team, Accenture, and Google Cloud, we have the development, testing, and production clusters we need integrated into our Agile development process. Now, both developers and operators enjoy increased scalability, stronger system resiliency, and more knowledge about containers.Making efforts countEverything we have done with Accenture and Google Cloud is driven by our commitment to creating, delivering, and improving the quality of services we offer to our 1.5 million customers. Personalization at that scale can be challenging, even with all the right technologies and DevOps strategies in place. Luckily, we have an impressive team and plenty of support through Google Cloud and Accenture. With our IT infrastructure and culture working together as part of a more Agile model powered by Anthos, the sky’s the limit for our personalization efforts, which frees us to dream up more ways to serve our customers. For example, we’re exploring projects like Software Defined Access Networks, cloud-based CRM, more personalized customer experiences, smart home technology, integrations between mobile and fixed networks, and an ever-growing portfolio of content and services. As we enter this new and fast-paced time in UPC Polska’s history, we look forward to working with Accenture and Google Cloud to better serve our customers.Read the full case study to learn more about how UPC partnered with Google Cloud and Accenture on this project.
Quelle: Google Cloud Platform

What you can learn in our Q4 2020 Google Cloud Security Talks

2020 has brought with it some tremendous innovations in the area of cloud security. As cloud deployments and technologies have become an even more central part of organizations’ security program, we hope you’ll join us for the latest installment of our Google Cloud Security Talks, a live online event on November 18th, where we’ll help you navigate the latest thinking in cloud security.We’ll share expert insights into our security ecosystem and cover the following topicsSunil Potti and Rob Sadowski will open the digital event with our latest Google Cloud security announcements.This will be followed by a panel discussion with Dave Hannigan and Jeanette Manfra from Google Cloud’s Office of the CISO on how cloud migration is a unique opportunity to dismantle the legacy security debt of the past two decades.Kelly Waldher and Karthik Lakshminarayan will talk about the new Google Workspace and how it can enable users to access data safely and securely while preserving individual trust and privacy.We will present our vision of network security in the cloud with Shailesh Shukla and Peter Blum, where we’ll talk about the recent innovations that are making network security in the cloud powerful but invisible, protecting infrastructure and users from cyber attacks. Sam Lugani and Ibrahim Damlaj will do a deeper dive on Confidential Computing, and more specifically Confidential GKE Nodes and how they can add another layer of protection for containerized workloads.You will also learn how Security Command Center can help you identify misconfigurations in your virtual machines, containers, network, storage, and identity and access management policies as well vulnerabilities in your web applications, with Kathryn Shih and Timothy Peacock.Anton Chuvakin and Seth Vargo will talk about the differences between key management and secret management to help you choose the best security controls for your use cases.Finally, we will host the Google Cloud Security Showcase, a special segment where we’ll focus on a few security problems and show how we’ve recently helped customers solve them using the tools and products that Google Cloud provides. We look forward to sharing our latest security insights and solutions with you. Sign-up now to reserve your virtual seat.
Quelle: Google Cloud Platform

Stateful serverless on Google Cloud with Cloudstate and Akka Serverless

In recent years, stateless middle-tiers have been touted as a simple way to achieve horizontal scalability. But the rise of microservices has pushed the limits of the stateless architectural pattern, causing developers to look for alternatives.Stateless middle-tiers have been a preferred architectural pattern because they helped with horizontal scaling by alleviating the need for server affinity (aka sticky sessions). Server affinity made it easy to hold data in the middle-tier for low-latency access and easy cache invalidation. The stateless model pushed all “state” out of the middle-tier into backing data stores. In reality the stateless pattern just moved complexity and bottlenecks to that backing data tier. The growth of microservice architectures exacerbated the problem by putting more pressure on the middle tier, since technically, microservices should only talk to other services and not share data tiers. All manners of bailing wire and duct tape have been employed to overcome the challenges introduced by these patterns. New patterns are now emerging which fundamentally change how we compose a system from many services running on many machines.To take an example, imagine you have a fraud detection system. Traditionally the transactions would be stored in a gigantic database and the only way to perform some analysis on the data would be to periodically query the database, pull the necessary records into an application, and perform the analysis. But these systems do not partition or scale easily. Also, they lack the ability for real-time analysis. So architectures shifted to more of an event-driven approach where transactions were put onto a bus where a scalable fleet of event-consuming nodes could pull them off. This approach makes partitioning easier, but it still relies on gigantic databases that received a lot of queries. Thus, event-driven architectures often ran into challenges with multiple systems consuming the same events but at different rates.Another (we think better) approach, is to build an event-driven system that co-locates partitioned data in the application tier, while backing the event log in a durable external store. To take our fraud detection example, this means a consumer can receive transactions for a given customer, keep those transactions in memory for as long as needed, and perform real-time analysis without having to perform an external query. Each consumer instance receives a subset of commands (i.e., add a transaction) and maintains its own “query” / projection of the accumulated state. For instance:By separating commands and queries we can easily achieve end-to-end horizontal scaling, fault tolerance, and microservice decoupling. And with the data being partitioned in the application tier we can easily scale that tier up and down based on the number of events or size of data, achieving serverless operations. Making it work with CloudstateThis architecture is not entirely uncommon, going by the names Event Sourcing, Command Query Response Segregation (CQRS), and Conflict-Free Replicated Data Types. (Note: for a great overview of this see a presentation titled “Cloudstate – Towards Stateful Serverless” by Jonas Bonér.) But until now, it’s been pretty cumbersome to build systems with these architectures due to primitive programming and operational models. The new Cloudstate open-source project attempts to change that by building more approachable programming and operational models.Cloudstate’s programming model is built on top of protocol buffers (protobufs) which enable evolvable data schemas and generated service interaction stubs. When it comes to data schemas, protobufs allow you to add fields to event / message objects without breaking systems that are still using older versions of those objects. Likewise, with the gRPC project, protobufs can be automatically wrapped with client and server “stubs” so that no code needs to be written for handling protobuf-based network communication. For example, in the fraud detection system, the protobuf might be:The `Transaction` message contains the details about a transaction and the `user_id` field enables automatic sharding of data based on the user.Cloudstate adds support for event sourcing on top of this foundation so developers can focus on just the commands and accumulated state that a given component needs. For our fraud detection example, we can simply define a class / entity to hold the distributed state and handle each new transaction. You can use any language, but we use Kotlin, a Google-sponsored language that extends Java.With the exception of a tiny bit of bootstrapping code, that’s all you need to build an event-sourced system with Cloudstate!The operational model is also just as delightful since it is built on Kubernetes and Knative. First you need to containerize the service. For JVM-based builds (Maven, Gradle, etc.) you can do this with Jib. In our example we use Gradle and can just run:This creates a container image for the service and stores it on the Google Container Registry. To run the Cloudstate service on your own Kubernetes / Google Kubernetes Engine (GKE) cluster, you can use the Cloudstate operator and a deployment descriptor such as:There you have it—a scalable, distributed event-sourced service! And if you’d rather not manage your own Kubernetes cluster, then you can also run your Cloudstate service in the Akka Serverless managed environment, provided by Lightbend, the company behind Cloudstate.To deploy the Cloudstate service on Lightbend Cloudstate simply run:It’s that easy! Here is a video that walks through the full fraud detection sample:You can find the source for the sample on GitHub: github.com/jamesward/cloudstate-sample-fraudAkka Serverless under the hoodAs an added bonus, Akka Serverless itself is built on Google Cloud. To deliver this stateful serverless cloud service on Google Cloud, Cloudstate needs a distributed durable store for messages. With the open-source Cloudstate you can use PostgreSQL or Apache Cassandra. The managed Akka Serverless service is built on Google Cloud Spanner due to its global scale and high throughput. Lightbend also chose to build their workload execution on GKE to take advantage of its autoscaling and security features.Together, Lightbend and Google Cloud have many shared customers who have built modern, resilient, and scalable systems with Lightbend’s open source and Google’s Cloud services. So we are excited that Cloudstate brings together Lightbend and Google Cloud and we look forward to seeing what you will build with it! To get started check out the Open Source Cloudstate project and Lightbend’s Akka Serverless managed cloud service.
Quelle: Google Cloud Platform

Preparing Google Cloud deployments for Docker Hub pull request limits

Docker Hub is a popular registry for hosting public container images. Earlier this summer, Docker announced it will begin rate-limiting the number of pull requests to the service by “Free Plan” users. For pull requests by anonymous users this limit is now 100 pull requests per 6 hours; authenticated users have a limit of 200 pull requests per 6 hours. When the new rate limits take effect on November 1st, they might disrupt your automated build and deployment processes on Cloud Build or how you deploy artifacts to Google Kubernetes Engine (GKE), Cloud Run or App Engine Flex from Docker Hub. This situation is made more challenging because, in many cases, you may not be aware that a Google Cloud service you are using is pulling images from Docker Hub. For example, if your Dockerfile has a statement like “FROM debian:latest”or your Kubernetes Deployment manifest has a statement like “image: postgres:latest” it is pulling the image directly from Docker Hub. To help you identify these cases, Google Cloud has prepared a guide with instructions on how to scan your codebase and workloads for container image dependencies from third-party container registries, like Docker Hub.We are committed to helping you run highly reliable workloads and automation processes. In the rest of the blog post, we’ll discuss how these new Docker Hub pull rate limits may affect your deployments running on various Google Cloud services, and strategies for mitigating against any potential impact. Be sure to check back often, as we will update this post regularly. Impact on Kubernetes and GKEOne of the groups that may see the most impact from these Docker Hub changes is users of managed container services. Like it does for other managed Kubernetes platforms, Docker Hub treats GKE as an anonymous user by default. This means that unless you are specifying Docker Hub credentials in your configuration, your cluster is subject to the new throttling of 100 image pulls per six hours, per IP. And many Kubernetes deployments on GKE use public images. In fact, any container name that doesn’t have a container registry prefix such as gcr.io is pulled from Docker Hub. Examples include nginx, and redis.Container Registry hosts a cache of the most requested Docker Hub images from Google Cloud, and GKE is configured to use this cache by default. This means that the majority of image pulls by GKE workloads should not be affected by Docker Hub’s new rate limits. Furthermore, to remove any chance that your images would not be in the cache in the future, we recommend that you migrate your dependencies into Container Registry, so that you can pull all your images from a registry under your control.In the interim, to verify whether or not you are affected, you can generate a list of DockerHub images your cluster consumes:You may want to know if the images you use are in the cache. The cache will change frequently but you can check for current images via a simple command:It is impractical to predict cache hit-rates, especially in times where usage will likely change dramatically. However, we are increasing cache retention times to ensure that most images that are in the cache stay in the cache.GKE nodes also have their own local disk cache, so when reviewing your usage of DockerHub, you only need to count the number of unique image pulls (of images not in our cache) made from GKE nodes: For private clusters, consider the total number of such image pulls across your cluster (as all image pulls will be routed via a single NAT gateway). For public clusters you have a bit of extra breathing room, as you only need to consider the number of unique image pulls on a per-node basis. For public nodes, you would need to churn through more than 100 unique public uncached images every 6 hours to be impacted, which is fairly uncommon.If you determine that your cluster may be  impacted, you can authenticate to DockerHub by adding imagePullSecrets with your Docker Hub credentials to every Pod that references a container image on Docker Hub.While GKE is one of the Google Cloud services that may see an impact from the Docker Hub rate limits, any service that relies on container images may be affected, including similar Cloud Build, Cloud Run, App Engine, etc.Finding the right path forward Upgrade to a paid Docker Hub accountArguably, the simplest—but most expensive—solution to Docker Hub’s new rate limits is to upgrade to a paid Docker Hub account. If you choose to do that and you use Cloud Build, Cloud Run on Anthos, or GKE, you can configure the runtime to pull with your credentials. Below are instructions for how to configure each of these services:Cloud Build: Interacting with Docker Hub imagesCloud Run on Anthos: Deploying private container images from other container registriesGoogle Kubernetes Engine: Pull an Image from a Private RegistrySwitch to Container RegistryAnother way to avoid this issue is to move any container artifacts you use from Docker Hub to Container Registry. Container Registry stores images as Google Cloud Storage objects, allowing you to incorporate container image management as part of your overall Google Cloud environment. More to the point, opting for a private image repository for your organization puts you in control of your software delivery destiny. To help you migrate, the above-mentioned guide also provides instructions on how to copy your container image dependencies from Docker Hub and other third-party container image registries to Container Registry. Please note that these instructions are not exhaustive—you will have to adjust them based on the structure of your codebase.Additionally, you can use Managed Base Images, which are automatically patched by Google for security vulnerabilities, using the most recent patches available from the project upstream (for example, GitHub). These images are available in the GCP Marketplace.Here to help you weather the changeThe new rate limits on Docker Hub pull requests will have a swift and significant impact on how organizations build and deploy container-based applications. In partnership with the Open Container Initiative (OCI), a community devoted to open industry standards around container formats and runtimes, we are committed to ensuring that you weather this change as painlessly as possible.
Quelle: Google Cloud Platform

IKEA: Creating a more affordable, accessible and sustainable future with help from the cloud

Editor’s note: Today we hear from Barbara Martin Coppola, Chief Digital Officer at IKEA Retail (Ingka Group). Barbara chats about how cloud technologies helped IKEA respond to COVID-19, and what new connected customer experiences lie ahead.A better home creates a better lifeWe are here to create a better everyday life for many people with big dreams, big needs and thin wallets. Today’s life at home is more important than ever, not only to accommodate people’s basic needs, but also to make space for home offices, remote education and multi-purpose entertainment and exercise environments.People are looking for products and services that offer value for money, that are convenient and easily available. Consumers are increasingly connecting with brands and companies that are making a positive impact and contributing to the environment. Life at home has never been as important as it is today, and IKEA is determined to create a more affordable, accessible and sustainable future for all.It goes without saying that the pandemic has affected societies and communities at large. During these times, people are looking for different ways to shop and have their items delivered. Online shopping has reached new heights, with experienced online shoppers buying more than ever before and new shoppers entering the online space for the very first time. During lockdowns, many of our IKEA stores catered to customers online only, leading to increased levels of growth in e-commerce and an acceleration of our digital transformation. Things that would normally take years or months were accomplished within weeks and days.An adaptation strategy was important for our business whilst undergoing this period of change. We transformed our current technology infrastructure, converted our closed stores into fulfilment centers and enabled contactless Click & Collect services whilst increasing the capacity to manage large web traffic volumes and online orders. By using Google Cloud, among other key serverless technologies, we were able to instantly scale our business globally, on the web and in our stores.With the use of technology, we focused on taking care of co-workers as our first priority. We modified ways of working and engineered a solution where IKEA staff could borrow equipment online for a home office environment set-up. We empowered employees with data and digital tools, automating routine tasks, building advanced algorithms to solve complex problems, placing more modern technology in stores and designing additional self-serve tools. Through cloud technology we trained our data models to assist our co-workers, creating more efficient picking routes, which in turn enriched our customer experience.During this time, we have also committed to accelerating our investments towards a sustainable business. We will invest EUR 600 million into companies, solutions and our own operations to enable the transition to a net-zero carbon economy. As part of that journey, our goal is to use digital tools to help enable circularity across our value chain. We believe that doing good business is good business—both for us and for our planet.Fulfilling customer needs for the future With a growth mindset, we’ll continue to listen, learn and adapt our business to meet our customers where they are. We want to create an experience unlike any other, with the uniqueness of IKEA at the core. We are currently working on better fulfilling customer needs using recommendations through AI, chatbots for simpler and better customer service and 3D visualization design tools to picture furniture in photo realistic rooms. We want to show that IKEA can truly touch every customer around the globe with home furnishing products that provide an unforgettable everyday life at home experience. To learn more, please tune into my fireside discussion with Eva Fors, Managing Director, Nordics, Google Cloud, about innovation, accelerating omni-channel capabilities, diversity and inclusion, and more. Ingka Group recently acquired Geomagical Labs, a spatial computing company, developing mixed reality (real + virtual) experiences to support consumer needs. Using an ordinary smartphone, consumers will be able to quickly capture their spaces and virtually play with IKEA products in their rooms before purchasing them. Discover more here. The IKEA logo and the IKEA wordmark are registered trademarks of Inter IKEA Systems B.V.
Quelle: Google Cloud Platform

MLB uses Google Cloud Smart Analytics platform to scale data insights

Though 2020 has been a year like no other, many sports fans can take comfort in the fact that one of America’s fall traditions has continued: the World Series, baseball’s annual championship consumed by millions. This year, the Los Angeles Dodgers and Tampa Bay Rays have split the first two games, setting us up for an exciting three days of baseball beginning Friday night.In the first season of a multi-season partnership to drive innovation and fan engagement around baseball, Google Cloud and Major League Baseball (MLB) have collaborated to build a technical foundation in the midst of responding to numerous challenges presented by the COVID-19 pandemic. From a data perspective, one key piece of that foundation is Statcast, the league’s in-park data capture system that allows for collection and analysis of a massive amount of baseball data that’s not only changing the way games are viewed but also how and why decisions are made.This post focuses on how Google Cloud is helping MLB use the data from Statcast to derive insights that enable MLB broadcasters and content generators to determine relevant storylines and add richer context to games. As nearly every sport becomes increasingly data-driven, with baseball at the forefront (as it has been for decades), the ability to democratize access to analytics and insights like these for players, coaches, front-office decision makers, media, and fans will be critical to the future of sports.Going beyond sports, the technical workflow described here could be helpful to any business looking to scale up its processes for turning data into insights and improve its data-driven decision making. Across industries, there is tremendous upside to generating objective measurements, turning them into timely, contextual, succinct bits of valuable information, and doing so with vastly improved efficiency relying on automation.MLB Game NotesA “game note” can be thought of as a statistical insight related to players and teams involved in a particular matchup. Per MLB, more than two-thirds of broadcasters sometimes or often use game notes when preparing for a telecast. In addition, statistically-driven notes like these help clubs, digital media, writers, and researchers discover or support various storylines involving teams and players throughout the season.Below is a typical game note and accompanying table that the MLB content team prepared in advance of the World Series, highlighting how the Rays’ Randy Arozarena and two Dodgers players all ranked among the MLB Postseason leaders in “hard-hit balls” – i.e., the number of balls hit with an exit velocity above 95 miles per hour.Randy Arozarena leads all players with 26 hard-hit balls this postseason, with Corey Seager and Mookie Betts also ranking in the top 5.Most hard-hit balls, 2020 postseason1. Randy Arozarena (TB): 262-T. Corey Seager (LAD): 232-T. Freddie Freeman (ATL): 232-T. Michael Brantley (HOU): 235. Mookie Betts (LAD): 22Hard-hit: 95+ mph exit velocityBaseball fans know that Arozarena, Seager, and Betts have been crushing the ball the last few weeks. Statcast data helps quantify that (by measuring speed off the bat on every batted ball), and the note adds the context that they’ve done so with higher frequency than almost anyone else over the course of the playoffs.Traditionally, the league’s content researchers create interesting game notes manually, using baseball knowledge and flexible tools like Baseball Savant to look up leaderboards and trends. The time- and resource-intensive nature of this manual process limits the number and specificity of notes for each day, which can leave several games and teams uncovered during a typical regular season (30 teams playing 162 games each over six months).Taking a step back and looking at many of these notes, there are some repeatable patterns that are ripe for automation. For example, many notes highlight teams or players that rank in the top or bottom five across MLB in a particular statistic of interest (like the example above). With an automated process, we could more easily create similar leaderboards for many different stats and look across multiple historical time spans (e.g. this past regular season, the entire Statcast era, etc.). This provided motivation for our work to generate “automated” game notes, vastly increasing the scale and speed at which such notes are created on a daily basis.Data IngestionIn the Statcast world, baseball data generation begins when the players take the field. Optical tracking sensors provided by Hawk-Eye Innovations transmit player and ball motion data from each ballpark to the MLB PostgreSQL database hosted in Google Cloud. Over the six-year history of Statcast, the MLB Technology team has created dozens of derived metrics from this data, and makes event-level (pitch-by-pitch) data and associated metrics accessible to partners and clubs via the Stats API application (see here for more details.)In order to set up for large-scale data processing across several metrics for all teams and players across multiple time spans, we set up an ingestion process to store off event-level Statcast data from the MLB Stats API in relational database-style tables. MLB data for every game event over the last six seasons was read in and processed by Cloud Dataflow, Google Cloud’s fully managed, serverless, stream and batch data processing service, and stored in BigQuery, Google Cloud’s serverless, petabyte-scale data warehouse.Dataflow provided a platform where we could design a single job (see details in image below) that would both backfill the six seasons of data needed as well as pull in new data from each individual game as the 2020 MLB season progressed. When we needed to backfill, we scaled up to hundreds of machines processing almost 2.5TB of data in around 150 hours of vCPU processing time, taking 30 minutes of wall clock time. When we needed to pull in only two League Championship Series games, this could be done on a single machine in a matter of minutes.Click to enlargeThe result of this process was a number of tables in BigQuery containing all historical Statcast data, updated each day during the MLB season. In addition to a single table with millions of rows and dozens of columns with Statcast data on each event, BigQuery tables involved in game note generation include team schedules, rosters, and probable starters, among others.The daily orchestration of this data ingestion process was handled by Cloud Composer, Google’s fully managed workflow orchestration service built on Apache Airflow. Airflow is an open source platform used to programmatically build, schedule and monitor individual workflows. Once we had scripted a DAG (a collection of tasks to be run – one of Airflow’s core concepts), we could test it, run it, monitor performance and start debugging all in the Airflow UI, hosted by Cloud Composer. In the case of our daily ingest of MLB data, we have a 12-step process (see details in image below) that starts with pulling raw data from MLB API endpoints and finishes with notes like the example above.Click to enlargeUsing BigQuery to go from data to insightsWith data stored and updating in BigQuery, our next step was to turn that data into text-based insights that could form game notes. We could’ve created a large number of unique SQL queries that generate various stat leaderboards for use in game notes – e.g. one query for teams with the most hard-hit balls this regular season, one for pitchers with the highest average fastball velocity in the postseason, and so on. While that would work, we scaled up more robustly by making some generalizations across how many of these “stat leaderboard”-type notes are created, and by using some more advanced BigQuery features to reduce the amount of code complexity and redundancy required.Most statistics leaderboards used here can be thought of as compositions of a few elements:A statistic of interest, e.g. number of hard-hit balls or average fastball velocityA time span that the leaderboard covers, e.g. last 2 regular seasons or this postseasonAn “entity” of interest, usually either teams or playersA “facet” of the game, representing which “side” of the ball to calculate certain stats for, e.g. hitting or pitchingA ranking qualification criteria, which represents a minimum # of opportunities for a stat to be reasonable for ranking (mostly used for player “rate” stats where a small denominator can lead to outlier results, like a .700 batting average over 10 at-bats).Each of these composable elements can be separated out as different “ingredients” to be used in various combinations to generate leaderboards. We created a single BigQuery view for each time span of, filtering the Statcast events table by date and game type. Each stat has several pieces of info related to its calculation (numerator, denominator) and display (various names and abbreviations, decimals, etc.) stored in a few “support” tables. Another key table lays out the elements to compose for each leaderboard – one stat, one span, whether to aggregate by teams or players, from the hitting or pitching perspective, and with what qualifying stat.Our workhorse to process various combinations of those elements in a repeatable way is BigQuery’s scripting capability, which allowed us to chain together multiple SQL statements in one request, using variables and control statements. Stored procedures allow BigQuery statements in scripts to be modularized into separate pieces, as is often done in functional programming. BigQuery’s Dynamic SQL capabilities, which enable using SQL code to write SQL text to be subsequently executed by BigQuery, increase the scope of what can be done within those stored procedures.Without these BigQuery features, we would’ve likely had to create the SQL text and call it from outside of BigQuery, in a language like Python or R. Doing so in the BigQuery environment itself eliminates the potential need to move data or business logic outside the warehouse, and increases code simplicity and consistency for those comfortable with using SQL.We implemented a substantial amount of business logic in BigQuery to run hundreds of SQL statements to create more than 100 “parallel” stat leaderboards, add rankings (raw and percentile), and determine which players or teams deserve notes for each stat (usually, those at the extreme ends of a ranking). Another series of SQL manipulations turns individual leaderboard fields into the more actual text of a note – e.g. name “Randy Arozarena,” rank “1”, stat name “Hard-Hit Balls,” span “2020 Postseason,” entity type “Player,” and value “26” get combined into “Randy Arozarena ranks 1st in the 2020 postseason with 26 hard-hit balls (balls hit with 95+ mph exit velocity).”Next, we add current team and player context to each note. The table accompanying certain notes uses BigQuery’s arrays in subqueries to filter each underlying leaderboard down, tag players with their current teams, and highlight the specific player the note is about within the table text. Notes for active players and teams are attached to each team’s next scheduled game. The automated version of our example note looks like this:Very close to the original!Scaling up note generation for notes that fit this paradigm is relatively straightforward. After adding 2020 postseason stats, we were able to create 150 notes per game during the League Championship Series – a tremendous increase from what is feasible manually, saving many hours of time.We store all game notes in another BigQuery table with “metadata” fields for team, player, game, and more, allowing notes to be further filtered or manipulated in upstream processes. To facilitate consumption by MLB content and production personnel, game notes were surfaced in a more visually appealing and user-friendly Data Studio dashboard.Surfacing the best game notesOnce the number of automated notes reached a certain volume, we noticed a challenge that was almost the opposite of the initial one: too many game notes to consider. Broadcasters and production crews are only looking for a couple key contextual insights to include in a telecast and could be easily inundated with too much information.Being able to filter notes by the various fields mentioned above helps, but another feature we added was a “note score” that represented how “good” each note is. Since this is inherently subjective, our initial idea was to come up with various concepts related to how interesting or useful a specific game note might be, and figure out a data-driven way to measure each of them. The eight component scores that comprise the current note score metric are:Stat Interest, incorporating extremeness (impressiveness) and direction of ranking (positive or negative)Player Game Relevance, currently used to increase scores for notes on a team’s probable starting pitcherPlayer Relevance, using a player’s various MLB honors (rated by relative prestige and recency) to rate some players as more relevant than othersPlayer Popularity, based on YouGov’s list of most famous contemporary Baseball players in America, as of August 2020 Team Relevance, based on FiveThirtyEight’s Postseason projections (chances to make playoffs and win the World Series) during the regular season, the same for every remaining team in the PostseasonTeam Popularity, based on number of Facebook fans and Twitter followers of official team accounts (both per Statista), as of August 2020Stat Type, representing how some stats are more broadly interesting/applicable than othersStat Span, representing how stats involving more recent spans are likely more interesting/applicable than those involving older seasonsOur “final” note score is a weighted average of these component scores, with the highest weighting by far on Stat Interest, and then relatively high weights on Player Game Relevance, Player Relevance, and Stat Span. In the MLB-facing game notes dashboard, we took advantage of Data Studio parameters to allow users to enter their own weights to create a “custom” note score, enabling their own ranking of notes across games.There is admittedly a lot of subjectivity in the way each of the note score components are measured and how they are weighted. Without an objective way to measure note quality, we’ve in some sense put in placeholders for the purpose of prototyping the system. In the future, consumers of the notes could mark their perceived quality or even simply track if they were used on broadcasts or not. This “labeling” could then provide data for a supervised machine learning problem, where past notes could be used to predict the perceived quality or likelihood of usage of new notes, allowing for more actual result-driven note scoring.That said, the main takeaway is that having a note score, even in its current form, generally helps separate better game notes from worse ones. This helps the MLB production and content teams focus their limited time and attention to notes more likely to have impact.Putting it all together and building for the futureBy encapsulating the BigQuery pieces for leaderboard creation, note generation, note scoring, attachment to games, and preparation for the dashboard into a series of views and stored procedures, our daily note generation process is run with a few short SQL statements. As we mentioned, this code runs at the end of the Cloud Composer pipeline referenced above, so that game notes are generated right after Statcast data is updated in BigQuery each morning during the season.To recap, MLB uses Google Cloud’s suite of data analytics tools to create automated game notes at vastly increased speed and scale. Using Dataflow to capture Statcast event data from the last six seasons and daily going forward, BigQuery to compute statistics and add appropriate context to turn them into textual notes, and Cloud Composer to orchestrate the daily data ingestion and note creation pipeline, hundreds of insightful game notes are surfaced daily for consideration by the MLB content and event production teams.While stat leaderboard-based notes may represent the most readily scalable category of notes, there are of course many other types of game notes we could create automatically: player- or team-specific highs and lows, single outlier events, and matchup-specific notes involving players on two teams facing off. Another future direction of high interest is to create near-live in-game notes, providing context to events on the field seconds after they take place.For all that and more, stay tuned for more exciting collaboration from the MLB-Google Cloud partnership—we have plenty “on deck.” But for now, enjoy the 2020 World Series!Major League Baseball trademarks and copyrights are used with permission of Major League Baseball. Visit MLB.com.
Quelle: Google Cloud Platform

Improving security and governance in PostgreSQL with Cloud SQL

Ensuring databases are securely managed is a crucial part of every organization’s critical operations. When those organizations rely on a managed service like Cloud SQL, a key benefit is consistency of management, including security policies that extend beyond a single service. Cloud SQL has continued to enhance its security capabilities. We’ve introduced VPC Service Controls so you can securely connect to your database instance, and have added Customer Managed Encryption Keys as an option for meeting regulatory compliance. Now, we’re proud to announce Cloud Identity and Access Management (Cloud IAM) integration and the enablement of PostgreSQL Audit Extension (pgAudit), both available in preview for Cloud SQL for PostgreSQL.Enablement of pgAudit offers Cloud SQL users the flexibility to log statements at their needed level of granularity for future investigation or auditing purposes. With pgAudit, Cloud SQL users configure filters that log only the sensitive actions that are specific to their data, minimizing performance impacts to the database. Cloud SQL pgAudit logs contain the timestamp, username, database, command type, and the raw query to equip security teams with detailed information about database accesses. This extension can be configured to include which particular command sets should be audited and also allows for the creation of auditor roles, which can then be assigned to designated users. Once those logs are collected, users can analyze and monitor them from Cloud Logging, BigQuery, or their preferred third-party log management tool.The integration with Cloud IAM enables administrators to authorize users to log in to the PostgreSQL database using short-term access tokens instead of traditional database passwords. This simplifies the authentication workflow for users by removing the need for a separate set of credentials to access the database, as well as reducing identity management complexity. This centralized approach with Cloud IAM brings greater consistency to the authentication and authorization experience with other Google Cloud database services and is simple and straightforward to set up, as demonstrated below.Authorizing a Cloud IAM user for database loginCloud IAM integration can be enabled by an administrator for a database instance by updating a single flag, as seen in the following command:$ gcloud sql instances patch [INSTANCE­_NAME] –database-flag cloudsql.iam_authentication=onDatabase users can now be created by using the same email address as the one in use for Cloud IAM and then granted privileges with a normal grant command or by assigning roles to that user.$ gcloud beta sql users create [EMAIL] –instance=[INSTANCE­_NAME] –type=cloud_iam_user …To learn more about these new features, check our documentation here and here, and try it out with your own project. Cloud SQL continues to enhance its security and governance capabilities alongside advancements by the rest of Google Cloud and meet the needs of our customers. Stay tuned for additional investment and updates in this space across all of our database engines.
Quelle: Google Cloud Platform

Preparing for peak holiday shopping in 2020: War rooms go virtual

As retail gets ready for an unprecedented holiday 2020, it’s not just shoppers who are looking to go digital-first. Retail war rooms – traditionally a single large room where core IT and business teams gather together to ensure systems keep running, websites don’t crash and items stay in stock – are also looking different due to COVID-19. For many retailers, holiday war rooms in 2020 are going to be scattered across multiple living rooms, couches, garages, and kitchens as people are working remotely. Managing this type of large scale, high visibility event 100% virtually (remotely, digitally, it all means the same thing) is a first for many. This year many of our customers have elected to use our Black Friday/Cyber Monday (BFCM) white glove service. We are working with leading retailers such as Macy’s, The Home Depot, and Tokopedia as they take their war rooms 100% virtual.Implementing virtual war rooms has been a crucial part of our ability to respond to increased site traffic and sales allowing us to respond quickly and keep our more than 100 million monthly active users happy Tahir Hashmi, VP of Engineering (Technical Fellow) at TokopediaThe good news is this has been done before. Google has been running virtual war rooms for many years when conducting large product launches, incident responses, and our own Black Friday/Cyber Monday activities. We’ve created guidance for preparing, running, and evaluating Black Friday/Cyber Monday and an extended holiday season virtual war room. We want customers to make sure their response to such an important peak event is as responsive and efficient as it has been in past years. These best practices will help teams navigate consumer behavior uncertainty this season and the corresponding system demands to provide continuous uptime and exceptional customer experience.Step 1: Preparing for the eventGather important informationStart preparing to manage what is often the largest and most important event of the year for your business by ensuring that all information that may be necessary during the event is easily available, clearly documented, and quickly accessible by all members of the war room. Remember that any communications may incur delays – it won’t be possible to simply walk over to your teammate’s desk and ask them a question. CommunicationFirst, determine the exact communication tools and approaches you will use both during normal event management and when you shift to emergency or incident response. Specify both group- and team-wide communication expectations (i.e. chat channels, conference bridges, etc.) and how folks will be able to communicate one-on-one should direct escalation or clarification be necessary. These expectations should be as clear and straightforward as possible so that there is no confusion, especially if you have to manage an incident during an already stressful time. Consider backup plans for each – what will you do if your selected chat platform experiences an outage, for example?One specific recommendation is to standardize date/time formats in all communication – this is especially important if your team is distributed across multiple time zones. Communication should be as unambiguous as possible, and having to clarify that you were referring to your local time zone rather than the next oncaller’s when describing an event you’re handing over adds confusion and possible delays in response.Another critical component of communication is enabling people to get the information they need without having to ask others. To that end, consider using or creating a dedicated status page or Google Group that provides an overall health of the systems involved in the event and links to additional details, such as relevant monitoring and/or logging consoles. The objective is to allow those who need to know what’s happening to get that information at a glance and not require additional communication. A key recommendation is to designate a specific and known owner of this page to be responsible for updating it on a predetermined schedule.ExpectationsNext, ensure that there is a clear definition of staffing, roles, and expectations that includes both normal and emergency contact methods. Create a list of team members who will be involved in the event and how they may be reached directly (typically on their mobile phone or via pager) should the need arise. If you’ll be using a rotation system, document it clearly and create a prescriptive plan for how hand-offs of both normal operations and escalations will be handled during the event. In either case, be clear about each team’s or individual’s role in the event and about when the emergency method of contact should be used versus the normal one. It will be very helpful to create an explicit “chain of escalation” document, if you don’t have one already. This way the right level of attention is directed at a problem should one arise AND so that people don’t experience overload and burnout during the event, which will likely demand their attention over a prolonged period of time.This is also a great time to create an expected timeline for the event. As clearly as possible, document when the event will start, what activities will take place during the event itself, and when the event will end.Finally, consider creating a plan for handling common outage modes you may experience. Ensure your monitoring is ready to detect them and that you have a plan to respond. For example, confirm that the right people are available (e.g. what if you need to spend money quickly to bring up more capacity?) and ready to approve such decisions quickly if needed. EngagementIn the past, you may have run these events in a dedicated physical space and possibly provided food, entertainment, or other means to keep the team engaged. How will you continue to keep people engaged during their shifts in a virtual environment? Think about sending the team gift cards or treat baskets as a surprise to boost morale when going through this experience virtually.Do A Test RunThe best way to ensure preparedness is to run through simulations that will let you see how your virtual processes work under pressure. This will help you gauge their effectiveness in solving a situation when problems arise and allow you to handle anything that may come your way. To prepare for such an exercise, determine the exact scope of what you’d like to test and accomplish. If you’re looking to specifically exercise those aspects of your war room that have changed to virtual, you’re likely going to focus on how information is exchanged in a distributed team. Consider testing your communication tools – both primary and secondary – by using them for normal communication and escalation situations. This should help you determine whether the team has the tools configured appropriately and easily available to them, if there are any issues with useability or accessibility you need to address prior to the event, and whether your expectations of how communication takes place during the event are clear.Consider running an exercise to validate your timeline of events – both under “normal” operating conditions and during an incident, emergency, or escalation. The latter can be thought of as a Wheel of Misfortune tabletop exercise (template) where your objective is to practice your incident management and response techniques. While the former would be more focused on ensuring that the timeline you have created is realistic, your expectations are clear and well-understood, and that the team is able to act on their assigned responsibilities.Finally, you may choose to prepare for the event by running a “live” test – either using a DiRT-style or chaos engineering approach and introducing actual failures into your production systems or by running a large-scale load test against a non-production environment. In either case, you will want to treat the test as practice for the actual event and use all of the information you’ve collected in the previous section to respond.  Post Mortem of Preparations and TestsAfter preparations and testing have finished, evaluate what went well, what can be improved, and how you can strengthen the war room process itself. This is important to ensure your ability to adapt and keep the event running under any circumstances. However, do not simply focus on those things you need to do to prepare for this year’s event – also try to capture what you can improve long term to be in a better position for future events.Use the learnings from the tests to improve your plan and address any issues you discover as quickly as possible. Prioritize action items from the post mortem in your engineering work planning leading up to the event, paying special attention to issues of communication and information flow, as those can have a critical impact on the ability of your team to manage this event remotely.Step 2: During the eventWith preparations now complete, it is time for the big event. Due to the extensive planning that has happened already the goal is for things to go smoothly. However it is important to remember the key differentiators of communication, activity logging, and escalation management that affect virtual war rooms due to the remote collaboration.CommunicationThe importance of communication during a virtual war room cannot be overstated. A disciplined approach to preparation and following established rules may mean a difference of hours in outage resolution.Throughout the entire event make sure to have a single chat room that is at the core of your communication strategy. Be prepared, should an actual outage occur, to start additional chat rooms focused on specific issues. For example you might find that a dedicated chat room for the technical team is of great value.Appoint a single person to be the communications lead. As part of Google’s incident management training it is mandated that during large/huge outages, a communication lead is appointed. This is the person that everyone goes to with questions and provides all outgoing updates, allowing the rest of the team to focus on their specific roles. As stated previously, the communications lead may wish to keep a single Current Status of Event page updated so that anyone can know, at a glance, what’s happening.Finally, be especially vigilant about transferring information during shift handovers. With an up-to-date status page and logs, this may be trivial. However, always get an explicit acknowledgement from the party taking over the shift, especially when transferring roles like the communications lead and decision maker. During the preparation phase the contacts list that was created should reflect any team members due to come oncall during the virtual war room. Teams handing over should be prepared to perform handover duties which could include informing war room members on the chat who is about to come on call and who they replace.LoggingIn order to easily reconstruct what happened during the event later, when you are writing a retrospective or post-mortem, try to keep a log of everything that happens. Make sure your chat rooms have history turned on. Nominate dedicated note takers, but encourage everyone to keep a log of actions taken and events they’ve noticed. (Google Forms can be an easy solution here. Setup the simplest possible form with a single text field, and make sure it records the timestamp. Encourage everyone to enter information, you can deduplicate later.)Make sure to set a cadence for updating the status.  Even if nothing interesting happens, post an update anyway.EscalationBe prepared to handle expected and unexpected emergencies. Make sure you always have a single dedicated decision maker that makes the call on what should happen next. If multiple people feel empowered to make unilateral decisions and production changes at the same time, you are much more likely to exacerbate the situation and prolong the outage.Dealing with an outage is an important area to master in itself, whether in person or remote. Some good starting points to learn more about how to handle incidents include the Managing Incidents chapter in the SRE book and the followup Incident Response chapter in the SRE Workbook.Step 3: Post eventAfter the event concludes, you should conduct a post mortem of the entire process. The three pieces of information you want to collect are: what went well, what went wrong, and where did you get lucky.Note through all three of these sections, you want to keep the investigation blameless. Avoid statements like “X did something”, and instead use “thing was done”. If you want to make sure there is an audit trail, you can add a link to the code or an audit log, but the goal of this document is to highlight system issues and successes, not point to a person. The topic of this post mortem should focus on details about the virtual war room itself. We recommend that teams write two postmortems: one about the event (e.g. we made a million dollars!) and one about the virtual war room operations. When filling out the three sections, consider some of the following prompts:How did communications go? Did everyone know what was happening and when?If there was an outage, did it follow the normal flow?Did everyone have the correct permissions?Did everyone know what to do and when?Were conversations had in lots of different mediums, or were they all in one space?Did we communicate with our vendors well?Was the war room run for long or short enough?Did we learn things that we could apply to our normal operations?Make sure everyone involved in the event and war room has a chance to contribute, but one person should be the owner. After folks have had a chance to comment and expand it, publish it to the whole company so everyone can learn from how you ran your virtual war room!If you want to learn more about writing post mortems, check out the following resources:Fearless shared postmortemsGoogle SRE Book: Postmortem Culture Google SRE Book: Example PostmortemA collection of postmortem templates: dastergon/postmortem-templatesImproving Postmortem Practices with Steve McGheeThe approach above might look daunting, but by following it with the right methodology and organizational mindset you can execute a successful holiday season and lay the groundwork for a responsive and secure virtual war room. And remember, the Google Cloud team is here to help. To learn more about getting started on Black Friday / Cyber Monday, any other upcoming event preparations, or general best practices to manage risk reach out to your Technical Account Manager or contact a Google Cloud account team.A special thanks to Yuri Grinshteyn, Site Reliability Engineer / CRE;  Nat Welch, Site Reliability Engineer / CRE; Ahsan Khan, Program Manager; Dan Tulovsky, Site Reliability Engineer / CRE; Fabian Elliott, Technical Account Manager, for their contributions to this blog post.Related ArticleHelping retailers prepare for the 2020 holiday seasonCOVID-19’s impact on the retail industry means retailers everywhere are gearing up for an uncertain holiday season. We’re sharing our own…Read Article
Quelle: Google Cloud Platform

Prepare for Google Cloud certification with one free month of new Professional Certificates on Coursera

Coursera, one of our training partners, is offering one month of no-cost access to our growing portfolio of six Google Cloud Professional Certificates until November 191 to help you develop your cloud knowledge and prepare for the official Google Cloud certification exams. Industry-recognized Google Cloud certifications help you validate your cloud expertise, elevate your career, and transform businesses with Google Cloud technology. We’re also excited to announce that Google Cloud has launched three new Professional Certificates on Coursera: Google Cloud Networking Professional Certificate, Google Cloud Security Professional Certificate, and SRE and DevOps Engineer with Google Cloud Professional CertificateRead on to find out which Professional Certificate program is right for you.Google Cloud Networking Professional CertificateThis new certificate is for anyone interested in pursuing or furthering their career as a cloud network engineer. It helps you get ready for the Google Cloud Professional Cloud Network Engineer certification exam. With this program, you’ll get hands-on training on how to design, plan, and prototype a Google Cloud network, implement a Google Cloud Virtual Private Cloud (VPC), configure network services, implement hybrid interconnectivity, and implement network security. Google Cloud Security Professional Certificate The new Google Cloud Security Professional Certificate helps you to take your cloud security engineering career to the next level and prepares you for Google Cloud’s Professional Cloud Security Engineer certification exam. You will have the opportunity to practice with hands-on labs and learn how to configure access within a cloud solution environment, configure network security, ensure data protection, manage operations within a cloud solution environment, and ensure compliance in this program. SRE and DevOps Engineer with Google Cloud Professional Certificate This new program prepares you to launch or advance your career as a cloud devops engineer and supports you in your preparation for the Google Cloud Professional Cloud DevOps Engineer certification exam. In this program, you’ll gain knowledge and participate in hands-on labs that will help you understand how to apply site reliability engineering principles to a service, optimize service performance, implement service monitoring strategies, manage service incidents, and build and implement CI/CD pipelines for a service. Cloud Engineering with Google Cloud Professional CertificateCloud Engineering with Google Cloud Professional Certificate is for those starting their careers as cloud engineers and prepares you for Google Cloud’s Associate Cloud Engineer certification exam. The certificate includes hands-on labs that will further your knowledge of how to set up a cloud solution environment; plan and configure a cloud solution; configure access and security; deploy and implement a cloud solution; and ensure successful operation of a cloud solution. Cloud Architecture with Google Cloud Professional CertificateThis program, which is for individuals interested in becoming or furthering their careers as cloud architects, helps you get ready to take the Google Cloud Professional Cloud Architect certification exam.You’ll have a chance to participate in hands-on labs and learn how to design and plan a cloud solution architecture; manage and provision the cloud solution infrastructure; design for security and compliance; analyze and optimize technical and business processes; manage implementations of cloud architecture; and ensure solution and operations reliability. Data Engineering with Google Cloud Professional CertificateData Engineering with Google Cloud Professional Certificate is for those looking to advance their career in data engineering and interested in taking Google Cloud’s Professional Data Engineer certification exam. This program includes hands-on labs to help teach you how to design data processing systems, build and operationalize data processing systems, operationalize machine learning models, and ensure solution quality. Get started here to get your one month, no-cost access to Coursera courses. In addition to access to the certificates, you’ll receive one year of exclusive access to Big Interview, which includes a resume builder, career coaching, connection to a network of Professional Certificate alums, and more.1. Discount applied at checkout. Valid until November 19, 2020 at 11:59 PM PT, while supplies last. Coursera first month free promotion is only available to learners who have not previously paid for training on Coursera. A credit card is required to activate your free month. After the first month is over, your subscription will auto-renew to a $49 monthly charge until you cancel your Coursera subscription.Related ArticleHelping teach a community cloud skills with Google Cloud Associate Cloud Engineer certificationHow the Google Cloud Associate Cloud Engineer certification helped one woman teach her community cloud skills.Read Article
Quelle: Google Cloud Platform