Build a platform with KRM: Part 3 – Simplifying Kubernetes app development

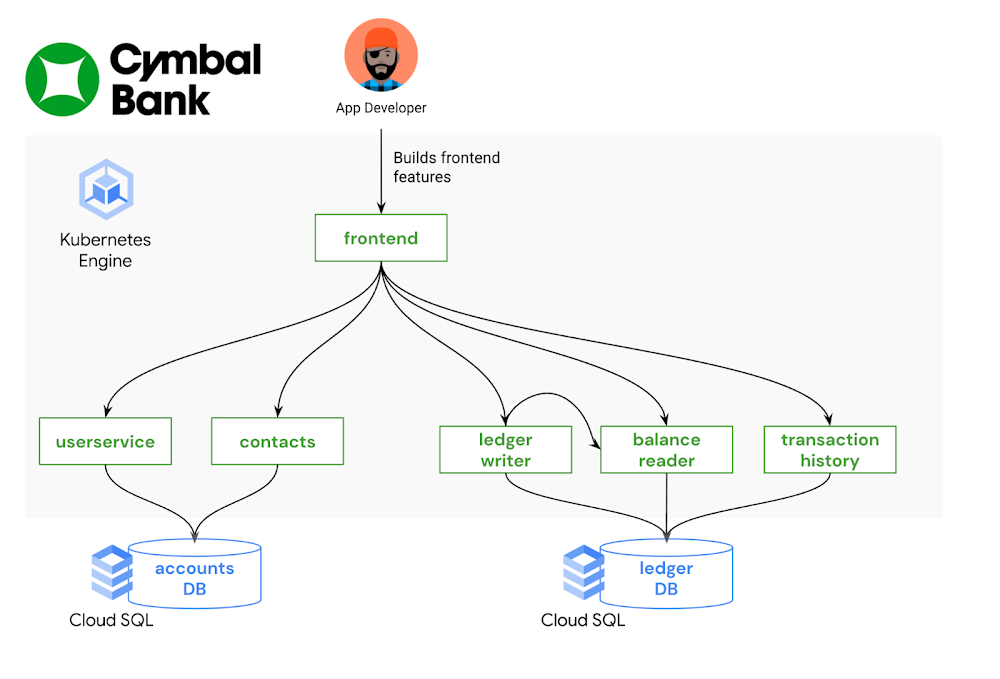
This is part 3 in a multi-part series about the Kubernetes Resource Model. See parts 1 and 2 to learn more. In the last post, we explored how Kubernetes and its declarative resource model can provide a solid platform foundation. But while the Kubernetes Resource Model is powerful, it can also be overwhelming to learn: there are dozens of core Kubernetes API resources, from Deployments and StatefulSets, to ConfigMaps and Services.  And each one has its own functionality, fields, and syntax. It’s possible that some teams in your organization do need to learn about the whole Kubernetes developer surface, such as the teams building platform integrations. But other teams, such as application developers, most likely do not need to learn everything about Kubernetes in order to become productive. With the right abstractions, developers can interact with a Kubernetes platform more easily, resulting in less toil and speedier feature development. What is a platform abstraction? It’s a way of hiding details, leaving behind only the necessary functionality. By taking certain details away, abstractions open up new possibilities, allowing you to create concepts and objects that make sense for your organization. For instance, you may want to combine all the Kubernetes resources for one service into one “application” concept, or combine multiple Kubernetes clusters into one “environment.” There are lots of ways to abstract a Kubernetes platform, from custom UIs, to command-line tools, to IDE integrations. Your organization’s abstraction needs will depend on how much of Kubernetes you want to expose developers to – it’s often a tradeoff between ease of use and flexibility. It will also depend on the engineering resources you have available to devote to setting up (and maintaining) these abstractions; not every organization has an in-house platform team. So where to start? If you’re already shipping code to a Kubernetes environment, one way to brainstorm abstractions is by examining your existing software development lifecycle. Talk to the app developers in your org: how do they interact with the platform? How do they test and stage their code? How do they work with Kubernetes configuration? What are their pain points? From here, you can explore the vast cloud-native landscape with a set of concrete problems in mind. This post demonstrates one end-to-end development workflow using a set of friendly Kubernetes tools.Bootstrapping developers with kustomizeImagine you’re a new frontend developer at Cymbal Bank. Your job is to build and maintain the public web application where customers can create bank accounts and perform transactions. Most of your day-to-day work involves changing or adding features to the Python and HTML frontend, testing those features, and creating pull requests in the source code repository. You’re not very familiar with Kubernetes, having used a different platform in your previous role, but you’re told that you have a development GKE cluster to work with. Now what?An application developer’s focus, ideally, is on source code – not on the underlying infrastructure. Let’s introduce an abstraction that allows the app developer to test their code in development, without having to write or edit any Kubenetes resource files. An open-source tool called kustomize can help with this. kustomize allows you to “customize” groups of Kubernetes resources, making it easier to maintain different flavors of your configuration, without duplicating resource manifests. The two core kustomize concepts are bases and overlays. A base is a directory containing one or more Kubernetes resources, like Deployments and Services. Base resources are complete, valid KRM, and can be deployed to a cluster as-is. An overlay is a directory that patches over one or more bases with some customization. Overlays can include modifications to resources in the base, or additional resources defined in the overlay directory. Multiple overlays can use the same base. This allows you to have separate environments for development, staging, and production, which all use the same set of underlying Kubernetes resources. Let’s see this in action. The cymbalbank-app-config repository contains the kustomize resources for the Cymbal Bank app. This repo has one set of base KRM resources. These are complete YAML files for the Deployments, Services, and ConfigMaps corresponding to each Cymbal Bank service. The repo also has two overlay directories, “dev” and “prod.” The development overlay customizes certain fields in the base resources, like enabling debug-level logs. The production overlay adds different customization, keeping the default “info” level logging, but increasing the number of frontend replicas in order to better serve production traffic.Every kustomize directory contains a special file, kustomization.yaml. This file is an inventory of what should be deployed, and how. For instance, the kustomization.yaml file for the development overlay (shown below) defines which base to use, and lists all the “patch” files to apply over the base. The patch files are incomplete Kubernetes resources, changing a specific piece of config in the corresponding base resource.By providing a pre-built set of Kubernetes resources, along with a development-specific overlay, platform teams can help bootstrap new Kubernetes users without requiring them to create or edit YAML files. And because kustomize has native integration with the kubectl command-line tool, developers can directly apply these resources to a test cluster with “kubectl apply -k.” We can also take this kustomize environment one step further, by allowing the app developer to deploy directly to their development GKE cluster from an IDE. Let’s see how.   Testing application features with Cloud CodeCloud Code is a tool that helps developers build on top of Google Cloud infrastructure without having to leave their IDE (VSCode or IntelliJ). It allows developers to directly deploy to a GKE cluster, and provides useful features like YAML linting for Kubernetes resources.Let’s say the frontend app developer just added some new HTML to the login page. How can they use the “development” kustomize overlay to deploy to their GKE cluster? Cloud Code makes this easy through a tool called skaffold. skaffold is an open-source tool that can automatically build and deploy source code to Kubernetes, for multiple containers at once. Like kustomize, you can use skaffold by defining a YAML configuration file, skaffold.yaml, that lists where all your source code lives, and how to build it. The Cymbal Bank skaffold file (shown below) is configured with three profiles – dev, staging, and prod – each set up to use a different kustomize overlay. Cloud Code is closely integrated with skaffold, so that if you click “Run on Kubernetes” inside your IDE, and specify the “dev” profile, Cloud Code will read the skaffold.yaml configuration, build your local source code into containers, push those containers to your image registry, then deploy those images to your Kubernetes cluster using the YAML resources in the kustomize dev overlay. In this way, the frontend developer can test their local code changes with a single click – no kubectl or command-line tools required.From staging to production with Cloud Build Now, let’s say the frontend developer has finished implementing and testing their feature, and they’re ready to put out a pull request in git. This is where Continuous Integration comes in— all the tests and checks that help verify the feature’s behavior before it lands in production.  As with local development, we want to enable code reviewers to verify this feature in a production-like environment – without forcing them to manually build containers or deal with YAML files. One powerful feature of skaffold is that it can run inside your CI/CD pipelines, automatically building container images from a pull request, and deploying to a staging cluster. Let’s see how this works.We define a Cloud Build trigger that listens to the Cymbal Bank source repository. When a new pull request is created, Cloud Build runs a pipeline containing a “skaffold run” command. This command builds the pull request code, and uses the production kustomize overlay to deploy the containers onto the staging GKE cluster. This allows both the pull request author and the reviewers to see the code in action in a live Kubernetes environment, with the same configuration used in production.We then define a second Cloud Build trigger, which runs when the pull request is approved, and merges into the main branch of the source code repo. This pipeline builds release images, pushes them to Container Registry, then updates the production Deployment resources to use the new release image tags. Note that we’re using two repos here- “App Source Repo” contains the source code, Dockerfiles, and skaffold.yaml file, whereas “App Config Repo” contains the Kubernetes resource files and kustomize overlays. So when a new commit happens in App Source Repo, the Continuous Integration pipeline automatically updates the App Config Repo with new image tags: Once the release build completes, that triggers a Continuous Deployment pipeline, also running in Cloud Build, which deploys the production release overlay, configured with the new release images, to the production GKE cluster.  Here, skaffold and Cloud Build allow us to fully automate the stage-and-deploy process for Cymbal Bank source code, such that the only human action to get code into production was a change approval. App developers didn’t have to worry about the details of every cluster in the environment. Instead, they were able to interact with the system as a whole, focusing on source code and writing features. In this way, app developers worked successfully with KRM by not working with KRM at all. This was made possible by adding abstractions like kustomize and Cloud Code on top. This post only scratches the surface on the kinds of abstractions you can build on top of Kubernetes, but hopefully provides some inspiration to get started. To try this out yourself, check out the part 3 demo.In the next post, we’ll discuss Kubernetes platform administration, and how to use the Kubernetes Resource Model to define and enforce org-wide policies. 
Quelle: Google Cloud Platform

Google Cloud Dataprep by Trifacta cheat sheet

If you want data as an ally to steer your business, you should look at Dataprep by Trifacta. Data is needed in every aspect of your business from optimizing profit margin, identifying new market opportunities, predicting next-best offer, responding to fraud, or reporting on regulatory obligations. Whether you are in a leadership position leveraging data for decision-making or in a support role to deliver clean and trustworthy data, you know how much effort (and often frustration) it takes to prepare data and make it ready for consumption. Where is the data? How do I access it? What’s in the data? Can I trust the data? How can I turn it into a format that I can use? How do I combine it with other sets of data? How do I automate all this process? Let’s see how you can turn this cumbersome and painful process into a seamless and fun experience with Dataprep!Click to enlargeWhat is data preparation?Data preparation, also known as data wrangling, is a self-service activity to access, assess, and convert disparate, raw, messy data into a clean and consistent view for your analytics and data science needs. Preparing data is critical but time-intensive; data teams spend up to 80% of their time converting raw data into high-quality, analysis-ready output.The work of preparing raw data into pristine asset consists of 6 iterative steps:DiscoverHow do I access the data? What is in the data? Can I trust it? Dataprep helps you access diverse data sources and discover features of the data to quickly determine its value. With datatype inference, column-level profiles, interactive quality bars, and histograms, you get immediate visibility into trends and data issues, guiding your transformation process.StructureCan the data be used with its current format? Structuring refers to actions that change the form or schema of your data. Splitting columns, pivoting rows, and deleting fields are all forms of structuring. Dataprep predicts and suggests the next best transformation based on the data you’re working with and the type of interaction you applied to the data.CleanAre all the dates valid? Is the category correct? Is a SKU missing? During the cleaning stage, Dataprep surfaces data quality issues, such as missing or mismatched values, and suggests the appropriate transformations (formatting the date for you, normalizing the category into a consistent list, replacing or deleting the SKU) to correct these values from the dataset. EnrichDo you want to keep your data alone or augment it with other datasets from public or internal repositories? The data you need may be spread across multiple files, applications, and databases. To gather all the necessary insights, you need to enrich your existing dataset by joining and aggregating various data sources. With Dataprep you can quickly execute lookups to data dictionaries or perform joins and unions with disparate datasets. ValidateDo you trust the transformations you applied to your data? Is this an accurate result? Dataprep profiles and provides data quality indicators across the complete transformed dataset. Here, you can do a final check for any data inaccuracy that wasn’t initially identified. Validate that your output dataset has the intended structure and content before publishing it for broader analysis.PublishingHow should the resulting clean data output be consumed? At what frequency should it be refreshed? When your data has been successfully structured, cleaned, enriched, and validated, it’s time to publish your wrangled output for use in downstream analytics processes. Dataprep offers all you need to automate your data pipeline and publish it for your consuming analytics applications. Dataprep key featuresBuilt-in data quality assessment and validationAs soon as you access data, Dataprep instantly discovers it and surfaces it in a familiar and intuitive grid interface. You trust what you see. Dataprep shows you value distribution, pattern formats, and highlights outliers. You even get suggestions to create data monitoring rules to track and resolve data quality issues. All this with visual interaction that reflects in real-time the transformations applied to the data. So you always see exactly what your data will look like after it is transformed.Automated data pipelinesThe data preparation recipes you author with Dataprep can be operationalized by data engineers or operation teams and controlled and monitored confidently. Dataprep’s end-to-end data pipeline leverages the auto-scaling processing capabilities of Dataflow & BigQuery to handle any volume of data–from Gigabytes to Petabytes. In addition, Dataprep integrates with Cloud IAM/OAuth for data security and peace of mind. And the magic is that you can just do it with clicks, not code (though coding is possible if that’s your preference!)Visualize & accelerate data transformationUltimately, you want data ready quickly for your analysis, and you want to trust it. But there’s so much data and there are so many rules to apply! No worries, with Dataprep you’ll get ML-based suggestions to transform and clean the data. Select the one suggestion that is the most relevant or modify it for your needs. Standardize, structure, join, union, pivot, unpivot, aggregate, calculate any formula with a few clicks and get immediate feedback to your transformation. Data preparation becomes a game and you’ll enjoy it. The only regret: you may spend 90% less time preparing data now that you find it so fun! How does Dataprep work?Dataprep by Trifacta is a serverless and native Google Cloud data preparation solution as part of the broader Google Cloud Smart Analytics portfolio. Dataprep allows data analysts, business analysts, data engineers, and data scientists to visually explore, clean, and prepare big data.Dataprep connects to BigQuery, Cloud Storage, Google Sheets, and hundreds of other cloud applications and traditional databases so you can transform and clean any data you want.  Dataprep is built on top of Dataflow and BigQuery. That means any data transformation and cleaning rules you design can easily scale to transform any data, big or small by translating Dataprep data transformation recipes into Dataflow jobs or BigQuery SQL statements. Once your data is ready in BigQuery or Cloud Storage, you can analyze it with Data Studio or Looker, train machine learning models with Vertex AI services, or get insight with other analytics partner solutions such as Qlik or Tableau.Dataprep, as a native service to Google Cloud, can be governed and automated via APIs to be controlled by Cloud Composer and Cloud Functions for example.ConclusionEnough words. Do you want to experience Dataprep first hand? This is easy, try this data warehouse design pattern leveraging Google Sheets, Dataprep, BigQuery, and Data Studio and get a sense of what a comprehensive and scalable analytics solution looks like.Related Article5 cheat sheets to help you get started on your Google Cloud journeyWhether you need to determine the best way to move to the cloud, or decide on the best storage option, we’ve built a number of cheat shee…Read Article
Quelle: Google Cloud Platform

Streamline your real-time data pipeline with Datastream and MongoDB

In our constantly evolving digital world, the companies that come out on top are those that can access the data they need, when they need it. Accessing data in real time enables your company to analyze, plan and improve continuously, so you can make better strategic decisions and reduce your overall risk. Whether the goal is to adjust demand forecasts, solve customer queries, or deliver analytics to end-users before they know they need them, the first step to securing the insights you need is gaining visibility into the relevant data as fast as possible. But any system can move only as fast as its slowest bottleneck. When data resides in many areas of an organization and within a variety of platforms, often-antiquated relational databases can create significant congestion. But companies still can — and must — unlock a tremendous amount of business insight from data stored in these relational data stores and from the applications that continually write to them. The question is how to make it happen.With Google Cloud’s Datastream, a serverless change data capture and replication service, and MongoDB Atlas, you can set up a real-time analytics pipeline that continually streams data from legacy relational data stores (like Oracle and MySQL) into MongoDB Atlas. There, your application can take advantage of the power of MongoDB to improve business decision-making.MongoDB Atlas is a global cloud database service available on Google Cloud. Atlas deploys a fully managed MongoDB cluster with seamless automation and proven practices that ensures up to 99.995% * availability, scalability, and compliance with the most demanding data security and privacy standards. MongoDB Atlas includes features such as Atlas Search to integrate full-text search capabilities into your applications and Atlas Charts to create insightful visualizations without the need for extra tools.Getting StartedPrerequisites MongoDB Atlas account (create your free-tier)Relational data sourceGoogle Cloud AccountCreating a MongoDB Atlas clusterFor a detailed guide on creating your own MongoDB Atlas cluster, see the Getting Started with Atlas tutorial. For the purposes of this blog post, we’ve created an M10 MongoDB Atlas cluster using Google Cloud. We recommend selecting the nearest GCP region when setting up your cluster.Once your cluster is created, you will need to configure two settings to make a connection: network access and database access.Network AccessBy default, a new MongoDB Atlas cluster does not accept any network connections. You have two options for allowing secure network access from Dataflow to MongoDB Atlas: You can use Google VPC network peering, or you can secure the connection by allowing only specific IP connections from Google Cloud to your Atlas cluster. In this blog, we’ll set up Atlas to allow connection from any IP (0.0.0.0). In a production environment, it’s recommended to use either VPC network peering or specify the allow list IPs. For information on MongoDB Atlas security check out Security Features and Setup.To accept external connections in MongoDB Atlas, launch the “IP Access List” entry dialog under the Network Access menu and choose, “Allow access from anywhere.”Once you’ve configured network access, you can configure the user account that will be used to connect from Google Cloud to MongoDB Atlas. Configure user authentication in the Database Access menu.Database AccessYou can authenticate to MongoDB Atlas using username/password, certificates, or identity and access management (IAM) authentication methods. To create a username and password that will be used for connection from Google Cloud, select the “+ Add new Database User” option from the Database Access menu.Provide a username and password, and make note of both. You will need these credentials for the Dataflow Flex template later in this post.Configure the source relational databaseDatastream supports a variety of databases, including MySQL and Oracle, as well as various secure connectivity methods. Before you begin, you will need toconfigure these databases for change data capture (CDC). Here, we’ll use MySQL as the data source, and we’ve enabled CDC per the online documentation.Configure Datastream connection profilesAfter your database is set up for change data capture, you can configure the Datastream MySQL source and Cloud Storage destination connection profiles. In our example, they’re called “source_mysql” and “dest_cloudstorage”.To configure the Datastream connection profiles, click on “Create Profile” on the Datastream connection profiles UI and select the relevant type for source or destination.MySQL connection profile configurationName your connection profile, choose the region where it will reside, and MySQL connection details.Cloud Storage connection profile configurationName your connection profile, choose the region where it will reside, and the bucket location. The region needs to be in the same region and the source connection profile and the stream where it will be used.Note:  For security purposes, you will need to set IAM permissions for Compute Service Account or the desired Dataflow worker Service Account. Make sure you perform the following steps:Grant Datastream Admin role to the service account in IAM (Owner will also grant req privileges)Grant objectReader IAM permissions to the Datastream bucketOnce the two connection profiles have been created, you can view them on the connection profiles list.Configure a stream Create a stream from source to destination by clicking on “Create Stream” from the Streams menu.Provide a stream name and ID. “Source type” will be your relational database source, in our example this is MySQL. Follow the wizard’s prompts and select the MySQL and Cloud Storage profiles we created earlier. Once configured properly, Datastream will pull data changes as they happen from MySQL and write them into the Cloud Storage bucket.At this point, we’re ready to configure the Dataflow MongoDB template. But, since we have files stored in Cloud Storage, it’s best to use Pub/Sub notifications for Cloud Storage. This feature makes Dataflow more efficient by alerting on the existence of new files as they become available  instead of relying on Dataflow to continuously scan Cloud Storage for new files across the entire bucket. Create a Pub/Sub notificationTo create a Pub/Sub notification, you need to use the gcloud and gsutil command line tools, since there is no UI available in the Google Cloud console. Let’s enable notifications by creating a Pub/Sub topic and subscription, and creating a notification on the Cloud Storage bucket. The following is an example configuration script:Note: Later you will supply this config in the —parameters section of the gcloud dataflow deploy command..gcsPubSubSubscription=”projects/${PROJECT_ID}/subscriptions/${PUBSUB_SUBSCRIPTION}”Notifications should be set up before Datastream is running. If Datastream is already running, you can create a copy of the files in Cloud Storage instead of recreating the stream. This will trigger the notification mechanism. You can delete the copy after Dataflow processes all the files.Create the Dataflow templateAt this point, we’ve created and configured Datastream and Cloud Storage, and now we’re ready to configure Dataflow. If you have not already done so, be sure to enable Dataflow via gcloud services enable dataflow.googleapis.com.Dataflow makes use of templates, which make it easier to define the source and target, as well as transformations and other logic that should be applied to the data. You can also plug in your own custom JavaScript function to perform custom transformations.  To leverage the Dataflow MongoDB template, go to the Github repository and follow the instructions in the README file. These will guide you through building a Dataflow flex template image and placing it in the Google Container registry. Next, it will tell you how to run this flex template with required parameters. Note that there are several parameters that should be considered in the script. After you work through the README instructions and execute the template, you can see a job created in the Dataflow jobs UI. Note that once you deploy the Dataflow MongoDB template, the job starts running.If you select a job, you can see more details — such as a detailed job graph, metrics and execution details.To see the flow in action, simply add some rows to your relational database and watch them show up in MongoDB Atlas!Better business decisions happen in real timeIn this post, we explored how to set up and configure components in Google Cloud and MongoDB Atlas so that you can stream data from MySQL into MongoDB. By streamlining your real-time data movement, you can gather business insights faster and make smarter, more strategic decisions. No matter your industry, MongoDB Atlas and Google Cloud can help you lead it.Learn more about how you can deploy, manage, and grow MongoDB on Google Cloud on our partner page.Related ArticleUnlock the power of change data capture and replication with new, serverless DatastreamIntroducing a new change data capture (CDC) and replication service that works across heterogeneous databases, cloud and on-premises, for…Read Article
Quelle: Google Cloud Platform

HTTP/3 gets your content there QUIC, with Cloud CDN and Load Balancing

When it comes to the performance of internet-facing applications, HTTP/3 is no small step over HTTP/2: Google’s own roll-out of HTTP/3 reduced Search latency by 2%, reduced video rebuffer times on YouTube by 9%, and improved throughput on mobile devices by 7%. So today, we’re excited to bring support for HTTP/3 to all Google Cloud customers using Cloud CDN and HTTPS Load Balancing. With HTTP/3 support, you’ll see real-world improvements to your streaming video, image serving and API scaling behind our global infrastructure—all without having to change your applications.What is HTTP/3?HTTP/3 is a next-generation internet protocol, and is built on top of QUIC, a protocol we developed and contributed to the IETF, the standards organization in charge of maintaining internet protocols. Together, HTTP/3 and QUIC address previous challenges with HTTP/2 around head-of-line-blocking, security (TLS 1.3 is foundational to QUIC), and reliability over unreliable connections. The original Google QUIC (we call it ‘gQUIC’) will be phased out at the end of 2021, as the number of IETF QUIC clients is quickly surpassing those that support gQUIC. Importantly, your end users can benefit from HTTP/3 today: the latest versions of Mozilla Firefox, Google Chrome, and Apple’s iOS Safari all support HTTP/3 and/or plan to enable it by default in the next couple of months, as do popular libraries such as Cronet and libcurl. Enabling HTTP/3To use HTTP/3 for your applications, you can enable it on your external HTTPS Load Balancers via the Cloud Console or the gcloud SDK with a single click.Clients that don’t yet support HTTP/3 such as older browsers or networking libraries won’t be negatively impacted: HTTP/3 uses the Alt-Svc HTTP header to allow clients to “opt in” if they support the protocol. Those clients will continue to negotiate HTTP/2 or HTTP/1.1 as appropriate.What’s next?In the coming weeks, we’ll bring HTTP/3 to more users when it’s enabled by default for all Cloud CDN and HTTPS Load Balancing customers: you won’t need to lift a finger for your end users to start enjoying improved performance.  If you want to learn more about how Cloud CDN works, check out our overview video, and keep an eye on our release notes to keep up with new features.
Quelle: Google Cloud Platform

Vida Health invigorates virtual healthcare with Google Cloud solutions

Editor’s note: In this guest blog, we look at how healthcare startup Vida Health built a virtual platform on Google Cloud that cut costs and overhead, saves healthcare providers valuable time, and delivers machine learning capabilities that operationalize their data for better patient health outcomes.  At Vida Health, our virtual healthcare platform is designed to deliver whole-person healthcare by treating multiple conditions and integrating both mind and body medicine. In choosing Google Cloud to help us with our digital transformation, we were able to reduce costs 60% by switching from a managed platform to Google Kubernetes Engine (GKE), and are using Google solutions like BigQuery ML to innovate new products that help our patients and empower our clinicians. Accelerating the heartbeat of digital transformationsTraditionally, healthcare has been a slow-moving industry with a bias toward risk aversion and maintaining the status quo. The COVID-19 pandemic challenged this mindset and encouraged many healthcare organizations to accelerate their plans for digital transformation. At the forefront of this transformation is virtual care/telehealth and the ability for providers to offer the same high-quality patient experience over the web and mobile as they do in person. During the pandemic, Vida Health faced challenges scaling our original infrastructure on another cloud provider to meet the growing demand. We also felt that this CSP’s suite of machine learning (ML) services didn’t provide the value add we were seeking. After performing research into competitive cloud technologies, we chose Google Cloud for their flexible, secure, and scalable solutions that integrated seamlessly, reduced our operational overhead, and gave us the tools to build innovative products powered by ML.A key differentiator of Vida in the healthcare marketplace is our platform. Where many competitors have solutions targeting single conditions, we took a horizontal approach, with a platform designed to treat multiple conditions and to integrate both mind and body. Nearly half of Americans have more than one chronic medical condition, and we want to help them with whole-person health solutions that acknowledge the reality of their situation. Our platform is powered by a spectrum of Google solutions, including Looker, an enterprise platform for business intelligence, data applications, and embedded analytics. With a unified dashboard experience, Looker helps us aggregate all of our data and gives us a holistic view of each patient. To take advantage of artificial intelligence (AI) and ML technologies, we were well situated by using BigQuery, Google’s serverless data warehouse, to store all of our data in one place. Even as our datasets in BigQuery grow more comprehensive, it remains easy for our ML engineers and data scientists to use and experiment on that data. We can then take that data into production with BigQuery ML, which allows us to build ML models with only SQL skills.Prescribing ML for new use casesIn our use and exploration of AI/ML in our platform, we go beyond pure AI tools by including human-in-the-loop programs and treatments. For example, we provide coaches, therapists, and dieticians that work with each individual patient, providing tips, strategies, and accountability. Our patient-provider interactions are digitized and stored, giving us a robust training dataset that we can now operationalize using all of the Google tools available. Using these provider interactions, we can track a patient’s progress to ensure they’ve improved their health outcomes, whether it’s weight loss, stress reduction, blood sugar management or beyond. We want to endow our providers with superhuman powers, which means using AI/ML to manage and automate all of the tasks that aren’t member-facing, freeing up the providers to focus their time and energy on their patients. We’re currently experimenting with our Google tools around transcribing the provider’s consultation notes and then applying data analysis to uncover insights that will lead to better health outcomes. Other time-saving solutions on our roadmap for providers include pre-filling standard fields in the chat function and managing end-of-day approvals. We’re currently using BigQuery ML for our “next action recommender,” a member-facing feature on our mobile app that recommends the next step a patient can take in their treatment, based on past datasets of information provided by the patient. At the start of their journey, the steps might be basic, such as scheduling a consultation, adding a health tracker, or watching a health video. But the longer a patient uses our platform, the more sophisticated the recommendation system gets. On the provider side, we have our Vidapedia, a comprehensive list of protocols for treatments that providers can follow. In the past year we’ve invested in Vidapedia cards, which are distinct sets of clinical protocols that have been codified. We’re up to 150 cards, and instead of providers needing to keep all of that information in their heads, we’re working on using BigQuery ML to extract the actions a patient has taken so far in their treatment. Using that data, we’ll then recommend to the provider the most relevant cards that apply to the specific conditions. Having that information at their fingertips reduces the amount of time they need to spend on each member offline, which helps us build efficiency and lower the cost of delivering care.  We’ve also used ML in our customer acquisition process, which has traditionally been a costly endeavor for healthcare startups. A company first needs to market and sell to payers and providers, and then understand the total addressable market (TAM) for their patient base before convincing that segment that their platform is the best decision. We’ve successfully applied ML to this process, sifting through hundreds of different data inputs to better predict who is likely to use our platform, saving us time and money.Invigorating virtual healthcare with Google Cloud solutions The rest of our current Google Cloud stack is robust, featuring BigQuery Slot Autoscaling, a preview feature that optimizes costs and scales for traffic spikes without a sacrifice in performance. We use Looker for data reporting and dashboarding, and Data Studio for quick, ad hoc data visualization. Our relational database is Cloud SQL for PostgreSQL, and we use Data Catalog for data discovery and search. Other Google services in our stack include GKE, Dataflow, Data Fusion, Cloud Scheduler, and AI Platform.  The seamless integration between Google products and services has been impressive and time-saving. Many of our clinical protocols were originally written in Google Docs, and the ability to import that data directly into BigQuery has saved us so much time and effort. Using Looker to then democratize access to that data internally across our organization, and BigQuery ML to build ML applications upon that data, feels like a secret weapon that puts us ahead of the competition. As the healthcare industry continues to adjust to the demands of a changing world, we’ll be working with Google Cloud to deliver cutting-edge solutions that exceed the needs of our patients and providers. Learn more about Vida Health, then apply for our Startup Program to get financial, business, and technical support for your startup. You can also read more about other organizations using Looker and BigQuery to modernize business intelligence.Related ArticleHow Lumiata democratizes AI in healthcare with Google CloudAs AI becomes essential in healthcare, Lumiata’s AI platform helps organizations starting using AI and ML easily to improve care, minimiz…Read Article
Quelle: Google Cloud Platform

Improving cloud operations and migrations with Google Cloud and ServiceNow

When organizations embrace cloud as a core component of their IT operations, they have a number of options: a wholesale migration to the public cloud, incremental or large-scale hybrid deployments, private clouds, or even running services across multiple clouds. The modern enterprise has more options than ever before in terms of where to host any individual workload, but also faces a rising level of complexity. According to Flexera’s 2021 State of Cloud report, 92% of enterprises have a multicloud strategy. However, the majority are also faced with higher than planned cloud costs, and a need to optimize their existing cloud resources. These organizations have a few core needs in common, specifically they must: Maintain visibility into and control over critical applications and data, regardless of where their workloads resideCarefully plan and quickly execute their cloud migrationsMaximize uptime Avoid outages—proactivelyTo help organizations accelerate their cloud migrations securely and efficiently, we are expanding our partnership with ServiceNow in four key ways.1. Enabling real-time visibilityTypically, large organizations have applications and data spanning multiple locations: private clouds running on premises, one or multiple public clouds, or hybrid environments. Managing these disparate workloads and data can be challenging—teams need to know where workloads are and how they’re connected to ensure they can be properly managed.ServiceNow and Google Cloud are integrating Google Cloud Asset Inventory tools with ServiceNow IT Operations Management (ITOM) Visibility services. This will deliver real-time views of data and improved data quality in an organization’s configuration management database (CMDB) through automated updates and reduced operational overhead. Ultimately, this means IT teams will have better visibility into and management of workloads across their entire IT estate. As a result, they’ll be better positioned to leverage their existing governance and compliance models across cloud, hybrid, and on-premises deployments to optimize IT operations, reduce risk, and gain usage and cost reporting.Travel technology company Sabre has been a longtime user of ServiceNow ITOM. Last year, Sabre announced a large-scale partnership with Google to migrate its platform onto Google Cloud.“Sabre provides customer critical backbone technology for the travel industry, with superior uptime requirements demanding strict governance to ensure successful ongoing operations. ServiceNow has been our platform for IT Operations Management, and last year we announced a large-scale partnership with Google Cloud to migrate our platform onto its infrastructure,” said Charles Cinert VP of Global Operations at Sabre. “We need assets and services deployed on Google Cloud to be reflected accurately in our ServiceNow CMDB, be able to leverage our existing IT Workflows to provision assets on Google Cloud, and accelerate migration of our on-premises workloads onto Google Cloud.  We are thrilled to see the partnership investing in these areas to provide us unified visibility, governance, and controls across on-premises and Google Cloud.”2. Accelerating cloud migrationsOnce a baseline management framework is established, IT teams can turn their focus to evaluating and actually migrating workloads. For organizations with a complex IT landscape, this can be particularly challenging, as it can take a long time to identify which workloads to migrate, how applications should be migrated (lift-and-shift, refactored or retired), and in what order to move them. Google Cloud created the Rapid Assessment and Migration Program (RAMP) to help organizations simplify their on-premises to cloud transition by combining multiple sources of workload data and providing recommendations for right-sizing, order of migrations and other cloud optimizations.ServiceNow CMDB provides a single system of record for your IT infrastructure and digital service data. It’s able to assess everything you have and help you migrate it in the best way for your organization. Used in conjunction with Google Cloud RAMP), CMDB can provide critical workload performance and sizing data used to craft a migration strategy. Our mutual systems integration partners believe these integrated capabilities can accelerate cloud migration planning by up to 50%.“Sabre realizes value as each workload lands in Google Cloud, and our migration spans thousands of workloads over the next 10 years,” adds Cinert. “This partnership represents a way for us to accelerate that effort while reducing the risk associated with it.”3. Providing consistent governance across environmentsWhen moving mission-critical workloads to the cloud, ensuring operational excellence is paramount. To support the highest levels of uptime, security, and control over data, we will expand our catalog of integration “spokes” available in ServiceNow’s IntegrationHub to include more Google Cloud and Google Workspace services. These spokes will enable organizations to manage their Google Cloud assets from ServiceNow bringing the same level of operational rigor from an on-premises environment to a customer’s Google Cloud deployment. Customers will see improved governance and security around their cloud assets, aligned with existing IT workflows. This is particularly important as organizations create high-availability and disaster recovery environments for their critical applications. In addition, Google and ServiceNow are exploring advanced self-service access to provisioning workloads leveraging services such as Google Private Catalog Service and ServiceNow Service Catalog. IT organizations benefit from even greater agility while maintaining governance and control.4. Predict issues and automate resolutions with AIOpsIT organizations work tirelessly to minimize the impacts of service outages. ServiceNow AIOps leverages AI to sift through large sets of data to help organizations predict outages and automate resolutions. Through this partnership, ServiceNow AIOps can now consume and process IT event-data from Google Cloud Ops (formerly “Stackdriver events”) to identify trends and correlate data that may affect service levels. For example, ServiceNow ITOM Health can ingest Google Cloud event data, along with telemetry from logs, monitoring tools, and other data sources, to quickly identify root causes of issues and automate remediation of affected systems.We are excited about this next phase in our alliance with ServiceNow. We aim to deliver significant value to customers with refined focus on improving their visibility into the entire IT estate, accelerating cloud migrations, and bringing a new level of governance + AI-based operations to Google Cloud. These integrations will start becoming available in June. If you are interested in learning more about the partnership and connecting with an expert at Google, please fill out this form.
Quelle: Google Cloud Platform

Struggling to fix Kubernetes over-provisioning? GKE has you covered!

Cost optimization is one of the leading initiatives, challenges, and sources of effort for teams adopting public cloud1—especially for those just starting their journey. When it comes to Kubernetes, cost optimization is especially challenging because you don’t want any efforts you undertake to negatively affect your applications’ performance, stability, or ability to service your business. In other words, reducing costs cannot come at the expense of your users’ experience or risk to your business.If you’re looking for a Kubernetes platform that will help you maximize your business value and at the same time reduce costs, we’ve got you covered with Google Kubernetes Engine (GKE), which provides several advanced cost-optimization features and capabilities built-in. This is great news for teams that are new to Kubernetes, who may not have the expertise to easily balance their applications’ performance and stability, and as a result, tend to over-provision their environments to mitigate potential impact on the business. After all, an over-provisioned environment tends not to run out of headroom or capacity, ensuring that applications meet users’ expectations for performance and reliability.Cost-optimization = reduce cost + achieve performance goals + achieve stability goals + maximize business valueWhile over-provisioning can provide short-term relief (at a financial cost), it’s one of the first things you should look at as part of a continuous cost-optimization initiative. But if you’ve tried to cut back on over-provisioning before—especially for other Kubernetes platforms—you’ve probably found yourself experimenting with random configurations and trying different cluster setups. As such, it’s not uncommon for teams to give up on cost optimization due to the amount of effort they put in relative to the results. Let’s take a look at how GKE differs from other Kubernetes managed services, and how it can reduce your need to over-provision and simplify your cost-optimization efforts.The most common Kubernetes over-provisioning problemsBefore jumping into GKE features and solutions that can help you optimize your costs, let’s first define the three main challenges that lead to over-provisioning of Kubernetes clusters.Bin packing – how well you pack applications onto your Kubernetes nodes. The better you pack apps onto nodes, the more you save.App right-sizing – the ability to set appropriate resources requests and workload autoscale configurations for the applications deployed in the cluster. The more precisely you set accurate resources to your pods, the more reliably your applications will run and, in the vast majority of the cases, the more space you’ll save in the cluster. Scaling down during off-peak hours – Ideally, to save money during periods of low demand, for example at night, you should scale down your cluster along with actual traffic. However, there are cases when this doesn’t happen as expected, especially for workloads or cluster configurations that block Cluster Autoscaler.In our experience, the most over-provisioned environments tend to have at least two of the above challenges. In order to effectively cost-optimize your environment, you should embrace a culture that encourages a continuous focus on the issues that lead to over-provisioning. Tackling over-provisioning with GKEImplementing a custom monitoring system is a common approach for reducing your reliance on over-provisioned resources. For bin packing, you can compare allocatable vs. requested resources; for app rightsizing, requested vs. used resources; and for cluster utilization, you can monitor for Cluster Autoscaler being unable to scale down. However, implementing such a monitoring system is quite complex and requires the platform to provide specific metrics, resource recommendations, template dashboards and alerting policies. To learn how to build such a system yourself, check out our Monitoring your GKE clusters for cost-optimization tutorial, where we show you how to set up this kind of continuous cost-optimization monitoring environment, so that you can tune your GKE clusters according to recommendations without compromising your applications’ performance and stability.Another element of a GKE environment that plays a fundamental role in cost optimization is Cluster Autoscaler, which provides nodes for Pods that don’t have a place to run and removes underutilized nodes. In GKE, Cluster Autoscaler is optimized for the cost of the infrastructure, meaning, if there are two or more node types in the cluster, it chooses the least expensive one that fits the current demand. If your cluster is not scaling down as expected, take a look at your cluster autoscaler events to understand the root cause. You may have set a higher than needed minimum node-pool size or your Cluster Autoscaler may not be able to delete some nodes because certain Pods may cause temporary disruption if restarted. Some examples are: system Pods (such as metrics-server and kube-dns), and Pods that use local storage. To learn how to handle such scenarios, please take a look at our best practices. And if you determine that you really do need to over-provision your workload to properly handle spikes during the day, you can reduce the cost by setting up scheduled autoscalers. GKE’s cost-optimization superpowersGKE also provides many other unique modes and features that may make you forget about having to do things like bin packing and app rightsizing. For example:GKE AutopilotGKE Autopilot is our best ever GKE mode that also delivers the ultimate cost-optimization superpower. In GKE Autopilot, you only pay for the resources you request, effortlessly, getting rid of one of the biggest sources of waste—bin packing. That, and the fact that Autopilot automatically applies industry best practices, eliminates all node management operations, maximizes cluster efficiency and provides a stronger security posture. And, with less infrastructure to manage, Autopilot can help you cut down even further on deployment man-hours and day-two operations.If you decide not to use GKE Autopilot but still want to use the most cost-optimized defaults, check out GKE’s built-in “Cost-optimized cluster” set-up guide, which will get you started with the key infrastructure features and settings you need to know about.Node auto-provisioningBin packing is a complex problem, and even with a decent monitoring system like the one presented above, it requires constant manual tweaks. GKE removes the friction and operational costs associated with precise node-pool tweaking with node auto-provisioning, which automatically creates—and deletes—the most appropriate node pools for a scheduled workload. Node auto-provisioning is the evolution of Cluster Autoscaler, but with better cost savings and less knowledge and effort on your part. Then, if you want to pack your node pools even more, you can further select the optimize-utilization profile, which preferences scheduling Pods on the most utilized nodes and it makes Cluster Autoscaler even more aggressive at scaling down. Beyond making cluster autoscaling fully automatic, this setup also maintains the least expensive configuration.Pod AutoscalersApp rightsizing requires you to fully understand the capacity of all your applications or, again, pass that responsibility over to us. In addition to the classic Horizontal Pod Autoscaler, GKE also provides a Vertical Pod Autoscaler and a Multidimensional Pod Autoscaler. Horizontal Pod Autoscaler is best for responding to spiky traffic by quickly adding more Pods to your cluster. Vertical Pod Autoscaler lets you rightsize your application by figuring out, over time, your Pod’s capacity in terms of cpu and memory. Last but not least, Multidimensional Pod Autoscaler lets you define these two autoscaler behaviors using a single Kubernetes resource. These workload autoscalers give you the ability to automatically rightsize your application and, at the same time, quickly respond to traffic volatility in a cost-optimized way.Optimized machine typesBeyond the above solutions to the most common over-provisioning problems, GKE also helps you reduce costs by using E2 machine types by default. E2 machines are cost-optimized VMs that offer 31% savings compared to N1 machines. Or choose our new Tau machines, available in Q3 2021, which offer a whopping 42% better price-performance over comparable general-purpose offerings. Moreover, GKE also gives you the option to choose Preemptible VMs, which are up to 80% cheaper than standard Compute Engine VMs. (However, we recommend you to read our best practices to make sure your workload will run smoothly on top of Preemptible VMs.) Ensuring operational efficienciesOptimizing costs isn’t just about looking at your underlying compute capacity—another important consideration is the operational cost of building, maintaining, and securing your platform. While that often gets overlooked when calculating total cost of ownership (TCO), it’s nevertheless important to keep in mind.To help save man-hours, GKE provides the easiest fully managed Kubernetes environment on the market. With the GKE Console, gcloud command line, terraform or Kubernetes Resource Model, you can quickly and easily configure regional clusters with a high-availability control plane, auto-repair, auto-upgrade, native security features, automated operation, SLO-based monitoring, etc.Last but not least, GKE is unmatched in its ability to scale a single cluster to 15,000 nodes. For the vast majority of users, this removes scalability as a constraint in your cluster design and pushes the boundaries of cost, performance and efficiency for hyper-scaled workloads when you need it. In fact, we see up to 50% greater infrastructure utilization in large clusters, where key GKE capabilities have been considered and applied. What our customers are saying about their experience with GKEMarket Logic makes a marketing insights platform and says GKE four-way auto scaling and multi-cluster support helped it minimize its maintenance time and costs.“Since migrating to GKE, we’ve halved the costs of running our nodes, reduced our maintenance work, and gained the ability to scale up and down effortlessly and automatically according to demand. All our customer production loads and development environment run on GKE, and we’ve never faced a critical incident since.” – Helge Rennicke, Director of Software Development, Market Logic SoftwareSee more details in Market Logic: Helping leading brands run an insights-driven business with a scalable platformBy switching to a containerized solution on Google Kubernetes Engine, Konga, Nigeria’s online marketplace, cut cloud infrastructure costs by two-thirds.“With Google Kubernetes Engine, we deliver the same or better functionality as previously in terms of being able to scale up to match traffic, but in its lowest state, the overall running cost of the production cluster is much less than the minimum costs we’d pay with the previous architecture.” – Andrew Mori, Director of Technology, KongaRead more in Konga: Cutting cloud infrastructure costs by two-thirds What’s nextBuilding a cost optimization culture and routines into your organization can help you balance performance, reliability and cost. This in turn will give your team and business a competitive edge, helping you focus on innovation. GKE includes many features that can greatly simplify your cost-optimization initiatives. To get the most from the platform, make sure developers and operators are aligned on the importance of cost-optimization as a continuous discipline. To help, we’ve prepared a set of materials: our GKE cost-optimization best practices, a 5 minute video series (if you want to learn on the go), cost-optimization tutorials, and a self-service hands-on workshop to help you practice your skills. Moreover, we strongly encourage you to create internal discussion groups, and run internal workshops to ensure all your teams get the most out of GKE. Last but not least, watch this space! We look forward to publishing more blog posts about cost optimization on GKE in the coming months!1. https://info.flexera.com/CM-REPORT-State-of-the-Cloud
Quelle: Google Cloud Platform

BigQuery row-level security enables more granular access to data

Data security is an ongoing concern for anyone managing a data warehouse. Organizations need to control access to data, down to the granular level, for secure access to data both internally and externally. With the complexity of data platforms increasing day by day, it’s become even more critical to identify and monitor access to sensitive data. In many cases, sensitive data is co-mingled with non-sensitive data, and access restrictions to sensitive data need to be enabled based on factors like data location or presence of financial information. There may also be nuances where data is sensitive for some groups of users, while for others, it is not. Today, we’re pleased to announce the general availability of BigQuery row-level security, which gives customers a way to control access to subsets of data in the same table for different groups of users. Row-level security (RLS) extends the principle of least privilege access and enables fine-grained access control policies in BigQuery tables. BigQuery currently supports access controls at the project-, dataset-, table- and column-level. Adding RLS to the portfolio of access controls now enables customers to filter and define access to specific rows in a table based on qualifying user conditions—providing much needed peace of mind for data professionals. “Our digital transformation and migration of data to the cloud magnifies the business value we can extract from our information assets. However, granular data access control is essential to comply with international regulatory and contractual requirements. BigQuery row-level security helps us comply with data residency and export restrictions,” says Jarrett Garcia, Iron Mountain’s Enterprise Data Platform Senior Director. “It enables us to manage fine-grained access controls without replicating data. What used to take months for approval and access provisioning can now be done more efficiently and effectively. We are looking forward to implementing additional data security capabilities on the BigQuery roadmap to address other critical business use cases.”How BigQuery row-level security worksRow-level security in BigQuery enables different user personas access to subsets of data in the same table. Customers who are currently using authorized views to enable these use cases can leverage RLS for ease of management. To express the concept of RLS, we have introduced a new entity in BigQuery called row access policy. Row access policies map a group of user principals to the rows that they can see, defined by a SQL filter predicate. Secure logic rules created by data owners and administrators determines which user can see which rows through the creation of a row-level access policy. The row-level access policies created on a target table by administrators or data owners are applied when a query is run on the table. One table can have multiple policies applied to it.Below is an example, where row-level access policies have been created to filter data based on users’ “region”.Click to enlargeIn the illustrated scenario above, row-level access policies have been created to verify a querying user’s region and to give them access only to the subset of data relevant to that region. Access policies are granted to a grantee list which support all types of IAM principles such as individual users, groups, domains or service accounts. In this example, when a user queries the table, row-level access policies are evaluated to assess which, if any, policies are applicable to that user. The group ‘sales-apac’ is granted access to view a subset of rows where region = ‘APAC’ whereas the group ‘sales-us’ is granted access to view a subset of rows where the region = ’US’. Likewise, users in both groups will see rows in both regions, and users in neither group will not see any rows.Row-level access policies can also be created using the SESSION_USER() function to restrict access only to rows that belong to the user running the query. If none of the row access policies are applicable to the querying user, the user will have no access to the data in the table.When a user queries a table with a row-level access policy, BigQuery displays a banner notice indicating that their results may be filtered by a row-level access policy. This notice displays even if the user is a member of the `grantee_list`.Click to enlargeWhen to put BigQuery row-level security to workRow-level access policies are useful when you have a need to limit access to data based on filter conditions. The row-access policies’ filter predicate supports arbitrary SQL, and is conceptually similar to the WHERE clause of a SQL query. Filter predicates support the SESSION_USER() function to restrict access only to rows that belong to the user running the query. If none of the row access policies are applicable to the querying user, the user will have no access to the data in the table. Currently, the column used for filtering must be in the table, but we anticipate adding support for subqueries in the filter expression, opening up access to use cases where data is filtered based on lookup tables and calculated values. Row-level access policies can be created, updated and dropped using DDL statements. You will be able to see the list of row-level access policies applied to a table using the BigQuery schema pane in the Cloud Console,  which simplifies the management of policies per table, or by using the bq command-line tool.Click to enlargeRow-level security is compatible with other BigQuery security features, and can be used along with column-level security for further granularity.  Since row-level access policies are applied on the source tables, any actions performed on the table will inherit the table’s associated access policies, to ensure access to secure data is protected. Row-level access policies are applicable to every method used to access BigQuery data (API, Views, etc). Try it outWe’re always working to enhance BigQuery’s (and Google Cloud’s) data governance capabilities, to provide more controls around managing your data. With row-level security, we are adding deeper protections for your data. You can learn more about BigQuery row-level security in our documentation and best practices.Related ArticleData governance in Google Cloud–new ways to securely access and discover dataAs organizations bring ever more sensitive data analytics workloads to the cloud, BigQuery column-level security, now GA, provides fine-g…Read Article
Quelle: Google Cloud Platform

Leveraging BigQuery Public Boundaries datasets for geospatial analytics

Geospatial data is a critical component for a comprehensive analytics strategy. Whether you are trying to visualize data using geospatial parameters or do deeper analysis or modeling on customer distribution or proximity, most organizations have some type of geospatial data they would like to use – whether it be customer zipcodes, store locations, or shipping addresses. However, converting geographic data into the correct format for analysis and aggregation at different levels can be difficult. In this post, we’ll walk through some examples of how you can leverage the Google Cloud platform alongside Google Cloud Public Datasets to perform robust analytics on geographic data. The full queries can be accessed from this notebook here. Public US Geo Boundaries datasetBigQuery hosts a slew of public datasets for you to access and integrate into your analytics. Google pays for the storage of these datasets and provides public access to the data via the bigquery-public-data project. You only pay for queries against the data. Plus, the first 1 TB per month is free! These public datasets are valuable on their own, but when joined against your own data they can unlock new analytics use cases and save the team a lot of time. Within the Google Cloud Public Datasets Program there are several geographic datasets. Here, we’ll work with the geo_us_boundaries dataset, which contains a set of tables that have the boundaries of different geospatial areas as polygons and coordinates based on the center point (GEOGRAPHY column type in BigQuery), published by the US Census Bureau.Mapping geospatial points to hierarchical areasMany times you will find yourself in situations where you have a string representing an address. However, most tools require lat/long coordinates to actually plot points. Using theGoogle Maps Geocoding API we can convert an address into a lat/long and then store the results in the BigQuery table. With a lat/long representation of our point, we can join our initial dataset back onto any of the tables here using the ST_WITHIN function. This allows us to check and see if a point is within the specified polygon. ST_WITHIN(geography_1, geography_2)This can be helpful for ensuring standard nomenclature; for example, metropolitan areas that might be named differently. The query below maps each customers’ address to a given metropolitan area name.It can also be useful for converting to designated market area (DMA), which is often used in creating targeted digital marketing campaigns.Or for filling in missing information; for example, some addresses may be missing zip code which results in incorrect calculations when aggregating up to the zipcode level. By joining onto the zip_codes table we can ensure all coordinates are mapped appropriately and aggregate up from there.Note that the zip code table isn’t a comprehensive list of all US zip codes, they are zip code tabulation areas (ZCTAs). Details about the differences can be found here. Additionally, the zip code table gives us hierarchical information, which allows us to perform more meaningful analytics. One example is leveraging hierarchical drilling in Looker. I can aggregate my total sales up to the country level, and then drill down to state, city and zipcode to identify where sales are highest. You can also use the BigQuery GeoViz tool to visualize geospatial data!Aside from simply checking if a point is within an area, we can also use ST_DISTANCE to do something like find the closest city using the centerpoint for the metropolitan area table. This concept doesn’t just hold true for points, we can also leverage other GIS functions to see if a geospatial area is contained within areas that are listed in the boundaries datasets. If your data comes into BigQuery as a GeoJSON string, we can convert it to a GEOGRAPHY type using the ST_GEOGFROMGEOJSON function. Once our data is in a GEOGRAPHY type we can do things like check to see what urban area the geo is within – using either ST_WITHIN or ST_INTERSECTS to account for partial coverage. Here, I am using the customer’s zip code to find all metropolitan divisions where the zip code polygon and the metropolitan polygon intersect. I am then selecting the metropolitan area that has the most overlap (or the intersection has the largest area) to be the customer’s metro that we use for reporting.The same ideas can be applied to the other tables in the dataset including the county, urban areas and National Weather Service forecast regions (which can also be useful if you want to join your datasets onto weather data).Correcting for data discrepancyOne problem that we may run into when working with geospatial data is that different data sources may have different representations of the same information. For example, you might have one system that records state as a two letter abbreviation and another using the full name. Here, we can use the state table to join the different datasets.Another example might be using the tables as a source of truth for fuzzy matching. If the address is a manually entered field somewhere in your application, there is a good chance that things will be misspelled. Different representations of the same name may prevent tables from joining with each other or lead to duplicate entries when performing aggregations. Here, I use a simple Soundex algorithm to generate a code for each county name, using helper functions fromthis blog post. We can see that even though some are misspelled they have the same Soundex code.Next, we can join back onto our counties table so we make sure to use the correct spelling of the county name. Then, we can simply aggregate our data for more accurate reporting. Note that fuzzy matching definitely isn’t perfect and you might need to try different methods or apply certain filters for it to work best depending on the specifics of your data.The US Geo Boundary datasets allow you to perform meaningful geographic analysis without needing to worry about extracting, transforming or loading additional datasets into BigQuery. These datasets, along with all the other Google Cloud Public Datasets, will be available in the Analytics Hub. Please sign up for the Analytics Hub preview, which is scheduled to be available in the third quarter of 2021, by going to g.co/cloud/analytics-hub.Related ArticleIntroducing Analytics Hub: secure and scalable sharing for data and analyticsAnalytics Hub makes data sharing across organizations secure and easyRead Article
Quelle: Google Cloud Platform

Are we there yet? Thoughts on assessing an SRE team’s maturity

One facet of our work as Customer Reliability Engineers—Google Site Reliability Engineers (SREs) tapped to help Google Cloud customers develop that practice in their own organizations—is advising operations or SRE teams to improve their operational maturity. We’ve noticed a recurring question cropping up across many of these discussions, usually phrased along the lines of “is what we’re currently doing ‘SRE work’?” or, with a little more existential dread, “can we call ourselves SREs yet?”We’ve answered this question before with a list of practices from the SRE workbook. But the list is long on the what and short on the why, which can make it hard to digest for folks already suffering an identity crisis. Instead, we hope to help answer this question by discussing some principles we consider fundamental to how an SRE team operates. We’ll examine why they’re important and suggest questions that characterize a team’s progress towards embodying them. Are we there yet?This question is asked in different ways, for a myriad of different reasons, and it can be quite hard to answer due to the wide range of different circumstances that our customers operate in. Moreover, CRE, and Google in general, is not the final arbiter of what is and isn’t “SRE” for your organization, so we can’t provide an authoritative answer, if one even exists. We can only influence you and the community at large by expressing our opinions and experiences, in person or via our books and blog posts. Further, discussions of this topic tend to be complicated by the fact that the term “SRE” is used interchangeably to mean three things:A job role primarily focused on maintaining the reliability of a service or product.A group of peopleworking within an organization, usually in the above job role.A set of principles and practices that the above people can utilize to improve service reliability.When people ask “can we call ourselves SREs yet?” we could interpret it as a desire to link these three definitions together. A clearer restatement of this interpretation might be: “Is our group sufficiently advanced in our application of the principles and practices that we can justifiably term our job role SRE?” We should stress that we’re not saying that you need a clearly defined job role—or even a team—before you can start utilizing the principles and practices to do things that are recognizably SRE-like. Job roles and teams crystallize from a more fluid set of responsibilities as organizations grow larger. But as this process plays out, the people involved may feel less certain of the scope of their responsibilities, precipitating the ‘are we there yet?’ question. We suspect that’s where the tone of existential dread comes from…Key SRE indicatorsWithin the CRE team here at Google Cloud, the ‘are we there yet?’ question surfaced a wide variety of opinions about the core principles that should guide an SRE team. We did manage to reach a rough consensus, with one proviso—the answer is partially dependent on how a team engages with the services it supports.We’ve chosen to structure this post around a set of principles that we would broadly expect groups of people working as SREs that directly support services in production to adhere to. As in a litmus test, this won’t provide pin-point accuracy; but in our collective opinion at least, alignment with most of the principles laid out below is a good signal that a team is practicing something that can recognizably be termed Site Reliability Engineering.Directly engaged SRE teams are usually considered Accountable (in RACI terms) for the service’s reliability, with Responsibility shared between the SRE and development teams. As a team provides less direct support these indicators may be less applicable. We hope those teams can still adapt the principles to their own circumstances. To illustrate how you might do this, for each principle we’ve given a counter-example of a team of SREs operating in an advisory capacity. They’re subject-matter experts who are Consulted by development teams who are themselves Responsible and Accountable for service reliability.Wherever your engagement model lies on the spectrum, being perceived by the rest of the organization as jointly responsible for a service’s reliability, or as reliability subject-matter experts, is a key indicator of SRE-hood.Principle #1: SREs mitigate present and future incidentsThis principle is the one that usually underlies the perception of responsibility and accountability for a service’s reliability. All the careful engineering and active regulation in the world can’t guarantee reliability, especially in complex distributed systems—sometimes, things go wrong unexpectedly and the only thing left to do is react, mitigate, and fix. SREs have both the authority and the technical capability to act fast to restore service in these situations.But mitigating the immediate problem isn’t enough. If it can happen again tomorrow, then tomorrow isn’t better than today, so SREs should work to understand the precipitating factors of incidents and propose changes that remediate the entire class of problem in the infrastructure they are responsible for. Don’t have the same outage again next month!How unique are your outages? Ask yourself these questions:Can you mitigate the majority of the incidents without needing specialist knowledge from the development team?Do you maintain training materials and practice incident response scenarios?After a major outage happens to your service, are you a key participant in blamelessly figuring out what really went wrong, and how to prevent future outages?Now, for a counter example. In many organizations, SREs are a scarce resource and may add more value by developing platforms and best practices to uplift large swathes of the company, rather than being primarily focused on incident response. Thus, a consulting SRE team would probably not be directly involved in mitigating most incidents, though they may be called on to coordinate incident response for a widespread outage. Rather than authoring training materials and postmortems, they would be responsible for reviewing those created by the teams they advise.Principle #2: SREs actively regulate service reliabilityReliability goals and feedback signals are fundamental for both motivating SRE work and influencing the prioritization of development work. At Google, we call our reliability goals Service Level Objectives and our feedback signals Error Budgets, and you can read more about how we use them in the Site Reliability Workbook.Do your reliability signals affect your organization’s priorities? Ask yourself these questions:Do you agree on goals for the reliability of the services you support with your organization, and track performance against those goals in real time?Do you have an established feedback loop that moderates the behaviour of the organization based on recent service reliability?Do you have the influence to effect change within the organization in pursuit of the reliability goals?Do you have the agency to refuse, or negotiate looser goals, when asked to make changes that may cause a service to miss its current reliability goals?Each question builds on the last. It is almost impossible to establish a data-driven feedback loop without a well-defined and measured reliability goal. For those goals to be meaningful, SREs must have the capability to defend them. Periods of lower service reliability should result in consequences that temporarily reduce the aggregate risk of future production changes and shift engineering priorities towards reliability. When it comes down to a choice between service reliability and the rollout of new but unreliable features, SREs need to be able to say “no”. This should be a data driven decision—when there’s not enough spare error budget, there needs to be a valid business reason for making users unhappy. Sometimes, of course, there will be, and this can be accommodated with new, lower SLO targets that reflect the relaxed reliability requirements.Consultant SREs, in contrast, help teams draft their reliability goals and may develop shared monitoring infrastructure for measuring them across the organization. They are the de-facto regulators of the reliability feedback loop and maintain the policy documents that underpin it. Their connection to many teams and services gives them broader insights that can spark cross-functional reliability improvements. Principle #3: SREs engage early and comprehensivelyAs we said earlier, SREs should be empowered to make tomorrow better than today. Without the ability to change the code and configuration of the services they support, they cannot fix problems as they encounter them. Involving SREs earlier in the design process can head off common reliability anti-patterns that are costly to correct post-facto. And, with the ability to influence architectural decision making, SREs can drive convergence across an organization so that work to increase the reliability of one service can benefit the entire company.Is your team actively working to make tomorrow better than today? Ask yourself these questions, which go from fine detail to a broad, high-level scope:Do you engineer your service now to improve its reliability, e.g. by viewing and modifying the source code and/or configuration?Are you involved in analysis and design of future iterations of your service, providing a lens on reliability/operability/maintainability?Can you influence your organization’s wider architectural decision making?Advising other teams naturally shifts priorities away from directly modifying the configuration or code of individual services. But consultant SREs may still maintain frameworks or shared libraries providing core reliability features, like exporting common metrics or graceful service degradation. Their breadth of engagements across many teams makes them naturally suited for providing high-level architectural advice to improve reliability across an entire organization.Principle #4: SREs automate anything repetitiveFinally, SREs believe that computers are fundamentally better suited to doing repetitive work than humans are. People often underestimate the returns on investment when considering whether to automate a routine task, and that’s before factoring in the exponential growth curve that comes with running a large, successful service. Moreover, computers never become inattentive and make mistakes when doing the same task for the hundredth time, or become demoralized and quit. Hiring or training SREs is expensive and time-consuming, so a successful SRE organization depends heavily on making computers do the grunt work.Are you sufficiently automating your work? Ask yourself these questions:Do you use—or create—automation and other tools to ensure that operational load won’t scale linearly with organic growth or the number of services you support?Do you try to measure repetitive work on your team, and reduce it over time?A call for reflectionMost blog posts end with a call for action. We’d rather you took time to reflect, instead of jumping up to make changes straight after reading. There’s a risk, when writing an opinionated piece like this, that the lines drawn in the sand are used to divide, not to grow and improve. We promise this isn’t a deliberate effort to gatekeep SRE and exclude those who don’t tick the boxes; we see no value in that. But in some ways gatekeeping is what job roles are designed to do, because specialization and the division of labour is critical to the success of any organization, and this makes it hard to avoid drawing those lines.For those who aspire to call themselves SREs, or are concerned that others may disagree with their characterization of themselves as SREs, perhaps these opinions can assuage some of that existential dread.
Quelle: Google Cloud Platform