Making it easier to manage Windows Server VMs

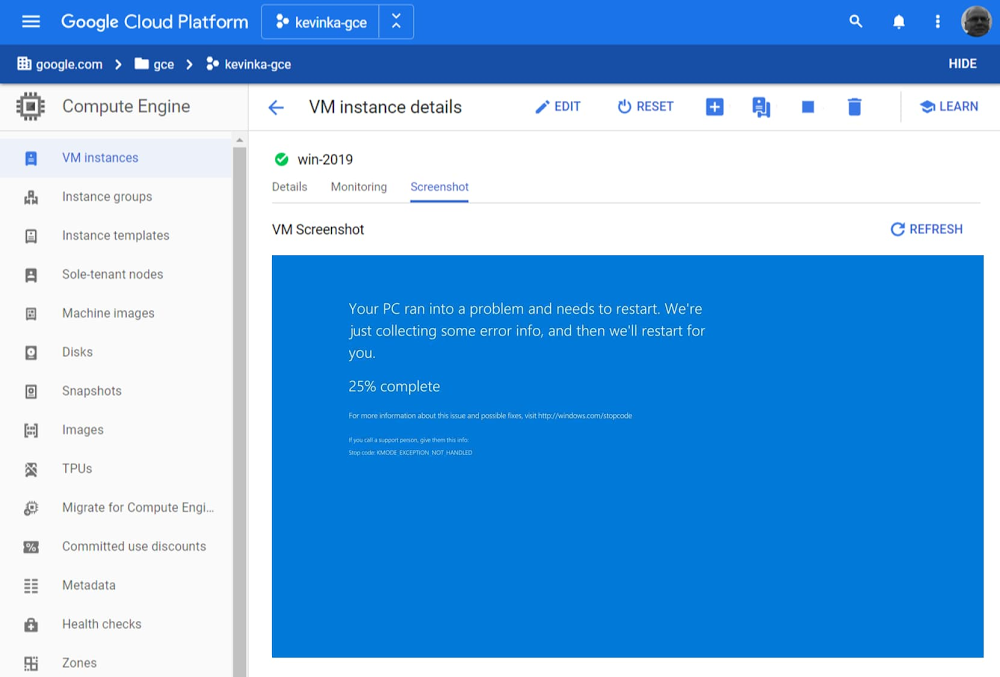
Google Cloud provides a first-class experience for migrating and modernizing Windows workloads. Organizations choose Google Cloud for reliability, performance, and cost savings from the underlying infrastructure, as well as for features, tooling and guidance that helps them modernize. Companies like Geotab rely on Google Cloud to keep ahead of change and increased demand, and reduce licensing costs by modernizing from a proprietary stack to open-source. We’re also incredibly proud to have earned the recognition of analyst firms such as IDC for helping companies migrate and modernize their Windows-based workloads.Today we’re announcing a number of new features that will make running Windows Server workloads in Google Cloud easier: boot-screen diagnostics, auto-upgrade for Windows Server, new diagnostics tooling, and improved license reporting. Read on to learn about these new features.  Boot-screen diagnostics (beta)Windows VMs often rely on a virtual display device to report certain errors, and when connecting by Remote Desktop Protocol (RDP) doesn’t work, accessing the virtual display screen becomes a necessity. Building on the Virtual Displays feature we launched last year, we’re now enabling you to more easily troubleshoot Windows VMs by capturing boot-screen screenshots without having to RDP into the machine. Capturing a screenshot from a VM can help diagnose issues if VMs are not otherwise accessible, for example, during the boot process, or if trying to start a VM with a corrupted disk image.For those of us who miss seeing this blue screen, it is now viewable directly from within the Cloud Console :-)Auto-upgrade for Windows 2008 (beta)Many customers are still using Windows Server 2008 even after end-of-service was reached earlier this year. We want to make it easier for you to upgrade your instances by performing an in-place auto-upgrade for Windows Server 2008 using a single gcloud command. This command backs up your current VM, performs the upgrade, and handles roll-backs automatically if something fails. You can quickly test if a Windows OS in-place upgrade will work and then automate upgrades at scale. Collect diagnostic information (beta)When you try to troubleshoot your Windows VMs or reach out to Google Cloud Support, it can be hard to provide all the necessary diagnostic information that you need to quickly and effectively troubleshoot a problem. A new diagnostic tool for Windows VMs helps collect all the necessary information so you can either troubleshoot the issue yourself or provide the necessary diagnostic information to Support. License reporting toolingIf you bring your own Windows licenses to Google Cloud, calculating licensing usage for Microsoft Enterprise Agreement True-ups and audits can be an onerous task. We have often seen customer procurement, engineering, and operations teams work for months to generate the data to satisfy complex licensing reporting needs. Further, these complex reports often need to be analyzed to identify high watermarks for physical server usage or understand license usage at any given time. For those of you running on sole-tenant nodes, the new Windows licensing reporting tool automates this process so you can quickly and comprehensively generate reports to quantify your physical server usage. The tool, which runs in a Windows environment, ingests log data and outputs graphical results and reports to users. Envision easier Windows managementTogether, we hope these new features will make it easier for you to troubleshoot problems, upgrade, and manage the license requirements of Windows workloads running on Google Cloud. And we’re not done yet—stay tuned as we work to make Google Cloud the best platform on which to migrate, optimize, and modernize your Windows workloads, all with enterprise-class, Microsoft-backed support. Click here to learn more about running Windows on Google Cloud.Related ArticleDriving change: How Geotab is modernizing applications with Google CloudOver time, Geotab converted production servers running Windows Server to containers and open source, saving hundreds of thousands of doll…Read Article
Quelle: Google Cloud Platform

Export data from Cloud SQL without performance overhead

While there are a variety of reasons to export data out of your databases – such as to maintain backups, meet regulatory data retention policies, or feed downstream analytics – exports can put undue strain on your production systems, making them challenging to schedule and manage. To eliminate that resource strain, we’ve launched a new feature for Cloud SQL: serverless exports. Serverless exports enables you to export data from your MySQL and PostgreSQL database instances without any impact on performance or risk to your production workloads.Cloud SQL exports, which offer portable data formats (SQL, CSV), can be triggered anytime and are written to Cloud Storage buckets that you control.If you need to meet regulatory requirements around data retention, you can easily send exports to buckets with Bucket Lock enabled. Bucket Lock allows you to configure a data retention policy for a Cloud Storage bucket that governs how long objects in the bucket must be retained. It also allows you to lock the data retention policy, permanently preventing the policy from being reduced or removed.As another example, you can export data to CSV based on a custom query, then import the data directly to BigQuery for analytics. And if this is for regular reporting, you can schedule a recurring import with Data Transfer Service or Cloud Scheduler.Using the new serverless export feature ensures these exports won’t bog down your Cloud SQL database instance, so you can continue to run predictably and reliably. And until February 2021, you can use serverless exports at no charge.What’s next for Cloud SQLWe’re excited to see what you build with the new serverless exports feature. Have more ideas? Let us know what other features and capabilities you need with our Issue Tracker and by joining the Cloud SQL discussion group. We’re glad you’re along for the ride, and we look forward to your feedback!Related ArticleMySQL 8 is ready for the enterprise with Cloud SQLCloud SQL, our fully managed database service for MySQL, PostgreSQL, and SQL Server, now supports MySQL 8. As a managed service, MySQL 8 …Read Article
Quelle: Google Cloud Platform

Better outcomes with AI: Frost & Sullivan names Microsoft the leading AI platform for healthcare IT

In early 2020, Frost & Sullivan recognized Microsoft as the “undisputed leader” in global Artificial Intelligence (AI) platforms for the Healthcare IT (HCIT) sector on the Frost Radar™. In a field of more than 200 global industry participants, Frost & Sullivan independently plotted the top 20 companies across various parameters indicative of growth and innovation, available for consumption here.

According to Frost & Sullivan, the global AI HCIT market is on a rapid growth trajectory, with sales of AI-enabled HCIT products expected to generate more than $34.83 billion globally by 2025. Government agencies will contribute almost 50.7 percent of the revenue (including public payers), followed by hospital providers (36.3 percent) and physician practices (13 percent). Clinical AI solutions will drive 40 percent of the market revenue, with financial AI solutions contributing the same, and the remaining 20 percent coming from sales of operational AI solutions. Globally, Microsoft earned the top spot because of its industry-leading effort to incorporate next-generation AI infrastructure to drive precision medicine workflows, aid population health analytics, propel evidence-based clinical research, and expedite drug and treatment discovery.

Figure 1: The Frost Radar, "Global AI for Healthcare IT Market", 2020

We’re seeing providers deploy chatbots in their virtual portals to extend 24/7, personalized care to patients, helping them triage a larger volume of inquiries and even extend care services to previously inaccessible remote areas. With the power of predictive analytics, care teams can predict patient volumes and provide preventative care to provide timely escalations of care and prevent unnecessary readmissions. AI has provided tools for scientists at the forefront of precision medicine, accelerating drug discovery, while aiding public health officials with modeling and predicting the progression of disease. In BioPharma and MedTech, AI is being used to provide real-time insights around equipment use for manufacturing R&D departments, while also deploying field technicians to service costly equipment via predictive maintenance and enabling healthcare customers to track inventory and medication across supply chains with greater transparency and agility.

The report cites numerous recent innovations from Microsoft, including the Microsoft Cloud for Healthcare offering, announced in 2020. The Microsoft Cloud for Healthcare brings together trusted and integrated capabilities for customers and partners that enrich patient engagement and connects health teams to help improve collaboration, decision-making, and operational efficiencies. It makes it faster and easier to provide more efficient care and help ensure end-to-end security, compliance, and accessibility of health data.

At Microsoft, we are focused on trust and on empowering our healthcare customers—never monetizing customer or patient data. The Microsoft Cloud for Healthcare also offers an infrastructure built on industry leading scale, with over $15 billion invested in cloud infrastructure and over 1 million physical servers across over 60 global regions. Furthermore, Microsoft has the largest partner ecosystem in the market, with global partners equipped to work with health organizations of all sizes.

Healthcare AI at Microsoft

Microsoft’s growing portfolio of healthcare AI offerings also includes specific services such as:

The Microsoft Health Bot enables health organizations to build and deploy AI-powered, compliant conversational healthcare experiences. With built-in medical intelligence and natural language capabilities, and extensibility tools, the Health bot enables health organizations to build personalized and trusted conversational experiences across digital health portals. Customers such as Premera Blue Cross have leveraged the Microsoft Health Bot to create their own chatbot, Premera Scout, to help customers quickly obtain information on claims, benefits, and other services offered by Premera across their digital portals. In another instance, Walgreens Boots Alliance (WBA) incorporated the Microsoft Healthcare Bot to add a COVID-19 Risk Assessment capability to their website, helping customers quickly find answers to common questions.
Text Analytics for Health is a feature of Azure Cognitive Services that helps health organizations process and extract insights from unstructured medical data (such as; doctor’s notes, medical publications, electronic health records, clinical trial protocols, and more). This enables researchers, analysts, and medical professionals to unlock scenarios based on entities in health data, such as matching patients to clinical trials and extracting insights from large bodies of clinical literature, as was the case when the University College London (UCL) leveraged Text Analytics for health to build a system that identifies relevant research for reviews as and when they are published.
Azure Cognitive Services offers easy-to-deploy AI tools for speech recognition, computer vision, and language understanding. Nuance, a leading provider of AI-powered clinical documentation and decision-making support for physicians, leveraged the Azure Cognitive Services platform to develop their Dragon Medical One platform, one of the leading services of Ambient Clinical Intelligence. The platform allows doctors to enter and search for relevant patient information in electronic health records, using dictation. This enables physicians to reduce time spent on administrative capabilities and redirect more time toward interacting with the patient. The platform can also mine a patient’s medical history with new reported symptoms at an appointment to provide recommendations of potential diagnoses for the doctor to consider.

Partners empowering healthcare AI

We’re also proud to see many of our healthcare partners recognized in the report, with whom we have partnered to design and build our portfolio of AI services and who, in turn, leverage our platforms to infuse AI in their solutions. These include, but are not limited to:

Nuance is partnering with Microsoft to deliver ambient clinical intelligence (ACI), paving the way for the exam room of the future. Take a look at our partner spotlight, Microsoft and Nuance partner to deliver ambient clinical intelligence.
GE Healthcare is developing advanced solutions for secure imaging and data exchange built on Azure.
Optum, the Health Services platform of UnitedHealth Group, joined forces with Microsoft to launch ProtectWell, a return-to-workplace protocol that enables employers to bring employees back to work in a safe environment. Leveraging clinical and data analytics capabilities, as well as the Microsoft Healthcare Bot service for AI-assisted Covid-19 triaging. Take a look at our partner spotlight, UnitedHealth Group and Microsoft join forces to launch ProtectWell.
Allscripts extended their long-term strategic alliance to harness the power of Microsoft’s platform to develop Sunrise, an integrated EHR that provides a clinician-friendly, evidenced-based platform with integrated analytics for delivering better health outcomes in hospitals. Connecting all aspects of care—including; acute, surgical, pharmacy, and laboratory services, to revenue and patient administration systems.
Philips is empowering providers through image-guided, minimally invasive therapies, bringing live imaging and other sources of data into 3D holographic environments controlled by physicians. Take a look at our partner spotlight, Microsoft HoloLens 2: Partner Spotlight with Philips.

We’re honored to have been recognized as a leader in the healthcare space and are proud to work with a growing ecosystem of partners and customers that are building the next generation of healthcare solutions. Together, we’re extending the reach of healthcare services, unlocking new clinical insights, and empowering care teams to drive better outcomes for the communities they serve. Innovation is a journey without end, and we’re committed to building the trusted tools and platforms to help healthcare organizations be future-ready and invent with purpose.

Next steps with Microsoft AI

To learn more about Microsoft AI offerings, explore the following resources:

Microsoft AI for Health page.
Learn more about the Azure AI platform.
Explore even more Azure for Health offerings, from IoT to Mixed Reality.
Read the latest updates on the Microsoft Healthcare blog.
Learn more about the Microsoft Cloud for Healthcare.

Quelle: Azure

Preparing for what’s next: Building landing zones for successful cloud migrations

As businesses look to the cloud to ensure business resiliency and to spur innovation, we continue to see customer migrations to Azure accelerate. Increasingly, we’ve heard from business leaders preparing to migrate that they could learn from our best practices and want general help thinking about migration, and we started a blog series to help share those even more broadly. In our kick-off blog for this series, we shared that landing zones are a key component to anticipating and mitigating complexities as part of your migration. In this blog, we will cover what landing zones are and the importance of getting cloud destinations ready in advance of the physical migration, as that generates significant benefit in the long-term.

IT and business leaders often ask us about how they can both enable their teams to innovate with agility in Azure and remain compliant within organizational governance, security, and efficiency guardrails. Getting this balance right is critical to cloud migration success. One of the most important questions to getting it right is how to set up destination Azure environments we call landing zones.

At Microsoft, we believe that cloud agility isn’t at odds with setting up the right foundation for migration initiatives—in fact, taking time to do the latter sets organizations up for a faster path to success. Our customers and partners have been using Azure landing zones—a set of architecture guidelines, reference implementations, and code samples based on proven practices—to prepare cloud environments.

“With everybody’s limited budget, especially during the pandemic, the support from both a financial perspective and with FastTrack for Azure backing. I very quickly realized that we could deliver in a quicker timeframe than initially planned. The landing zone was a great initiative because that focused everybody in terms of what are the deliverables? What are we looking to achieve? What technologies are we going to use to do that? Microsoft linked in seamlessly with SoftwareOne and as a customer of both of these companies, it was reassuring for us.” – Gavin Scott, Head of IT, Actavo

What are the key decisions to be made in setting-up your cloud destination?

At the onset of migration initiatives, we see customers and partners focus on the key considerations below to define their ideal operating environment in Azure. These considerations are abstracted as operating models, with “central operations” and “enterprise operations” as two options at different ends of the spectrum.

Old roles versus new opportunities: Migrating to the cloud can modernize many workloads as well as how IT operates. Azure can reduce the volume of repetitive maintenance tasks, unlocking opportunities to apply IT staff expertise in new ways. At the same time, Azure does offer options to preserve practices, controls, and structures that are proven to work. A key decision for leaders is where to land on this spectrum.
Change management versus democratized actions: With greater access to self-service deployment and flexibility for decisions, change management and change control can look different in the cloud. While workload teams typically prefer the agility to quickly make changes to workloads and environments, cloud centers of excellence seek to ensure changes are safe, compliant, and operationally efficient. The key decision for leaders here is how much of cloud governance requirements should be automated.
Standardized versus specialized operations: Creating multiple and connected levels of operational controls in Azure to accommodate specialized needs of various workloads is absolutely possible. Central IT, for instance, can ensure basic operational standards for all workloads, while empowering workload teams to set additional guardrails. The key question for leaders is which day-to-day operations will be performed by central IT teams and which by workload teams.
Architecture; as-is versus re-imagined: The first inclination for most teams might be to simply replicate on-premises design and architectures, “as-is” in Azure. When a low complexity and narrowly scoped estate is moving to cloud, that might be the optimal approach. In time, as migration scopes grow—spanning more applications, databases, and infrastructure components—achieving higher efficiency in Azure becomes even more attractive. A key decision for leaders is which path to take during iterative migration initiatives.

Azure landing zones appropriately guide customers and partners in setting up the desired operating model in Azure. Landing zones ensure that roles, change management, governance, and operations are all considered at the beginning of the journey to achieve the desired balance of agility and governance.

Why are Azure landing zones valuable in implementing your design decisions in the cloud?

Examples from two of our customers on each end of the operating model spectrum illustrate how landing zones guide destination decisions, as well as the implementation path.

The first example is a US-based large manufacturing and distribution company, with operations spanning four continents. This customer aimed to establish “central operations” while retiring a series of data centers that would have otherwise required expensive hardware upgrades. One of the complicating (though not uncommon) factors was each regional subsidiary had distinct governance, security, and operations requirements.

To accelerate this complex migration, with the help of our partners, we started by migrating a single subsidiary, enabling the customer to learn and iterate towards the desired centralized operating model. During the first four weeks, the customer migrated hundreds of low-risk VMs to an Azure landing zone. Within eight weeks, the customer established the final operating model, migrating mission-critical, and sensitive data workloads for their first subsidiary. Other subsidiaries then built on this initial operating model to meet their specific needs. The customer now uses Azure Blueprints and Azure Policy to deploy self-service landing zones to comply with global and local standards. Azure landing zones enabled the customer to successfully mitigate complexity and mold the cloud platform architecture to fit the centralized operating model they were looking for.

The second example comes from one of our customers in Germany preparing to move thousands of servers to Azure. Most of those servers hosted low-complexity, steady-state workloads governed by central operations on-premises. As part of the migration effort, the customer needed to transform and modernize IT operations, including adherence to high security and compliance requirements that were to take effect. In eight weeks, this customer was able to start an Azure environment in alignment with the transformation vision while meeting the new security and compliance requirements. The enterprise-scale flavor of Azure landing zones provided implementation options needed for the destination to meet stringent requirements and enabled the enterprise transformation vision.

For an overview of landing zone and considerations you should make to build your landing zone in Azure, view this Azure landing zones video. 

How are Azure landing zones constructed?

To construct Azure landing zones, customers and partners first clarify how they prefer to deploy their landing zones. Next up are decisions on “design area” configuration options. Let’s take a look at a couple of the “design areas” to demonstrate how they contribute to the construction of landing zones.

Deployment options: How to deploy Azure landing zones is an important early design decision. Each implementation option provides slightly different methods to match the skill level of your team and the operating model. User-interface based options and scripting-based methods, as well as deployments directly from GitHub are available.
Identity: Best practice guidance and enabling capabilities Azure Active Directory, Azure role-based access control (RBAC), and Azure Policy help establish and preserve the right levels of identity and access across the cloud platform. The best practices, decision guides, and references in Azure landing zones help design the foundation with a secure and compliant approach.
Resource organization: Sound governance starts with standards for organizing resources. Naming and tagging standards, subscription design (segmentation of resources), management group hierarchy (consistent organization of segments) are needed to reflect operating model preferences. Landing zones provide the guidance to get started.
Business continuity and disaster recovery (BCDR): Reliability and rapid recovery are essential for business continuity. Design areas within landing zones guide customers to set up destination environments with high degrees of protection and faster recovery options.

“The landing zone that serves as a foundation for customers’ identity, security, networking, operations and governance needs, tends to be a lynchpin of success for future migrations. Claranet prides on getting this right in addition to helping build an excellent post migration operational model. Our collaboration with the Azure Migration Program (AMP) team was tremendously helpful to our customers, bringing the best of what we have with Microsoft’s recommendations and focusing on landing zone to better prepare for their growing cloud portfolio.”—Mark Turner, Cloud Business Unit Director, Claranet

Getting started with Azure landing zones

To guide our customers and partners in getting cloud destination environments ready with Azure landing zones, ready section under the Cloud Adoption Framework (CAF) provides step-by-step, prescriptive guidance. We recommend that customers start with the following three steps within CAF to educate and activate their migration crews:

Begin by determining which cloud operating model reflects the right balance for your agility and governance needs.
Continue onto "design areas" for Azure landing zones for an overview of the configuration options available to achieve your operating model.
Select an Azure landing zone implementation option to match your selected operating model, migration scope, and velocity. Once you’ve identified the best option, deployment instructions and supporting scripts can automatically deploy reference implementations of each Azure landing zone.

Customers truly realize the value of migrations once they have started operating from the cloud. Cloud destinations that enable innovation and agility, while ensuring governance and security are key to accelerate that value realization. Azure landing zones are ready to guide customers and partners in setting-up cloud destinations and, more importantly, for setting-up post-migration success.
Quelle: Azure

NFS 4.1 support for Azure Files is now in preview

Azure Files is a distributed cloud file system serving file system SMB and REST protocols generally available since 2015. Customers love how Azure Files enables them to easily lift and shift their legacy workloads to the cloud without any modifications or changes in technology. SMB works great on both Windows and UNIX operating systems for most use cases. However, because some applications are written for POSIX compliant file systems, our customers wanted to have the same great experience on a fully POSIX compatible NFS file system. Today, it’s our pleasure to announce Azure Files support for NFS v4.1 protocol!

NFS 4.1 support for Azure Files will provide our users with a fully managed NFS file system as a service. This offer is built on a truly distributed resilient storage platform that serves Azure Blobs, Disks, and Queues, to name just a few components of Azure Storage. It is by nature highly available and highly durable. Azure Files also supports full file system access semantics such as strong consistency and advisory byte range locking, and can efficiently serve frequent in-place updates to your data.

Common use cases

Azure Files NFS v4.1 has a broad range of use cases. Most applications written for Linux file systems can run on NFS. Here is a subset of customer use cases we have seen during the limited preview:

Linux application storage:

Shared storage for applications like SAP, storage for images or videos, Internet of Things (IoT) signals, etc. In this context, one of our preview customers said:

“T-Systems is one of the leading SAP outsourcers. We were looking for a highly-performant, highly available, zone redundant Azure native solution to provide NFS file systems for our SAP landscape deployments. We were thrilled so see Azure Files exceeding our performance expectations. We also see a huge cost saving and a reduced complexity compared to other available cloud solutions.”  – Lars Micheel, Head of SAP Solution Delivery and CTO PU SAP.

End user storage:

Shared file storage for end user home directories and home directories for applications like Jupyter Notebooks. Also, some customers used it for lift-and-shift of datacenter NAS data to the cloud in order to reduce the on-premises footprint and expand to more geographic regions with agility. In this context, one of our preview customers said:

“Cloudera is well known for our machine learning capabilities, an industry analyst firm called us a “machine learning – machine” when they named us a leader in a recent report. We needed a high performance NFS file system to match our ML capabilities. Azure Files met all the requirements that Cloudera Machine Learning has for a real filesystem and outperformed all the alternatives. Because it is integrated with the Azure Storage stack, my expectation is that it’s going to be cheaper and far easier to manage than the alternatives as well.”  –  Sean Mackrory, Software Engineer, Cloudera

Container-based applications:

Persistent storage for Docker and Kubernetes environments. We are also launching the preview of CSI driver for Azure files Support for NFS today.

Databases:

Hosting Oracle databases and taking its backups using Recover Manager (RMAN). Azure Files premium tier was purpose-built for database kind of workloads with first parties taking dependencies on it.

Management

You get the same familiar share management experience on Azure Files through Azure portal, PowerShell, and CLI:

Create NFS file share with a few clicks in Azure portal

Security

Azure Files uses AES 256 for encryption at rest. You also have the option to encrypt all of your data using the keys that you own, managed by the Azure Key Vault. Your share can be accessed from within a region, from another region, or from on-premises by configuring secure virtual networks to allow NFS traffic privately between your volume and destination. Data coming to NFS shares has to emerge from a trusted VNet. All access to the NFS share is denied by default unless access is explicitly granted by configuring right network security rules.

Performance

The NFS protocol is available on Azure Files premium tier. Your performance will scale linearly with the provisioned capacity. You can get up to 100K IOPS and 80 Gibps throughput on a single 100 TiB volume.

Backup

Backing up your data on NFS shares can either be orchestrated using familiar tooling like rsync or products from one of our third-party backup partners. Multiple backup partners including Commvault, Veeam, and Veritas were part of our initial preview and have extended their solutions to work with both SMB 3.0 and NFS 4.1 for Azure Files.

Migration

For data migration, you can use standard tools like scp, rsync, or rsync. Because file storage can be accessed from multiple compute instances concurrently, you can improve copying speeds with parallel uploads. If you want to migrate data from outside of a region, use VNet peering, VPN or an ExpressRoute to connect to your file system from another Azure region or your on-premises data center.

Pricing

This offer will be charged based on premier tier pricing. You can provision shares as small as 100GiB and increase your capacity in 1GiB increments. See premium tier pricing on Azure Files pricing page.

Get started

NFS 4.1 support for Azure Files is in a select set of regions today and we will continually add more regions to this list in coming weeks. Get started today by following these simple step-by-step instructions!

Next steps

We would love to hear your feedback as we continue to heavily invest in adding more features and improving the performance of the NFS v 4.1 offer. For direct feedback and inquiries, please email us at: azurefilesnfs@microsoft.com
Quelle: Azure

Azure NetApp Files cross region replication and new enhancements in preview

As businesses continue to adapt to the realities of the current environment, operational resilience has never been more important. As a result, a growing number of customers have accelerated a move to the cloud, using Microsoft Azure NetApp Files to power critical pieces of their IT infrastructure, like Virtual Desktop Infrastructure, SAP applications, and mission-critical databases.

Today, we release the preview of Azure NetApp Files cross region replication. With this new disaster recovery capability, you can replicate your Azure NetApp Files volumes from one Azure region to another in a fast and cost-effective way, protecting your data from unforeseeable regional failures. We’re also introducing important new enhancements to Azure NetApp Files to provide you with more data security, operational agility, and cost-saving flexibility.

Azure NetApp Files cross region replication

Azure NetApp Files cross region replication leverages NetApp SnapMirror® technology therefore, only changed blocks are sent over the network in a compressed, efficient format. This proprietary technology minimizes the amount of data required to replicate across the regions, therefore saving data transfer costs. It also shortens the replication time so you can achieve a smaller Restore Point Objective (RPO).

Over the next few months of Azure NetApp Files cross region replication preview you can expect:

Multiple replication frequency options: you can replicate an Azure NetApp Files, NFS, or SMB volume across regions with replication frequency choice of every 10 minutes, every hour, or once a day.
Read from secondary: you can read from the secondary volume during active replication.
Failover on-demand: you can failover to the secondary volume at a time of your choice. After a failover, you can also resynchronize the primary volume from the secondary volume at a time of your choice.
Monitoring and alerting: you can monitor the health of volume replication and the health of the secondary volume through Azure NetApp Files metrics and receive alerts through Azure Monitor.
Automation: you can automate the configuration and management of Azure NetApp Files volume replication through standard Azure Rest API, SDKs, command-line tools, and ARM templates.

Supported region pairs

Azure NetApp Files cross region replication is available in popular regions from US, Canada, AMEA, and Asia at the start of public preview. Azure NetApp Files documentation will keep you up-to-date with the latest supported region pairs.

Getting started

Join the preview waitlist now. Once your subscription is enabled for the preview, you can find the feature from the portal (Figure 1) and within a few clicks, you'll be able to configure your first Azure NetApp Files cross region replication (Figure 2).

Figure 1: You can add cross region replication by selecting "Add data replication" from Azure NetApp Files volume management view.

Figure 2: Cross region replication is successfully configured for an Azure NetApp Files volume.

Learn more about Azure NetApp Files cross region replication through the Azure NetApp Files documentation.

Learn more about our pricing

During preview, Azure NetApp Files cross region replication will be offered at full price. Pricing information will be available on the Azure NetApp Files pricing page. You can learn more about the Azure NetApp Files cross region replication cost model through the Azure NetApp Files documentation.

Volume snapshot policy

Azure NetApp Files allows you to create point-in-time snapshots of your volumes. Starting now, you can create a snapshot policy to have Azure NetApp Files automatically create volume snapshots at a frequency of your choice. You can schedule the snapshots to be taken in hourly, daily, weekly or monthly cycles. You can also specify the maximum number of snapshots to keep as part of the snapshot policy. This feature is free of charge (normal Azure NetApp Files storage cost still applies) and is currently in preview. You can register for the feature preview by following the volume snapshot policy documentation.

Dynamic volume tier change

Cloud promises flexibility in IT spending. You can now change the service level of an existing Azure NetApp Files volume by moving the volume to another capacity pool that uses the service level you want for the volume. This in-place service-level change for the volume does not require that you migrate data. It also does not impact the data plane access to the volume. You can change an existing volume to use a higher service level for better performance, or to use a lower service level for cost optimization. This feature is free of charge (normal Azure NetApp Files storage cost still applies) and is currently in public preview. You can register for the feature preview by following the dynamic volume tier change documentation.

Simultaneous dual-protocol (NFS v3 and SMB) access

You can now create an Azure NetApp Files volume that allows simultaneous dual-protocol (NFS v3 and SMB) access with support for LDAP user mapping. This feature enables use cases where you may have a Linux-based workload that generates and stores data in an Azure NetApp Files volume. At the same time, your staff needs to use Windows-based clients and software to analyze the newly generated data from the same Azure NetApp Files volume. The simultaneous dual-protocol access feature removes the need to copy the workload-generated data to a separate volume with a different protocol for post-analysis, saving storage cost, and operational time. This feature is free of charge (normal Azure NetApp Files storage cost still applies) and is generally available. Learn more from the simultaneous dual-protocol access documentation.

NFS v4.1 Kerberos encryption in transit

Azure NetApp Files now supports NFS client encryption in Kerberos modes (krb5, krb5i, and krb5p) with AES-256 encryption, providing you with additional data security. This feature is free of charge (normal Azure NetApp Files storage cost still applies) and is generally available. Learn more from the NFS v4.1 Kerberos encryption documentation.

Azure Government regions

Lastly, we’re pleased to announce the general availability of Azure NetApp Files in Azure Government regions, starting with US Gov Virginia, and soon in US Gov Texas, and US Gov Arizona. Take a look at the latest Azure NetApp Files regional availability and region roadmap.

Get it, use it, and tell us about it

As with other previews, the public preview features should not be used for production workloads until they reach general availability.

We look forward to hearing your feedback on these new capabilities. You can email us feedback at ANFFeedback@microsoft.com. As always, we love to hear all of your ideas and suggestions about Azure NetApp Files, which you can post at Azure NetApp Files feedback forum.
Quelle: Azure

Build a scalable security practice with Azure Lighthouse and Azure Sentinel

The Microsoft Azure Lighthouse product group is excited to launch a blog series covering areas in Azure Lighthouse where we are investing to make our service provider partners and enterprise customers successful with Azure. Our first blog in this series covers a top area of consideration for companies worldwide—Security with focus on how Azure Lighthouse can be used alongside Microsoft’s Azure Sentinel service to build an efficient and scalable security practice.

Today, organizations of all sizes are looking to reduce costs, complexity, and gain efficiencies in their security operations. As cloud security solutions help meet these requirements by providing flexibility, simplicity, pay for use, automatic scalability and protection across heterogenous environments, more and more companies are embracing cloud security solutions.

While achieving efficiencies is the need of the hour, organizations are also faced with shortage of security experts in the market.  Here is where there is tremendous potential for service providers to fill this gap by building and offering security services on top of cloud security solutions. Before diving deeper, let me start with a brief introduction to Azure Lighthouse and Azure Sentinel.

Azure Lighthouse helps service providers and large enterprises manage environments of multiple customers or individual subsidiaries, at scale from within their single centralized control plane. Since the launch of Azure Lighthouse at Inspire, Azure Lighthouse has seen wide adoption from both service providers and enterprises, with millions of Azure resources being managed at scale across heterogenous environments.

Azure Sentinel is a cloud native security information event management (SIEM) and security orchestration automated response (SOAR) solution from Microsoft. It enables collection of security data at scale across your entire enterprise including Azure services, Microsoft 365 services or from hybrid environments,from hybrid environments, such as other clouds, firewalls, and partner security tools. Azure Sentinel also uses built-in AI and advanced querying capabilities to detect, investigate, respond to and mitigate threats efficiently.

We will now look at how you can use both these services together to architect a scalable security practice.

To start building a security practice that scales across multiple customer environments for a service provider or helps organizations centrally monitor and manage the security operations across their individual subsidiaries, we recommend using a distributed deployment and centralized management model. This is where you deploy Azure Sentinel workspaces within the tenant that belongs to the customer or subsidiary (data stays locally within the customer’s or individual subsidiary’s environment) and manage it centrally from within a service provider’s or from a central security operations center (SOC) unit’s tenant within an organization.

You can then leverage Azure Lighthouse’s capabilities to manage and perform security operations from the central managing tenant on the Azure Sentinel workspaces located in the managed tenant. To learn more about this model and its applicability for your scenario, read Extend Azure Sentinel across workspaces and tenants.

To deploy and configure these workspaces at scale, both Azure Sentinel and Azure Lighthouse offer powerful automation capabilities that you can use effectively with CI/CD pipelines across tenants. Here is what ITCSecure, Managed Security Services Provider and Microsoft Partner based in London has to say:

“With Azure Lighthouse’s ability to get delegated access to a customer’s environment and the powerful automation capabilities of both Azure Lighthouse and Azure Sentinel, we are now able to leverage a common set of automations to deploy Azure Sentinel. In real terms, this enables us to configure Azure Sentinel with existing content like queries and analytical rules. This has resulted in significant reductions in customer onboarding times, reducing delivery times from months to a few weeks and even a few hours in certain scenarios. This has enabled us to scale our onboarding processes and practices significantly and delivers faster ROI for our customers. Azure Lighthouse has also provided greater transparency and visibility for our customers, where they can clearly see work delivered. We run queries and apply workbooks across our customer’s subscriptions, deploy playbooks in our customer’s tenants, all from a central pane of glass, further adding to the overall speed of delivery of our service.” —Arno Robbertse, Chief Executive, ITC Secure

Threat hunting and investigation through cross-tenant queries

Running queries to search for threats and as a next step investigating them is an essential part of a SOC analyst’s job. With Azure Lighthouse, you can deploy Log Analytics queries or hunting queries in the central managing tenant (preserving IP for a service provider) and run those queries across the managed tenants using the union operator and workspace expression.                     

Visualizing and monitoring data across customer environments

Another technology that works well across tenants is Azure Monitor Workbooks, Azure Sentinel’s dashboarding technology. You can choose to deploy workbooks in the managing tenant or managed tenant per your requirements. For workbooks deployed in the managing tenant, you can add a multi-workspace selector within a workbook (in case it doesn’t have one already built into it), to visualize and monitor data and essentially get data insights across multiple workspaces and across multiple customers/subsidiaries if needed.

Automated responses through playbooks

Security Playbooks can be used for automatic mitigation when an alert is triggered. The playbooks can be deployed either in the managing tenant or the individual managed tenant, with the response procedures configured based on which tenant's users will need to take action in response to a security threat.

Xcellent, a managed services provider and Microsoft partner based in Netherlands has benefited from access to a central security solution powered by Azure Sentinel and Azure Lighthouse, to monitor the different Microsoft 365 components across customer tenants. Response management and querying against their customer base has also become more efficient—dropping Xcellent’s standard response time to less than 45 minutes and allowed the team to create a more proactive security solution for their customers.

Cross-tenant incident management

Multiple workspace incident view facilitates centralized incident monitoring and management across multiple Azure Sentinel workspaces and across Azure Active Directory (Azure AD) tenants using Azure Lighthouse. This centralized incident view lets you manage incidents directly or drill down transparently to the incident details in the context of the originating workspace.

Resources to get you started

Azure Lighthouse extends Azure Sentinel’s powerful security capabilities to help you centrally monitor and manage security operations from a single interface and efficiently scale your security operations across multiple Azure tenants and customers.

The following resources will help you get started:

Take a look at our detailed documentation and guidance for using Azure Lighthouse with Azure Sentinel.
For latest resources and updates on Azure Sentinel, join us at the Azure Sentinel Tech Community.
You can provide feedback or request new features for Azure Lighthouse in our feedback forum.
Check out Azure PartnerZone for latest content, news, and resources for partners.

Quelle: Azure

Getting Started with Docker Using Node.js(Part I)

A step-by-step guide to help you get started using Docker containers with your Node.js apps.

Prerequisites

To complete this tutorial, you will need the following:

Free Docker Account You can sign-up for a free Docker account and receive free unlimited public repositoriesDocker running locallyInstructions to download and install DockerNode.js version 12.18 or laterDownload Node.jsAn IDE or text editor to use for editing files. I would recommend VSCode

Docker Overview

Docker is an open platform for developing, shipping, and running applications. Docker enables you to separate your applications from your infrastructure so you can deliver software quickly. 

With Docker, you can manage your infrastructure in the same ways you manage your applications. By taking advantage of Docker’s methodologies for shipping, testing, and deploying code quickly, you can significantly reduce the delay between writing code and running it in production.

Sample Application

Let’s create a simple Node.js application that we’ll use as our example. Create a directory on your local machine named node-docker and follow the steps below to create a simple REST API.

$ cd [path to your node-docker directory]
$ npm init -y
$ npm install ronin-server ronin-mocks
$ touch server.js

Now let’s add some code to handle our REST requests. We’ll use a mocks server so we can focus on Dockerizing the application and not so much the actual code.

Open this working directory in your favorite IDE and enter the following code into the server.js file.

const ronin = require( ‘ronin-server’ )
const mocks = require( ‘ronin-mocks’ )

const server = ronin.server()

server.use( ‘/’, mocks.server( server.Router(), false, true ) )
server.start()

The mocking server is called Ronin.js and will list on port 8000 by default. You can make POST requests to the root (/) endpoint and any JSON structure you send to the server will be saved in memory. You can also send GET requests to the same endpoint and receive an array of JSON objects that you have previously POSTed.

Testing Our Application

Let’s start our application and make sure it’s running properly. Open your terminal and navigate to your working directory you created. 

$ node server.js

To test that the application is working properly, we’ll first POST some json to the API and then make a GET request to see that the data has been saved. Open a new terminal and run the following curl commands:

$ curl –request POST
–url http://localhost:8000/test
–header ‘content-type: application/json’
–data ‘{
“msg”: “testing”
}’
{“code”:”success”,”payload”:[{“msg”:”testing”,”id”:”31f23305-f5d0-4b4f-a16f-6f4c8ec93cf1″,”createDate”:”2020-08-28T21:53:07.157Z”}]}

$ curl http://localhost:8000/test
{“code”:”success”,”meta”:{“total”:1,”count”:1},”payload”:[{“msg”:”testing”,”id”:”31f23305-f5d0-4b4f-a16f-6f4c8ec93cf1″,”createDate”:”2020-08-28T21:53:07.157Z”}]}

Switch back to the terminal where our server is running and you should see the following requests in the server logs.

2020-XX-31T16:35:08:4260 INFO: POST /test
2020-XX-31T16:35:21:3560 INFO: GET /test

Creating Dockerfiles for Node.js

Now that our application is running properly, let’s take a look at creating a Dockerfile. 

A Dockerfile is a text document that contains all the commands a user could call on the command line to assemble an image. When we tell Docker to build our image by executing the docker build command, Docker will read these instructions and execute them one by one and create a Docker image as a result.

Let’s walk through creating a Dockerfile for our application. In the root of your working directory, create a file named Dockerfile and open this file in your text editor.

NOTE: The name of the Dockerfile is not important but the default filename for many commands is simply Dockerfile. So we’ll use that as our filename throughout this series.

The first thing we need to do is add a line in our Dockerfile that tells Docker what base image we would like to use for our application. 

Dockerfile:

FROM node:12.18.1

Docker images can be inherited from other images. So instead of creating our own base image, we’ll use the official Node.js image that already has all the tools and packages that we need to run a Node.js application. You can think of this as in the same way you would think about class inheritance in object oriented programming. So for example. If we were able to create Docker images in JavaScript, we might write something like the following.

class MyImage extends NodeBaseImage {}

This would create a class called MyImage that inherited functionality from the base class NodeBaseImage.

In the same way, when we use the FROM command, we tell docker to include in our image all the functionality from the node:12.18.1 image.

NOTE: If you want to learn more about creating your own base images, please checkout our documentation on creating base images.

To make things easier when running the rest of our commands, let’s create a working directory. 

This instructs Docker to use this path as the default location for all subsequent commands. This way we do not have to type out full file paths but can use relative paths based on the working directory.

WORKDIR /app

Usually the very first thing you do once you’ve downloaded a project written in Node.js is to install npm packages. This will ensure that your application has all its dependencies installed into the node_modules directory where the node runtime will be able to find them.

Before we can run npm install, we need to get our package.json and package-lock.json files into our images. We’ll use the COPY command to do this. The COPY command takes two parameters. The first parameter tells Docker what file(s) you would like to copy into the image. The second parameter tells Docker where you want that file(s) to be copied to. We’ll copy the package.json and package-lock.json file into our working directory – /app.

COPY package.json package.json
COPY package-lock.json package-lock.json

Once we have our package.json files inside the image, we can use the RUN command to execute the command npm install. This works exactly the same as if we were running npm install locally on our machine but this time these node modules will be installed into the node_modules directory inside our image.

RUN npm install

At this point we have an image that is based on node version 12.18.1 and we have installed our dependencies. The next thing we need to do is to add our source code into the image. We’ll use the COPY command just like we did with our package.json files above.

COPY . .

This COPY command will take all the files located in the current directory and copies them into the image. Now all we have to do is to tell Docker what command we want to run when our image is run inside of a container. We do this with the CMD command. 

CMD [ “node”, “server.js” ]

Below is the complete Dockerfile.

FROM node:12.18.1

WORKDIR /app

COPY package.json package.json
COPY package-lock.json package-lock.json

RUN npm install

COPY . .

CMD [ “node”, “server.js” ]

Building Images

Now that we’ve created our Dockerfile, let’s build our image. To do this we use the docker build command. The docker build command builds Docker images from a Dockerfile and a “context”. A build’s context is the set of files located in the specified PATH or URL. The Docker build process can access any of the files located in the context. 

The build command optionally takes a –tag flag. The tag is used to set the name of the image and an optional tag in the format ‘name:tag’. We’ll leave off the optional “tag” for now to help simplify things. If you do not pass a tag, docker will use “latest” as it’s default tag. You’ll see this in the last line of the build output.

Let’s build our first Docker image.

$ docker build –tag node-docker .
Sending build context to Docker daemon 82.94kB
Step 1/7 : FROM node:12.18.1
—> f5be1883c8e0
Step 2/7 : WORKDIR /code

Successfully built e03018e56163
Successfully tagged node-docker:latest

Viewing Local Images

To see a list of images we have on our local machine, we have two options. One is to use the CLI and the other is to use Docker Desktop. Since we are currently working in the terminal let’s take a look at listing images with the CLI.

To list images, simply run the images command.

$ docker images
REPOSITORY TAG IMAGE ID CREATED SIZE
node-docker latest 3809733582bc About a minute ago 945MB
node 12.18.1 f5be1883c8e0 2 months ago 918MB

You should see at least two images listed. One for the base image node:12.18.1 and the other for our image we just build node-docker:latest.

Tagging Images

As mentioned earlier, an image name is made up of slash-separated name components. Name components may contain lowercase letters, digits and separators. A separator is defined as a period, one or two underscores, or one or more dashes. A name component may not start or end with a separator.

An image is made up of a manifest and a list of layers. Do not worry to much about manifests and layers at this point other than a “tag” points to a combination of these artifacts. You can have multiple tags for an image. Let’s create a second tag for the image we built and take a look at it’s layers.

To create a new tag for the image we built above, run the following command.

$ docker tag node-docker:latest node-docker:v1.0.0

The docker tag command creates a new tag for an image. It does not create a new image. The tag points to the same image and is just another way to reference the image.

Now run the docker images command to see a list of our local images.

$ docker images
REPOSITORY TAG IMAGE ID CREATED SIZE
node-docker latest 3809733582bc 24 minutes ago 945MB
node-docker v1.0.0 3809733582bc 24 minutes ago 945MB
node 12.18.1 f5be1883c8e0 2 months ago 918MB

You can see that we have two images that start with node-docker. We know they are the same image because if you look at the IMAGE ID column, you can see that the values are the same for the two images.

Let’s remove the tag that we just created. To do this, we’ll use the rmi command. The rmi command stands for “remove image”. 

$ docker rmi node-docker:v1.0.0
Untagged: node-docker:v1.0.0

Notice that the response from Docker tells us that the image has not been removed but only “untagged”. Double check this by running the images command.

$ docker images
REPOSITORY TAG IMAGE ID CREATED SIZE
node-docker latest 3809733582bc 32 minutes ago 945MB
node 12.18.1 f5be1883c8e0 2 months ago 918MB

Our image that was tagged with :v1.0.0 has been removed but we still have the node-docker:latest tag available on our machine.

Running Containers

A container is a normal operating system process except that this process is isolated in that it has its own file system, its own networking, and its own isolated process tree separate from the host.

To run an image inside of a container, we use the docker run command. The docker run command requires one parameter and that is the image name. Let’s start our image and make sure it is running correctly. Execute the following command in your terminal.

$ docker run node-docker

After running this command you’ll notice that you were not returned to the command prompt. This is because our application is a REST server and will run in a loop waiting for incoming requests without return control back to the OS until we stop the container.

Let’s make a GET request to the server using the curl command.

$ curl –request POST
–url http://localhost:8000/test
–header ‘content-type: application/json’
–data ‘{
“msg”: “testing”
}’
curl: (7) Failed to connect to localhost port 8000: Connection refused

As you can see, our curl command failed because the connection to our server was refused. Meaning that we were not able to connect to localhost on port 8000. This is expected because our container is run in isolation which includes networking. Let’s stop the container and restart with port 8000 published on our local network.

To stop the container, press ctrl-c. This will return you to the terminal prompt.

To publish a port for our container, we’ll use the —publish flag (-p for short) on the docker run command. The format of the —publish command is [host port]:[container port]. So if we wanted to expose port 8000 inside the container to port 3000 outside the container, we would pass 3000:8000 to the —publish flag. 

Start the container and expose port 8000 to port 8000 on the host.

$ docker run –publish 8000:8000 node-docker

Now let’s rerun the curl command from above.

$ curl –request POST
–url http://localhost:8000/test
–header ‘content-type: application/json’
–data ‘{
“msg”: “testing”
}’
{“code”:”success”,”payload”:[{“msg”:”testing”,”id”:”dc0e2c2b-793d-433c-8645-b3a553ea26de”,”createDate”:”2020-09-01T17:36:09.897Z”}]}

Success! We were able to connect to the application running inside of our container on port 8000. Switch back to the terminal where your container is running and you should see the POST request logged to the console.

2020-09-01T17:36:09:8770  INFO: POST /test

Press ctrl-c to stop the container.

Run In Detached Mode

This is great so far but our sample application is a web server and we should not have to have our terminal connected to the container. Docker can run your container in detached mode or in the background. To do this, we can use the —detach or -d for short. Docker will start your container the same as before but this time will “detach” from the container and return you to the terminal prompt.

$ docker run -d -p 8000:8000 node-docker
ce02b3179f0f10085db9edfccd731101868f58631bdf918ca490ff6fd223a93b

Docker started our container in the background and printed the Container ID on the terminal.

Again, let’s make sure that our container is running properly. Run the same curl command from above.

$ curl –request POST
–url http://localhost:8000/test
–header ‘content-type: application/json’
–data ‘{
“msg”: “testing”
}’
{“code”:”success”,”payload”:[{“msg”:”testing”,”id”:”dc0e2c2b-793d-433c-8645-b3a553ea26de”,”createDate”:”2020-09-01T17:36:09.897Z”}]}

Listing Containers

Since we ran our container in the background, how do we know if our container is running or what other containers are running on our machine? Well, we can run the docker ps command. Just like on linux, to see a list of processes on your machine we would run the ps command. In the same spirit, we can run the docker ps command which will show us a list of containers running on our machine.

$ docker ps
CONTAINER ID IMAGE COMMAND CREATED STATUS PORTS NAMES
ce02b3179f0f node-docker “docker-entrypoint.s…” 6 minutes ago Up 6 minutes 0.0.0.0:8000->8000/tcp wonderful_kalam

The ps command tells a bunch of stuff about our running containers. We can see the Container ID, The image running inside the container, the command that was used to start the container, when it was created, the status, ports that exposed and the name of the container. 

You are probably wondering where the name of our container is coming from. Since we didn’t provide a name for the container when we started it, Docker generated a random name. We’ll fix this in a minute but first we need to stop the container. To stop the container, run the docker stop command which does just that, stops the container. You will need to pass the name of the container or you can use the container id.

$ docker stop wonderful_kalam
wonderful_kalam

Now rerun the docker ps command to see a list of running containers.

$ docker ps
CONTAINER ID IMAGE COMMAND CREATED STATUS PORTS NAMES

Stopped, Started and Naming Containers

Docker containers can be started, stopped and restarted. When we stop a container, it is not removed but the status is changed to stopped and the process inside of the container is stopped. When we ran the docker ps command, the default output is to only show running containers. If we pass the —all or –a for short, we will see all containers on our system whether they are stopped or started.

$ docker ps -a
CONTAINER ID IMAGE COMMAND CREATED STATUS PORTS NAMES
ce02b3179f0f node-docker “docker-entrypoint.s…” 16 minutes ago Exited (0) 5 minutes ago wonderful_kalam
ec45285c456d node-docker “docker-entrypoint.s…” 28 minutes ago Exited (0) 20 minutes ago agitated_moser
fb7a41809e5d node-docker “docker-entrypoint.s…” 37 minutes ago Exited (0) 36 minutes ago goofy_khayyam

If you’ve been following along, you should see several containers listed. These are containers that we started and stopped but have not been removed.

Let’s restart the container that we just stopped. Locate the name of the container we just stopped and replace the name of the container below in the restart command.

$ docker restart wonderful_kalam

Now list all the containers again using the ps command.

$ docker ps –all
CONTAINER ID IMAGE COMMAND CREATED STATUS PORTS NAMES
ce02b3179f0f node-docker “docker-entrypoint.s…” 19 minutes ago Up 8 seconds 0.0.0.0:8000->8000/tcp wonderful_kalam
ec45285c456d node-docker “docker-entrypoint.s…” 31 minutes ago Exited (0) 23 minutes ago agitated_moser
fb7a41809e5d node-docker “docker-entrypoint.s…” 40 minutes ago Exited (0) 39 minutes ago goofy_khayyam

Notice that the container we just restarted has been started in detached mode and has port 8000 exposed. Also observe the status of the container is “Up X seconds”. When you restart a container, it will be started with the same flags or commands that it was originally started with.

Let’s stop and remove all of our containers and take a look at fixing the random naming issue.

Stop the container we just started. Find the name of your running container and replace the name in the command below with the name of the container on your system.

$ docker stop wonderful_kalam
wonderful_kalam

Now that all of our containers are stopped, let’s remove them. When a container is removed, it is no longer running nor is it in the stopped status but the process inside the container has been stopped and the metadata for the container has been removed.

$ docker ps –all
CONTAINER ID IMAGE COMMAND CREATED STATUS PORTS NAMES
ce02b3179f0f node-docker “docker-entrypoint.s…” 19 minutes ago Up 8 seconds 0.0.0.0:8000->8000/tcp wonderful_kalam
ec45285c456d node-docker “docker-entrypoint.s…” 31 minutes ago Exited (0) 23 minutes ago agitated_moser
fb7a41809e5d node-docker “docker-entrypoint.s…” 40 minutes ago Exited (0) 39 minutes ago goofy_khayyam

To remove a container, simple run the docker rm command passing the container name. You can pass multiple container names to the command in one command. Again, replace the containers names in the below command with the container names from your system.

$ docker rm wonderful_kalam agitated_moser goofy_khayyam
wonderful_kalam
agitated_moser
goofy_khayyam

Run the docker ps –all command again to see that all containers are gone.

Now let’s address the pesky random name issue. Standard practice is to name your containers for the simple reason that it is easier to identify what is running in the container and what application or service it is associated with. Just like good naming conventions for variables in your code makes it simpler to read. So goes naming your containers.

To name a container, we just need to pass the –name flag to the run command.

$ docker run -d -p 8000:8000 –name rest-server node-docker
1aa5d46418a68705c81782a58456a4ccdb56a309cb5e6bd399478d01eaa5cdda
$ docker ps
CONTAINER ID IMAGE COMMAND CREATED STATUS PORTS NAMES
1aa5d46418a6 node-docker “docker-entrypoint.s…” 3 seconds ago Up 3 seconds 0.0.0.0:8000->8000/tcp rest-server

There, that’s better. Now we can easily identify our container based on the name.

Conclusion

In this post, we learned about creating Docker images using a Dockerfile, tagging our images and managing images. Next we took a look at running containers, publishing ports, and running containers in detached mode. We then learned about managing containers by starting, stopping and restarting them. We also looked at naming our containers so they are more easily identifiable.

In part II, we’ll take a look at running a database in a container and connecting it to our application. We’ll also look at setting up your local development environment and sharing your images using Docker.

If you have any questions, please feel free to reach out on Twitter @pmckee and join us in our community slack.
The post Getting Started with Docker Using Node.js(Part I) appeared first on Docker Blog.
Quelle: https://blog.docker.com/feed/
Getting Started with Docker Using Node – Part II

In part I of this series, we learned about creating Docker images using a Dockerfile, tagging our images and managing images. Next we took a look at running containers, publishing ports, and running containers in detached mode. We then learned about managing containers by starting, stopping and restarting them. We also looked at naming our containers so they are more easily identifiable.

In this post, we’ll focus on setting up our local development environment. First, we’ll take a look at running a database in a container and how we use volumes and networking to persist our data and allow our application to talk with the database. Then we’ll pull everything together into a compose file which will allow us to setup and run a local development environment with one command. Finally, we’ll take a look at connecting a debugger to our application running inside a container.

Local Database and Containers

Instead of downloading MongoDB, installing, configuring and then running the Mongo database as a service. We can use the Docker Official Image for MongoDB and run it in a container.

Before we run MongoDB in a container, we want to create a couple of volumes that Docker can manage to store our persistent data and configuration. I like to use the managed volumes feature that docker provides instead of using bind mounts. You can read all about volumes in our documentation.

Let’s create our volumes now. We’ll create one for the data and one for configuration of MongoDB.

$ docker volume create mongodb

$ docker volume create mongodb_config

Now we’ll create a network that our application and database will use to talk with each other. The network is called a user defined bridge network and gives us a nice DNS lookup service which we can use when creating our connection string.

docker network create mongodb

Now we can run MongoDB in a container and attach to the volumes and network we created above. Docker will pull the image from Hub and run it for you locally.

$ docker run -it –rm -d -v mongodb:/data/db

-v mongodb_config:/data/configdb -p 27017:27017

–network mongodb

–name mongodb

mongo

Okay, now that we have a running mongodb, let’s update server.js to use a the MongoDB and not an in-memory data store. 

const ronin     = require( ‘ronin-server’ )

const mocks     = require( ‘ronin-mocks’ )

const database  = require( ‘ronin-database’ )

const server = ronin.server()

database.connect( process.env.CONNECTIONSTRING )

server.use( ‘/’, mocks.server( server.Router(), false, false ) )

server.start()

We’ve add the ronin-database module and we updated the code to connect to the database and set the in-memory flag to false. We now need to rebuild our image so it contains our changes.

First let’s add the ronin-database module to our application using npm.

$ npm install ronin-database

Now we can build our image.

$ docker build –tag node-docker .

Now let’s run our container. But this time we’ll need to set the CONNECTIONSTRING environment variable so our application knows what connection string to use to access the database. We’ll do this right in the docker run command.

$ docker run

-it –rm -d

–network mongodb

–name rest-server

-p 8000:8000

-e CONNECTIONSTRING=mongodb://mongodb:27017/yoda_notes

node-docker

Let’s test that our application is connected to the database and is able to add a note.

$ curl –request POST

  –url http://localhost:8000/notes

  –header ‘content-type: application/json’

  –data ‘{

“name”: “this is a note”,

“text”: “this is a note that I wanted to take while I was working on writing a blog post.”,

“owner”: “peter”

}’

You should receive the following json back from our service.

{“code”:”success”,”payload”:{“_id”:”5efd0a1552cd422b59d4f994″,”name”:”this is a note”,”text”:”this is a note that I wanted to take while I was working on writing a blog post.”,”owner”:”peter”,”createDate”:”2020-07-01T22:11:33.256Z”}}

Using Compose to Develop locally

Awesome! We now have our MongoDB running inside a container and persisting it’s data to a Docker volume. We also were able to pass in the connection string using an environment variable.

But this can be a little bit time consuming and also difficult to remember all the environment variables, networks and volumes that need to be created and set up to run our application. 

In this section, we’ll use a Compose file to configure everything we just did manually. We’ll also set up the Compose file to start the application in debug mode so that we can connect a debugger to the running node process.

Open your favorite IDE or text editor and create a new file named docker-compose.dev.yml. Copy and paste the below commands into that file.

version: ‘3.8’

services:

 notes:

   build:

     context: .

   ports:

     – 8000:8000

     – 9229:9229

   environment:

     – CONNECTIONSTRING=mongodb://mongo:27017/notes

   volumes:

     – ./:/code

   command: npm run debug

 mongo:

   image: mongo:4.2.8

   ports:

     – 27017:27017

   volumes:

     – mongodb:/data/db

     – mongodb_config:/data/configdb

 volumes:

   mongodb:

   mongodb_config:

This compose file is super convenient because now we do not have to type all the parameters to pass to the docker run command. We can declaratively do that in the compose file.

We are exposing port 9229 so that we can attach a debugger. We are also mapping our local source code into the running container so that we can make changes in our text editor and have those changes picked up in the container.

One other really cool feature of using a compose file, is that we have service resolution automatically set up for us. So we are now able to use “mongo” in our connection string. The reason we can use “mongo” is because this is the name we used in the compose file to label our container running our MongoDB.

To be able to start our application in debug mode, we need to add a line to our package.json file to tell npm how to start our application in debug mode.

Open the package.json file and add the following line to the scripts section.

“debug”: “nodemon –inspect=0.0.0.0:9229 server.js”

As you can see we are going to use nodemon. Nodemon will start our server in debug mode and also watch for files that have changed and restart our server. Let’s add nodemon to our package.json file.

$ npm install nodemon

Let’s first stop our running application and the mongodb container. Then we can start our application using compose and confirm that it is running properly.

$ docker stop rest-server mongodb

$ docker-compose -f docker-compose.dev.yml up –build

If you get the following error: ‘Error response from daemon: No such container:’ Don’t worry. That just means that you have already stopped the container or it wasn’t running in the first place.

You’ll notice that we pass the “–build” flag to the docker-compose command. This tells Docker to first compile our image and then start it.

If all goes will you should see something similar:

Now let’s test our API endpoint. Run the following curl command:

$ curl –request GET –url http://localhost:8000/notes

You should receive the following response:

{“code”:”success”,”meta”:{“total”:0,”count”:0},”payload”:[]}

Connecting a Debugger

We’ll use the debugger that comes with the Chrome browser. Open Chrome on your machine and then type the following into the address bar.

about:inspect

The following screen will open.

Click the “Open dedicated DevTools for Node” link. This will open the DevTools window that is connected to the running node.js process inside our container.

Let’s change the source code and then set a breakpoint. 

Add the following code to the server.js file on line 9 and save the file. 

 server.use( ‘/foo’, (req, res) => {

   return res.json({ “foo”: “bar” })

 })

If you take a look at the terminal where our compose application is running, you’ll see that nodemon noticed the changes and reloaded our application.

Navigate back to the Chrome DevTools and set a breakpoint on line 10 and then run the following curl command to trigger the breakpoint.

$ curl –request GET –url http://localhost:8000/foo

BOOM You should have seen the code break on line 10 and now you are able to use the debugger just like you would normally. You can inspect and watch variables, set conditional breakpoints, view stack traces and a bunch of other stuff.

Conclusion

In this post, we ran MongoDB in a container, connected it to a couple of volumes and created a network so our application could talk with the database. Then we used Docker Compose to pull all this together into one file. Finally, we took a quick look at configuring our application to start in debug mode and connected to it using the Chrome debugger.

If you have any questions, please feel free to reach out on Twitter @pmckee and join us in our community slack.
The post Getting Started with Docker Using Node – Part II appeared first on Docker Blog.
Quelle: https://blog.docker.com/feed/

Secure from the Start: Shift Vulnerability Scanning Left in Docker Desktop

Application delivery velocity can be tripped up when security vulnerabilities are discovered after an app is deployed into production. Nothing is more detrimental to shipping new features to customers than having to go back and address vulnerabilities discovered in an app or image you already released. At Docker, we believe the best way to balance the needs for speed and security is to shift security left in the app delivery cycle as an integral part of the development process. 

Integrating security checks into Docker Scan was the driver behind the partnership with Snyk, one of the leading app security scan providers in the industry. This partnership, announced in May of this year, creates a vision for a simple and streamlined approach for developers to build and deploy secure containers. And today, I’m excited to share that the latest Docker Desktop Edge release includes Snyk vulnerability scanning. This allows Docker users to trigger local Docker file and local image scans directly from the Docker Desktop CLI. With the combination of Docker Scan and Snyk, developers gain visibility into open source vulnerabilities that can have a negative impact on the security of container images. Now you can extend your workflow to include vulnerability testing as part of your inner development loop. Triggered from the Docker Desktop CLI, the Snyk vulnerability scans extend the existing, familiar process of vulnerability detection, and allow for remediation of vulnerabilities earlier in the development process. This process of simple and continuous checks leads to fewer vulnerabilities checked into Docker Hub, a shorter CI cycle, and faster and more reliable deployment into production. 

With that, let me show you how it works.

To begin, authenticated Docker users can start by running their scans by entering these Docker CLI commands –

To find their local image

$docker pull username/imageName

And run a scan

$docker scan username/imageName

The Docker scan CLI command supports several flags, providing options for running scans 

–exclude-base flag excludes base image vulnerabilities from the CLI scan results, allowing user to reduce the volume of reported vulnerabilities, and focus vulnerability reporting on their own image updates–json flag displays scan results in JSON format–dependency-tree flag provides the mapping of image dependencies before listing vulnerability data–f, –file flag indicates the location of the Dockerfile associated with the image, extending  vulnerability scanning results using the contents of the Dockerfile to further identify potential vulnerabilities across all the image manifests

You can also add multiple flags  in a single CLI command, for additional flexibility in consuming vulnerability data. Scans return scanned image data, including:

Vulnerability descriptionsVulnerability severitiesImage layer associated with the vulnerability,  including the Dockerfile command, if you’ve associated the Dockerfile with the scanExploit maturity, so you can easily identify which vulnerabilities have a known functioning exploitAvailable suggestions for remediation,  rebuilding if the base image is out-of-date, slimmer alternative images that can help reduce vulnerabilities, or package upgrades that resolve a vulnerability

Invoking scanning through Docker Desktop CLI allows you to iteratively test for new vulnerabilities, while working on image updates, by:

Making image updatesRunning a scan Discovering new vulnerabilities introduced with the latest updatesMaking more updates to remove these vulnerabilitiesConfirming vulnerability removal by running another scan

You can start taking advantage of this today in the latest release of Docker Desktop Edge.

After you download the new bits, you can get more comprehensive details on the scan functionality in the Docker documentation.

Finally, we have an upcoming webinar that takes you through the inner workings of the enhanced security capabilities in this new release. You can get more information and sign up for the webinar at this link. 

And stay tuned for further updates on triggering vulnerability scans from the Docker Hub.  

Next steps:

Download the latest version of the Desktop Edge releaseReview the Docker documentation Attend the webinar on Thursday, September 24 at 10:00am PT, Find and Fix Container Image Vulnerabilities with Docker and Snyk

Sign up for a free Snyk ID and Read the Snyk blog to learn more about the integration
The post Secure from the Start: Shift Vulnerability Scanning Left in Docker Desktop appeared first on Docker Blog.
Quelle: https://blog.docker.com/feed/






