Customers who make data sing and analytics product news to cure your data FOMO

In December, we predicted that a “revolution was coming for data and the cloud in 2021.” Well, January came and gone: our team has been busy delivering new capabilities, content and best practices to help kick your year into high gear. Our work is guided by our customers; we’re always listening to your needs and working to build innovative solutions that will help you succeed.Here is a quick digest of what’s happening in data analytics at Google this month.The Data Democracy Trilogy This past week we released the third and final installment of our “data democratization trilogy,” a series of blogs aimed at helping our community deliver on their mission to become more data-driven.  Our blogs include best practices from incredible organizations like AB Tasty, Sunrun, Veolia, Geotab and AES Digital Hub who have empowered business users, expanded the use of machine learning and made real-time analytics ubiquitous. The democratization of insights has been a key theme for our customers and a personal passion of mine, and it will be front and center of our plans for 2021. If you want to find out how Dataflow, together with Pub/Sub, can help the challenges posed by traditional streaming systems or how the combination of BigQuery, Connected Sheets, Looker and Data QnA can provide faster answers to your employees, be sure to bookmark these blogs and share them with your teams and colleagues.And, if you’re ready for more, check out our design pattern catalog. This past week, we released a set of resources to help you perform demand forecasting at scale using BQML and Data Studio. The best way to understand this pattern is to watch the video below and to register for our webinar next week: How to do demand forecasting with BigQuery ML.As you navigate through the catalog, you’ll find everything you need from predicting customer lifetime value, building propensity to purchase models, or architecting product recommendation and anomaly detection systems. You’ll probably wonder how we came up with such an impactful list of best practices. The answer is simple: our customers!  Our customers guide everything we do and we pride ourselves in building the solutions you need across any and all industries. That’s why, when you navigate through our catalog, you’ll find that these resources are applicable across many industries, from retail and manufacturing to financial services, telecommunications and many more.From staying up until 3am to relaxing and eating ice cream To give you an example of the commitment we make to our customers, I want to point you to an outstanding conversation we posted last week between Chad Jennings, Data Analytics product manager and two of our greatest customers: the New York Times & The Major League Baseball.The video is accompanied by a great blog, authored by The New York Times’ Executive Director for Data Products, Edward Podojil. In the piece, Ed talks about his company’s data architecture evolution and how he went from staying “up until three in the morning one night trying to keep data running for their needs” to “relaxing and eating ice cream” because he could now “more easily manage his data environment, set and meet higher expectations for data ingestion, analysis and insight.” This is the kind of story that truly warms my heart; I hope you’ll enjoy it too!Innovators in all industriesOur customers work on some of the most meaningful and interesting issues. We pride ourselves in serving them and paying attention to their progress. Great publications like Diginomica and Healthcare business and policy site FierceHealthcare documented the journeys of some of them this month:We hope you’ll find value in how The Home Depot describes their journey and documented how BigQuery allowed them to achieve their “one version of the truth”.  You might have been inspired by Highmark Health’s decision to tackle the data fragmentation experienced in the healthcare industry by partnering with Google Cloud to tap into our AI and Analytics technology.Our goal is to enable every industry to accelerate their ability to digitally transform and reimagine their business through data-powered innovation. And we mean every industry.  If you’re in the entertainment industry for instance, you’ll want to read about why BMG selected Google Cloud, BigQuery and Dataproc to tap into relevant data across the music lifecycle with smarter analytics tools.“We actually migrated all of our data warehouse to BigQuery over the last three years. The upside of that is now we have a lot more of this data together. There’s only one place of truth, so there’s never an argument in our organization about whether your copy of the data is the real truth or my copy of the data is the real truth.” – The Home Depot”The Living Health model takes the information and preferences that a person provides us, applies the analytics developed with Google Cloud, and creates a proactive, dynamic, and readily accessible health plan and support team that fits an individual’s unique needs.” – Highmark HealthProduct capabilities you’re not going to want to missOur customers inspire us to do more every day and we aim to continuously introduce new functionality that makes your work easier, more robust, and better integrated.  In January, we introduced radical usability improvements with our new BigQuery Cloud Console UI: you can now experience new multi-tab navigation, a new resource panel & new SQL editor. Find out more. Beyond usability, customers value scale and we hear that you want our help in making queries and use cases virtually limitless. This is why, this month, we introduced support for the BigNUMERIC datatype. BigQuery already supports a wide range of data types for storing numeric data. Of these data types, NUMERIC supports the highest degree of precision with 38 digits of precision and 9 digits of scale. But, as large web-scale datasets expand to support time, location or finance-based information with an expanded degree of precision, the current precision and scale in NUMERIC was not sufficient to support the data. We introduced BIGNUMERIC, which supports 76 digits of precision and 38 of scale, in public preview in all regions. Read more here. Finally, many of you have reached out to us to ask how you can use BigQuery with Open Source engines like Apache Spark. Chris Crosbie, product manager on Dataproc, produced an outstanding tutorial video introducing our Spark-BigQuery-connectorthrough the use of three common use cases for data engineers and data scientists.Want to take BigQuery for spin? Get started with the BigQuery sandbox here. While you’re at it, you might want to refer to this January blog on how to let users upload their complex CSV file into BigQuery using Google SheetsMore community news!If you’re subscribing to this blog, you know that our teams are focused on enabling the community and partnering with you to advance the field of data analytics, machine learning and data science. Let us know how we can participate in your success!  This past month, I had the opportunity to speak about X-Analytics with Justin Borgman, the CEO of Starburst Data, in preparation for his company’s upcoming event: Datanova. I hope you can make time for it: the two-day virtual conference kicks off on February 9th and Bill Nye, the “science guy” is the keynote! Find out more about it here.
Quelle: Google Cloud Platform

Donating Docker Distribution to the CNCF

We are happy to announce that Docker has contributed Docker Distribution to the Cloud Native Computing Foundation (CNCF). Docker is committed to the Open Source community and open standards for many of our projects, and this move will ensure Docker Distribution has a broad group maintaining what is the foundation for many registries. 

What is Docker Distribution?

Distribution is the open source code that is the basis of the container registry that is part of Docker Hub, and also many other container registries. It is the reference implementation of a container registry and is extremely widely used, so it is a foundational part of the container ecosystem. This makes its new home in the CNCF highly appropriate.

Docker Distribution was a major rewrite of the original Registry code which was written in Python and was a much earlier design not using content addressed storage. This new version, written in Go, was designed to be an extensible library, so that different backends and subsystems could be designed. Docker formed the Open Container Initiative (OCI) in 2015, in the Linux Foundation, in order to standardise the specifications for the container ecosystem, including the registry and image formats.

Why are we donating Docker Distribution to the CNCF?

There are now many registries, with a lot of companies and organizations providing registries internally or as a service. Many of these are based on the code in Docker Distribution, but we found that many people had small forks and changes that they were not contributing to the upstream version, and the project needed a broader group of maintainers. To make the project clearly an industry wide collaboration, hosting it in the CNCF was the obvious place, as it is the home of many successful collaborative projects, such as Kubernetes and Containerd.

We approached the major users of the Docker Distribution code at scale to become maintainers of the project. This includes maintainers from Docker, GitHub, GitLab, Digital Ocean, Mirantis and the Harbor project which is itself a graduated CNCF project that extends the core registry with other services. In addition, we have invited a maintainer from the OCI, and we are open to more participation in the future. The project is now simply called “Distribution” and can be found at github.com/distribution/distribution.

The Distribution project has been accepted into the CNCF Sandbox, but as it is a mature project we will be proposing that it moves to incubation shortly. We welcome the new maintainers and look forward to the new contributions and future for the project in the CNCF.
The post Donating Docker Distribution to the CNCF appeared first on Docker Blog.
Quelle: https://blog.docker.com/feed/

Continuous model evaluation with BigQuery ML, Stored Procedures, and Cloud Scheduler

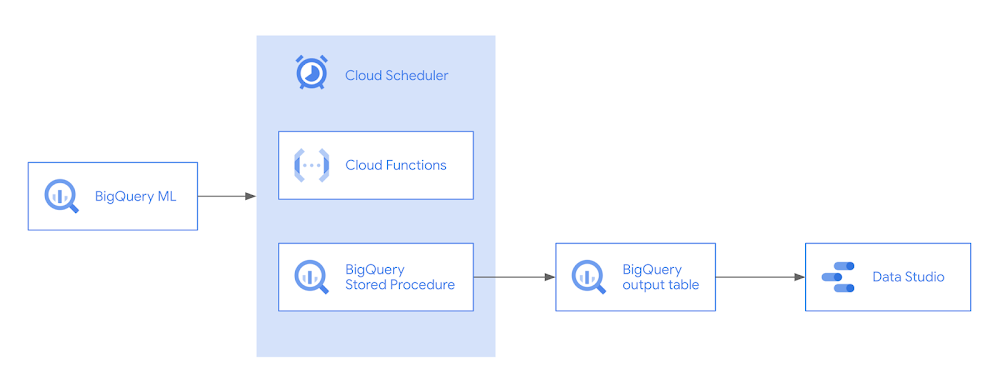
Continuous evaluation – the process of ensuring a production machine learning model is still performing well on new data – is an essential part in any ML workflow. Performing continuous evaluation can help you catch model drift, a phenomenon that occurs when the data used to train your model no longer reflects the current environment. For example, with a model classifying news articles, new vocabulary may emerge that were not included in the original training data. In a tabular model predicting flight delays, airlines may update their routes, leading to lower model accuracy if the model isn’t retrained on new data. Continuous evaluation helps you understand when to retrain your model to ensure performance remains above a predefined threshold. In this post, we’ll show you how to implement continuous evaluation using BigQuery ML, Cloud Scheduler, and Cloud Functions. A preview of what we’ll build is shown in the architecture diagram below.To demonstrate continuous evaluation, we’ll be using a flight dataset to build a regression model predicting how much a flight will be delayed.Creating a model with BigQuery MLIn order to implement continuous evaluation, we’ll first need a model deployed in a production environment. The concepts we’ll discuss can work with any environment you’ve used to deploy your model. Here we’ll use BigQuery Machine Learning (BQML) to build the model. BQML lets you train and deploy models on custom data stored in BigQuery using familiar SQL. We can create our model with the following query:Running this will train our model and create the model resource within the BigQuery dataset we specified in the CREATE MODEL query. Within the model resource, we can also see training and evaluation metrics. When training completes, the model is automatically available to use for predictions via a ML.PREDICT query:With a deployed model, we’re ready to start continuous evaluation. The first step is determining how often we’ll evaluate the model, which will largely depend on the prediction task. We could run evaluation on a time interval (i.e. once a month), or whenever we receive a certain number of new prediction requests. In this example, we’ll gather evaluation metrics on our model on a daily basis.Another important consideration for implementing continuous evaluation is understanding when you’ll have ground truth labels available for new data. In our flights example, whenever a new flight lands we’ll know how delayed or early it was. This could be more complex in other scenarios. For example, if we were building a model to predict whether someone will buy a product they add to their shopping cart, we’d need to determine how long we’d wait once an item was added (minutes? hours? days?) before marking it as unpurchased.Evaluating data with ML.EVALUATEWe can monitor how well our ML model(s) performs over time on new data, by evaluating our models regularly and inserting them into a table on BigQuery.Here’s the normal output you would get from using ML.EVALUATE:In addition to these metrics, we will also want to store some metadata, such as the name of the model we evaluated and the timestamp of the model evaluation. But as you can see below, the following code can quickly become difficult to maintain, as every time you execute the query, you would need to replace MY_MODEL_NAME twice (on lines 3 and 6), with the name of the model you created (e.g., “linreg”).Creating a Stored Procedure to evaluate incoming dataYou can use a Stored Procedure, which allows you to save your SQL queries and run them by passing in custom arguments, like a string for the model name. CALL modelevaluation.evaluate(“linreg”); Doesn’t this look cleaner already? To create the stored procedure, you can execute the following code, which you can then call using the CALL code shown above. Notice how it takes in an input string, MODELNAME, which then gets used in the model evaluation query.Another added benefit of stored procedures is that it’s much easier to share the query to CALL a stored procedure with others — which abstracts away from the raw SQL — rather than share the full SQL query. Using the Stored Procedure to insert evaluation metrics into a tableUsing the stored procedure below, in a single step, we can now evaluate the model and insert it to a table, modelevaluation.metrics, which we will first need to create. This table needs to follow the same schema as in the stored procedure. Perhaps the easiest way is to use LIMIT 0, which is a cost-free query returning zero rows, while maintaining the schema.With the table created, now every time you run the stored procedure on your model “linreg”, it will evaluate the model and insert them as a new row into the table:CALL modelevaluation.evaluate_and_insert(“linreg”);Continuous evaluation with Cloud Functions and Cloud SchedulerTo run the stored procedure on a recurring basis, you can create a Cloud Function with the code you want to run, and trigger the Cloud Function with a cron job scheduler like Cloud Scheduler.Navigating to the Cloud Functions page on Google Cloud Platform, create a new Cloud Function that uses a HTTP trigger type:Note the URL, which will be the trigger URL for this Cloud Function. It should look something like:https://<region>-<projectid>.cloudfunctions.net/<functionname>Clicking “Next” on your Cloud Functions gets you to the editor, where you can paste the following code, while setting the Runtime  to “Python” and changing the “Entry point” to “updated_table_metrics”:Under main.py, you can use the following code:Under requirements.txt, you can paste the following code for the required packages:You can then deploy the function, and even test your Cloud Function by clicking on “Test the function” just to make sure it returns a successful response:Next, to trigger the Cloud Function on a regular basis, we will create a new Cloud Scheduler job on Google Cloud Platform.By default, Cloud Functions with HTTP triggers will require authentication, as you probably don’t want anyone to be able to trigger your Cloud Functions. This means you will need to include a service account to your Scheduler job that has IAM permissions for:Cloud Functions InvokerCloud Scheduler Service AgentOnce the job is created, you can try to run the job by clicking “Run now”.Now you can check your BigQuery table and see if it’s been updated! Across multiple days or weeks, you should start to see the table populate, like below:Visualizing our model metricsIf we’re regularly running our stored procedure on new data, analyzing the results of our aggregate query above could get unwieldy. In that case, it would be helpful to visualize our model’s performance over time. To do that we’ll use Data Studio. Data Studio lets us create custom data visualizations, and supports a variety of different data sources, including BigQuery. To start visualizing data from our BigQuery metrics table, we’ll select BigQuery as a data source, choose the correct project, and then write a query capturing the data we’d like to plot:For our first chart, we’ll create a time series to evaluate changes to RMSE. We can do this by selecting “timestamp” as our dimension and “rmse” as our metric:If we wanted more than one metric in our chart, we can add as many as we’d like in the Metric section. With our metrics selected, we can switch from Edit to View mode to see our time series and share the report with others on our team. In View mode, the chart is interactive so we can see the rmse for any day in the time series by hovering over it:We can also download the data from our chart as a csv or export it to a sheet. From this view, it’s easy to see that our model’s error increased quite a bit on November 19th.What’s next?Now that we’ve set up a system for continuous evaluation, we’ll need a way to get alerts when our error goes above a certain threshold. We also need a plan for acting on these alerts, which typically involves retraining and evaluating our model on new data. Ideally, once we have this in place we can build a pipeline to automate the process of continuous evaluation, model retraining, and new model deployment. We’ll cover these topics in future posts – stay tuned!If you’d like to learn more about any of the topics covered in this post, check out these resources:BigQuery Machine Learning quickstartBigQuery Stored ProceduresData Studio + BigQuery quickstart Let us know what you thought of this post, and if you have topics you’d like to see covered in the future! You can find us on Twitter at @polonglin and @SRobTweets.Related ArticleHow to build demand forecasting models with BigQuery MLWith BigQuery ML, you can train and deploy machine learning models using SQL. With the fully managed, scalable infrastructure of BigQuery…Read Article
Quelle: Google Cloud Platform