How to do network traffic analysis with VPC Flow Logs on Google Cloud
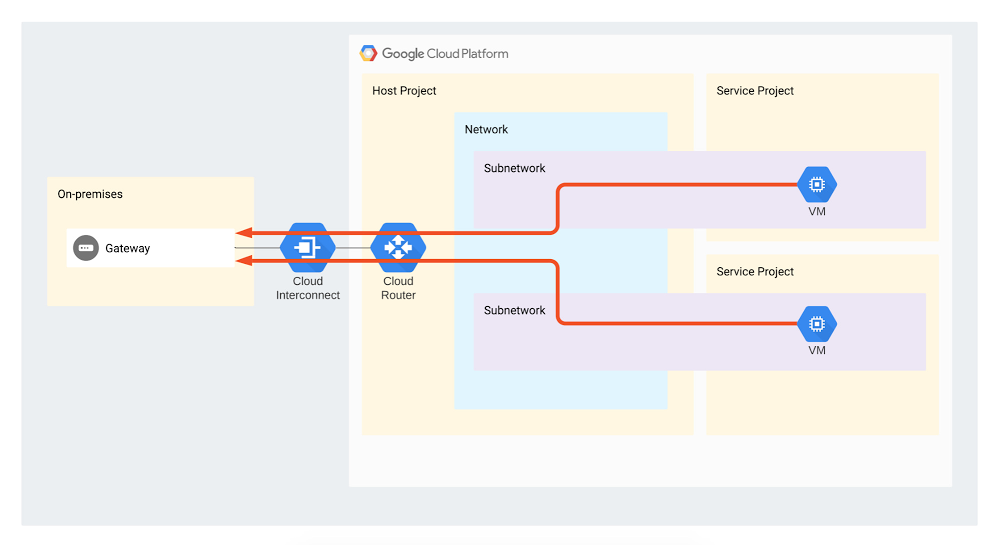
Network traffic analysis is one of the core ways an organization can understand how workloads are performing, optimize network behavior and costs, and conduct troubleshooting—a must when running mission-critical applications in production. VPC Flow Logs is one such enterprise-grade network traffic analysis tool, providing information about TCP and UDP traffic flow to and from VM instances on Google Cloud, including the instances used as Google Kubernetes Engine (GKE) nodes. You can view VPC Flow Logs in Cloud Logging, export them to third-party tools or to BigQuery for further analysis. But as it happens with powerful tools, VPC Flow Logs users sometimes don’t know where to start. To help, we created a set of guides to help you use VPC Flow Logs to answer common questions about your network. This post outlines a set of open-source tools from Google Cloud Professional Services that provide export, analytics and reporting capabilities for multiple use-cases: Estimating the cost of your VPC Flow Logs and optimizing costs Enforcing that flow logs be generated across your organization, to comply with security policiesExporting to BigQuery and performing analytics, e.g., doing cost analysis by identifying top talkers in your environment and understanding Interconnect utilization by different projectsAll of these tools and tutorials are available on GitHub. Let’s take a closer look at each of these use cases.1. Estimate the cost of your VPC Flow Logs and optimize log volume Before you commit to using VPC Flow Logs, it’s a good idea to get a sense of how large your environment might get, so as not to get caught off guard by the cost. You can estimate the size of VPC Flow Logs prior to enabling logging in your environment using the Pricing Calculator to generate a cost estimate based on your projected usage. You can view the estimated logs size generated per day via the subnet editing interface in the Cloud Console. If you want to estimate costs prior to enabling Flow Logs on multiple subnets, projects or an entire workspace, this Cloud Monitoring sample dashboard can estimate the size of your flow logs based on your traffic volume and log usage. If needed, you can reduce the size of your VPC Flow Logs using a different sampling rate. This has a relatively low impact on the accuracy of your results, especially when looking at traffic statistics such as top talkers. You can also filter logs according to your needs, further reducing log volume. 2. Enforce Flow Logs use across your organization VPC Flow Logs provide auditing capabilities for the network, which is required for security and compliance purposes (many organizations mandate that VPC Flow Logs be enabled across the entire organization). To help, we created a script which uses Cloud Functions to enforce VPC Flow Logs in all the networks under a particular folder. The cloud function listens on a Pub/Sub topic for notifications about changes in subnets.You can find an overview and Terraform code here.3. Perform analyticsIf you want to perform cost analysis on your VPC Flow Logs, we also created a tutorial and Terraform code that show you how to easily export VPC Flow Logs into BigQuery and run analytics on them. Specifically, these scripts answer two different questions:Understand Interconnect utilization by different projects This Terraform code and tutorial describe and provide a mechanism for analyzing VPC Flow Logs to estimate Interconnect attachment usage by different projects. They are intended to be used by the network administrator who administers the landing zone (an environment that’s been provisioned and prepared to host workloads in Google Cloud).VPC Flow Logs capture different flows to and from VMs, but this script focuses only on egress traffic flowing through the Interconnect (as shown by red arrows on the diagram). The reason the script only focuses on egress is because you are only billed for traffic from the VPC towards the Interconnect (unless there is a resource that is processing ingress traffic, such as a load balancer).Click to enlargeIdentify top talkers This Terraform code lets you analyze VPC Flow Logs to identify top talker subnets to configurable IP address ranges such as on-prem, internet, specific addresses and more.Get started todayOf course, these are just a few use cases for this tool, which range from security use-cases to performing cost breakdowns and estimates. If you want to request a specific capability, do feel free to contact us and ask. The same goes for any specific analytics that you’ve created for VPC Flow Logs—we’d be thrilled for you to contribute them to this repository. To learn more, check out the VPC Flow Logs documentation.We’d like to thank the many Google Cloud folks who have made this possible: Alfonso Palacios, Anastasiia Manokhina, Andras Gyomrey, Charles Baer, Ephi Sachs, Gaspar Chilingarov, and Xiang Shen.
Quelle: Google Cloud Platform








