Demystifying BigQuery BI Engine
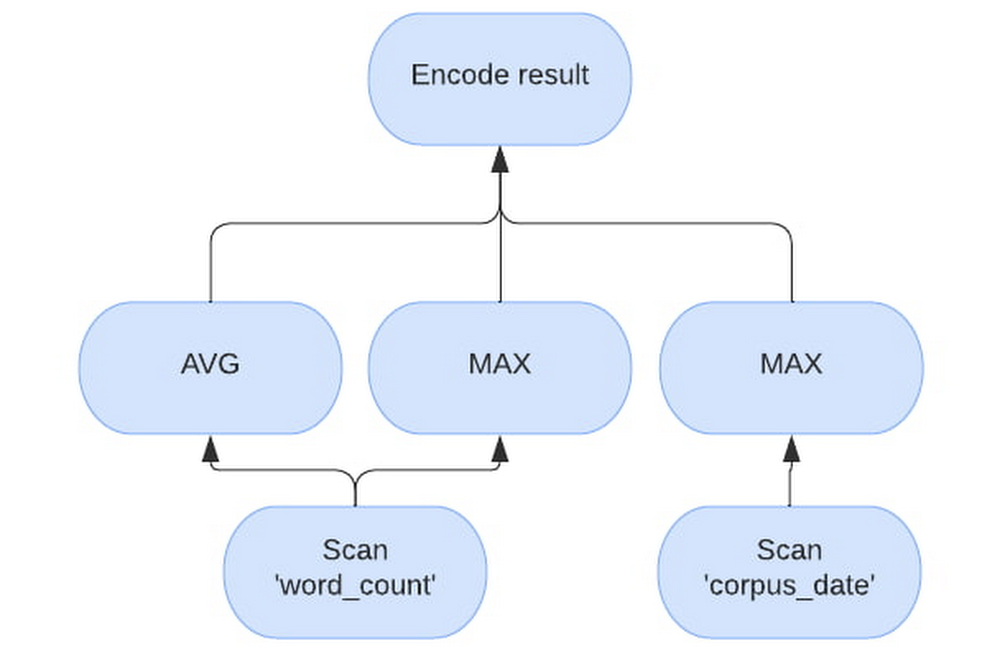
BigQuery BI Engine is a fast, in-memory analysis system for BigQuery currently processing over 2 billion queries per month and growing. BigQuery has its roots in Google’s Dremel system and is a data warehouse built with scalability as a goal. On the other hand BI Engine was envisioned with data analysts in mind and focuses on providing value on Gigabyte to sub-Terabyte datasets, with minimal tuning, for real time analytics and BI purposes.Using BI Engine is simple – create a memory reservation on the project that runs BigQuery queries, and it will cache data and use the optimizations. This post is a deep dive into how BI Engine helps deliver blazing fast performance for your BigQuery queries and what users can do to leverage its full potential. BI Engine optimizationsThe two main pillars of BI Engine are in-memory caching of data and vectorized processing. Other optimizations include CMETA metadata pruning, single-node processing, and join optimizations for smaller tables.Vectorized engineBI Engine utilizes the “Superluminal” vectorized evaluation engine which is also used for YouTube’s analytic data platform query engine – Procella. In BigQuery’s row-based evaluation, the engine will process all columns within a row for every row. The engine is potentially alternating between column types and memory locations before going to the next row. In contrast, a vectorized engine like Superluminal will process a block of values of the same type from a single column for as long as possible and only switch to the next column when necessary. This way, hardware can run multiple operations at once using SIMD, reducing both latency and infrastructure costs. BI Engine dynamically chooses block size to fit into caches and available memory.For the example query, “SELECT AVG(word_count), MAX(word_count), MAX(corpus_date) FROM samples.shakespeare”, will have the following vectorized plan. Note how the evaluation processes “word_count” separately from “corpus_date”.In-memory cacheBigQuery is a disaggregated storage and compute engine. Usually the data in BigQuery is stored on Google’s distributed file system – Colossus, most often in blocks in Capacitor format and the compute is represented by Borg tasks. This enables BigQuery’s scaling properties. To get the most out of vectorized processing, BI Engine needs to feed the raw data at CPU speeds, which is achievable only if the data is already in memory. BI Engine runs Borg tasks as well, but workers are more memory-heavy to be able to cache the data as it is being read from Colossus.A single BigQuery query can be either sent to a single BI Engine worker, or sharded and sent to multiple BI Engine workers. Each worker receives a piece of a query to execute with a set of columns and rows necessary to answer it. If the data is not cached in the workers memory from the previous query, the worker loads the data from Colossus into local RAM. Subsequent requests for the same or subset of columns and rows are served from memory only. Note that workers will unload the contents if data hasn’t been used for over 24 hours. As multiple queries arrive, sometimes they might require more CPU time than available on a worker, if there is still reservation available, a new worker will be assigned to same blocks and subsequent requests for the same blocks will be load-balanced between the workers.BI Engine can also process super-fresh data that was streamed to the BigQuery table. Therefore, there are two formats supported by BI Engine workers currently – Capacitor and streaming. In-memory capacitor blocksGenerally, data in a capacitor block is heavily pre-processed and compressed during generation. There are a number of different ways the data from the capacitor block can be cached, some are more memory efficient, while others are more CPU efficient. BI Engine worker intelligently chooses between those preferring latency and CPU-efficient formats where possible. Thus actual reservation memory usage might not be the same as logical or physical storage usage due to the different caching formats.In-memory streaming dataStreaming data is stored in memory as blocks of native array-columns and is lazily unloaded when blocks get extracted into Capacitor by underlying storage processes. Note that for streaming, BI workers need to either go to streaming storage every time to potentially obtain new blocks or serve slightly stale data. BI Engine prefers serving slightly stale data and loading the new streaming blocks in the background instead.BI Engine worker does this opportunistically during the queries, if the worker detects streaming data and the cache is newer than 1 minute, a background refresh is launched in parallel with the query. In practice, this means that with enough requests the data is no more stale than the previous request time. For example if a request arrives every second, then the streaming data will be around a second stale.First requests loading data are slowDue to the read time optimizations, loading data from previously unseen columns can take longer than BigQuery does. Subsequent reads will benefit from these optimizations.For example, the query above here is backend time for a sample run of the same query with BI Engine off, first run and subsequent run.Multiple block processing and dynamic single worker executionBI Engine workers are optimized for BI workloads where the output size will be small compared to the input size and the output will be mostly aggregated. In regular BigQuery execution, a single worker tries to minimize data loading due to network bandwidth limitations. Instead, BigQuery relies on massive parallelism to complete queries quickly. On the other hand, BI Engine prefers to process more data in parallel on a single machine. If the data has been cached, there is no network bandwidth limitation and BI Engine further reduces network utilization by reducing the number of intermediate “shuffle” layers between query stages.With small enough inputs and a simple query, the entire query will be executed on a single worker and the query plan will have a single stage for the whole processing. We constantly work on making more tables and query shapes eligible for a single stage processing, as this is a very promising way to improve the latency of typical BI queries.For the example query, which is very simple and the table is very small, here is a sample run of the same query with BI Engine distributed execution vs single node (default).How to get most out of BI EngineWhile we all want a switch that we can toggle and everything becomes fast, there are still some best practices to think about when using BI Engine.Output data sizeBI optimizations assume human eyes on the other side and that the size of output data is small enough to be comprehensible by a human. This limited output size is achieved by selective filters and aggregations. As a corollary, instead of SELECT * (even with a LIMIT), a better approach will be to provide the fields one is interested in with an appropriate filter and aggregation.To show this on an example – query “SELECT * FROM samples.shakespeare” processes about 6MB and takes over a second with both BigQuery and BI Engine. If we add MAX to every field – “SELECT MAX(word), MAX(word_count), MAX(corpus), MAX(corpus_date) FROM samples.shakespeare”, both engines will read all of the data, perform some simple comparisons and finish 5 times faster on BigQuery and 50 times faster on BI Engine.Help BigQuery with organizing your dataBI Engine uses query filters to narrow down the set of blocks to read. Therefore, partitioning and clustering your data will reduce the amount of data to read, latency and slot usage. With a caveat, that “over partitioning” or having too many partitions might interfere with BI Engine multi-block processing. For optimal BigQuery and BI Engine performance, partitions larger than one gigabyte are preferred.Query depthBI Engine currently accelerates stages of the query that read data from the table, which are typically the leaves of the query execution tree. What this means in practice is that almost every query will use some BigQuery slots.That’s why one gets the most speedup from BI Engine when a lot of time is spent on leaf stages. To mitigate this, BI Engine tries to push as many computations as possible to the first stage. Ideally, execute them on a single worker, where the tree is just one node.For example Query1 of TPCH 10G benchmark, is relatively simple. It is 3 stages deep with efficient filters and aggregations that processes 30 million rows, but outputs just 1.Running this query in BI Engine we see that the full query took 215 ms with “S00: Input” stage being the one accelerated by BI Engine taking 26 ms.Running the same query in BigQuery gets us 583ms, with “S00: Input” taking 229 ms.What we see here is that the “S00: Input” stage run time went down 8x, but the overall query did not get 8x faster, as the other two stages were not accelerated and their run time remained roughly the same. With breakdown between stages illustrated by the following figure.In a perfect world, where BI Engine processes its part in 0 milliseconds, the query will still take 189ms to complete. So the maximum speed gain for this query is about 2-3x. If we, for example, make this query heavier on the first stage, by running TPCH 100G instead, we see that BI Engine finishes the query 6x faster than BigQuery, while the first stage is 30 times faster!vs 1 second on BigQueryOver time, our goal is to expand the eligible query and data shapes and collapse as many operations as feasible into a single BI Engine stage to realize maximum gains.JoinsAs previously noted, BI Engine accelerates “leaf” stages of the query. However, there is one very common pattern used in BI tools that BI Engine optimizes. It’s when one large “fact” table is joined with one or more smaller “dimension” tables. Then BI Engine can perform multiple joins, all in one leaf stage, using so-called “broadcast” join execution strategy.During the broadcast join, the fact table is sharded to be executed in parallel on multiple nodes, while the dimension tables are read on each node in their entirety.For example, let’s run Query 3 from the TPC-DS 1G benchmark. The fact table is store_sales and the dimension tables are date_dim and item. In BigQuery the dimension tables will be loaded into shuffle first, then the “S03: Join+” stage will, for every parallel part of store_sales, read all necessary columns of two dimension tables, in their entirety, to join.Note that filters on date_dim and item are very efficient, and the 2.9M row fact table is joined only with about 6000 rows. BI Engine plan will look a bit different, as BI Engine will cache the dimension tables directly, but the same principle applies. For BI Engine, let’s assume that two nodes will process the query due to the store_sales table being too big for a single node processing. We can see on the image below that both nodes will have similar operations – reading the data, filtering, building the lookup table and then performing the join. While only a subset of data for the store_sales table is being processed on each, all operations on dimension tables are repeated.Note that”build lookup table” operation is very CPU intensive compared to filtering”join” operation performance also suffers if the lookup tables are large, as it interferes with CPU cache localitydimension tables need to be replicated to each “block” of fact tableThe takeaway is when join is performed by BI Engine, the fact table is sometimes split into different nodes. All other tables will be copied multiple times on every node to perform the join. Keeping dimension tables small or selective filters will help to make sure join performance is optimal.ConclusionsSummarizing everything above, there are some things one can do to make full use of BI Engine and make their queries fasterLess is more when it comes to data returned – make sure to filter and aggregate as much data as possible early in the query. Push down filters and computations into BI Engine.Queries with a small number of stages get the best acceleration. Preprocessing the data to minimize query complexity will help with optimal performance. For example, using materialized views can be a good option.Joins are sometimes expensive, but BI Engine may be very efficient in optimizing typical star schema queries.It’s beneficial to partition and/or cluster the tables to limit the amount of data to be read.Special thanks to Benjamin Liles, Software Engineer for BI Engine, Deepak Dayama, Product Manager for BI Engine, for contributing to this post.
Quelle: Google Cloud Platform


