Special thanks to Cody Ebberson and the Medplum team for their open-source contribution and for sharing their migration experience with the community. A real-world example of migrating a HIPAA-compliant EHR platform to DHI with minimal code changes.
Healthcare software runs on trust. When patient data is at stake, security isn’t just a feature but a fundamental requirement. For healthcare platform providers, proving that trust to enterprise customers is an ongoing challenge that requires continuous investment in security posture, compliance certifications, and vulnerability management.
That’s why we’re excited to share how Medplum, an open-source healthcare platform serving over 20 million patients, recently migrated to Docker Hardened Images (DHI). This migration demonstrates exactly what we designed DHI to deliver: enterprise-grade security with minimal friction. Medplum’s team made the switch with just 54 lines of changes across 5 files – a near net-zero code change that dramatically improved their security posture.
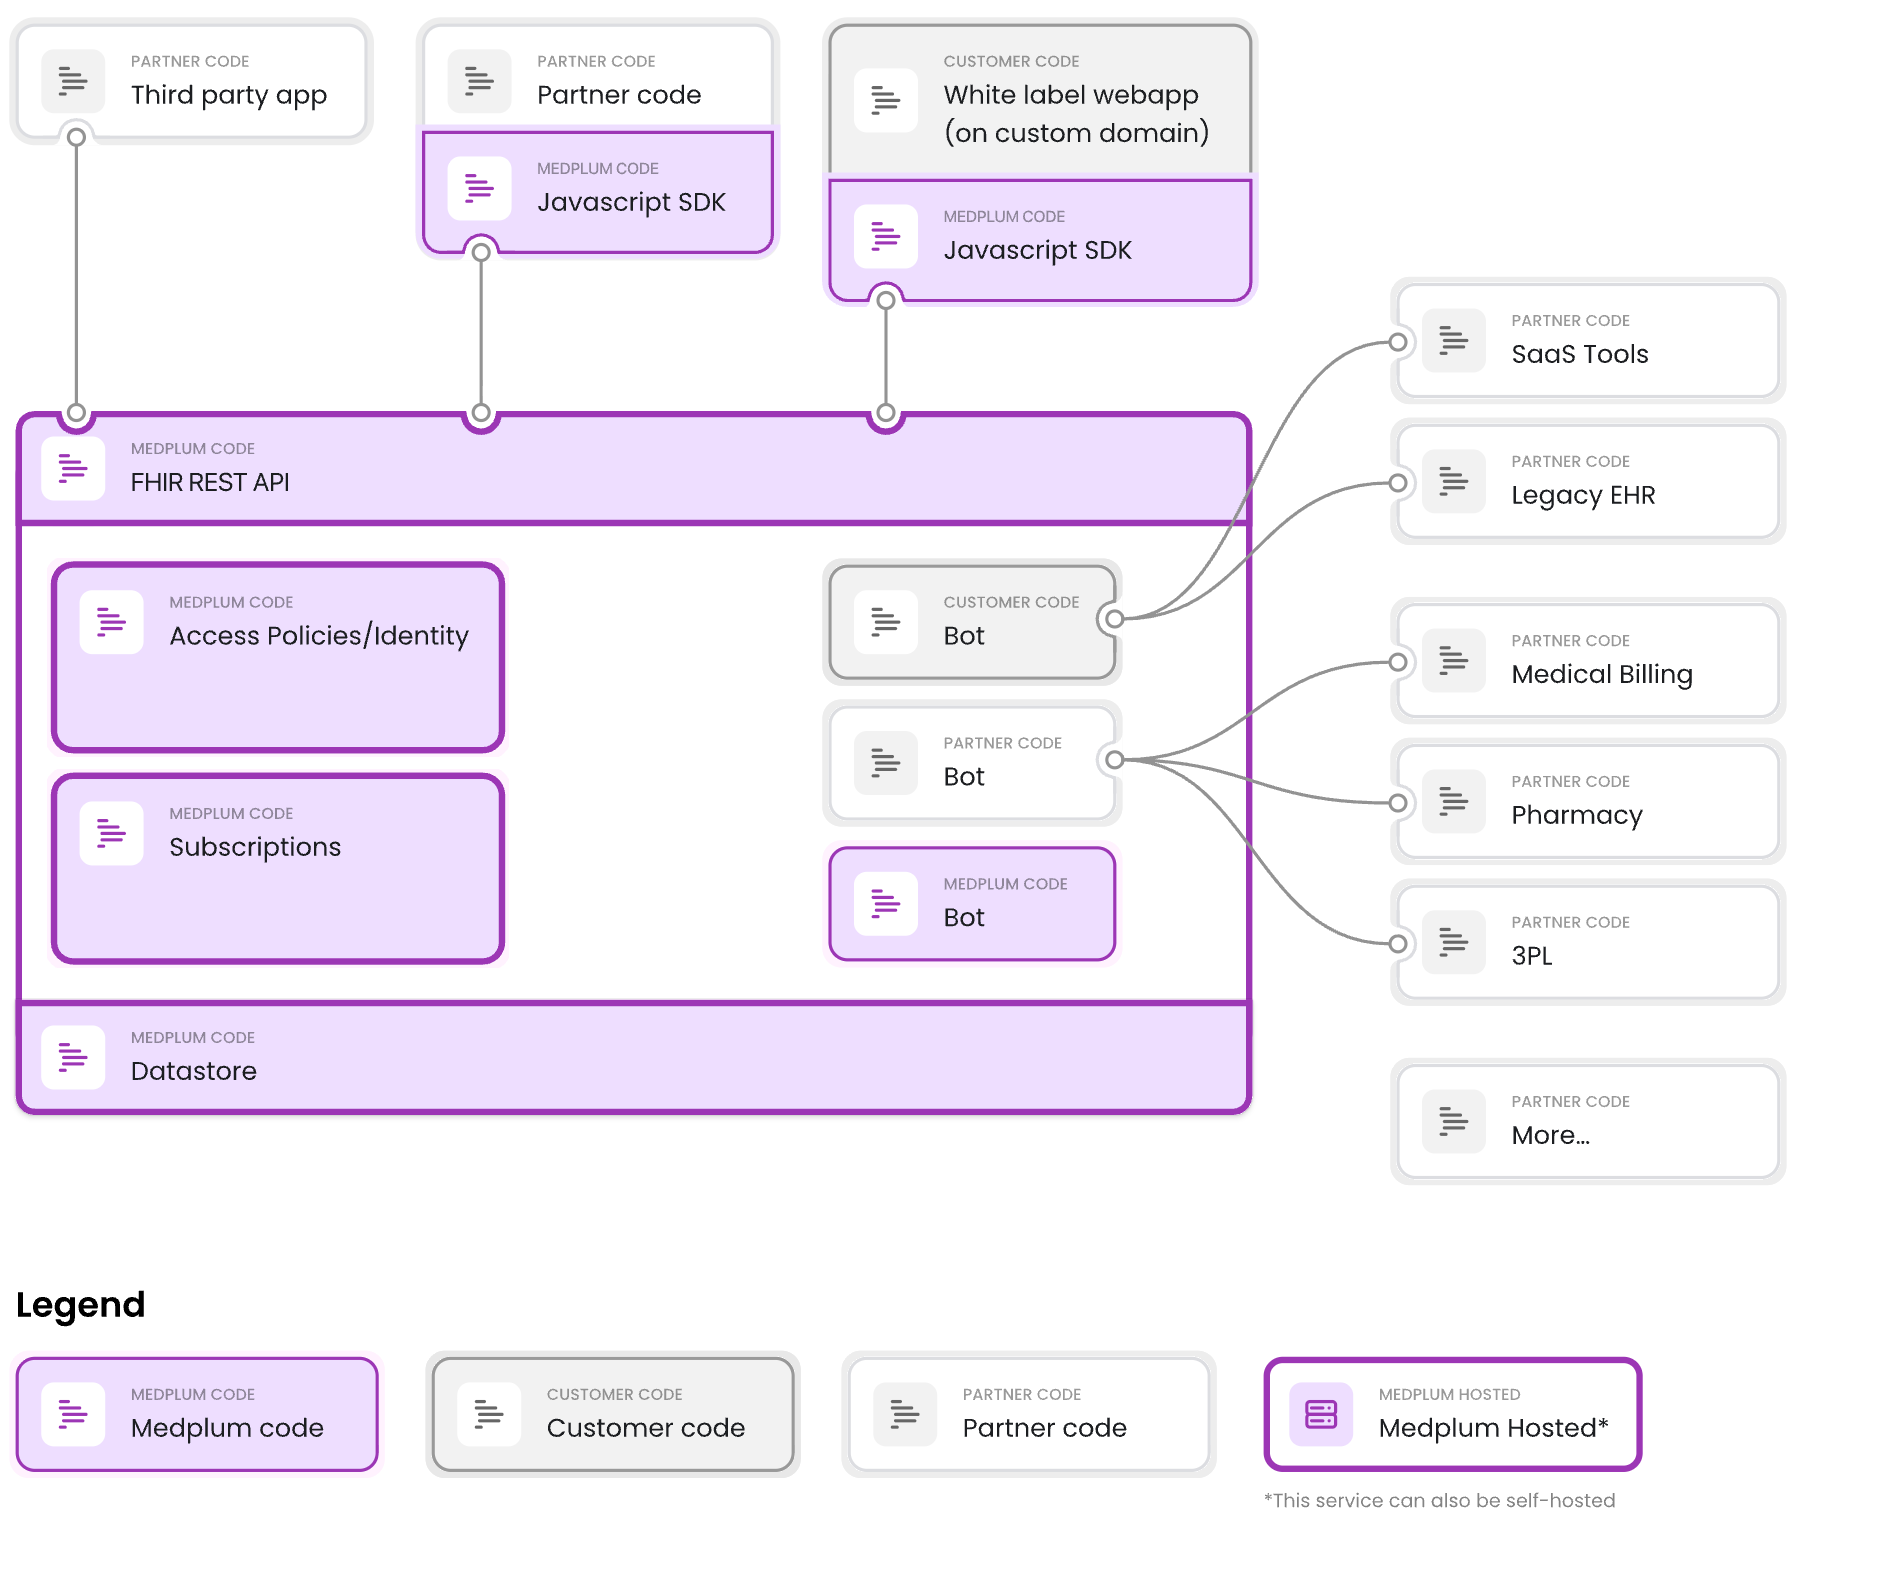
Medplum is a headless EHR; the platform handles patient data, clinical workflows, and compliance so developers can focus on building healthcare apps. Built by and for healthcare developers, the platform provides:
HIPAA and SOC2 compliance out of the box
FHIR R4 API for healthcare data interoperability
Self-hosted or managed deployment options
Support for 20+ million patients across hundreds of practices
With over 500,000 pulls on Docker Hub for their medplum-server image, Medplum has become a trusted foundation for healthcare developers worldwide. As an open-source project licensed under Apache 2.0, their entire codebase, including Docker configurations, is publicly available onGitHub. This transparency made their DHI migration a perfect case study for the community.
Caption: Medplum is a headless EHR; the platform handles patient data, clinical workflows, and compliance so developers can focus on building healthcare apps.
Medplum is developer-first. It’s not a plug-and-play low-code tool, it’s designed for engineering teams that want a strong FHIR-based foundation with full control over the codebase.
The Challenge: Vulnerability Noise and Security Toil
Healthcare software development comes with unique challenges. Integration with existing EHR systems, compliance with regulations like HIPAA, and the need for robust security all add complexity and cost to development cycles.
“The Medplum team found themselves facing a challenge common to many high-growth platforms: “Vulnerability Noise.” Even with lean base images, standard distributions often include non-essential packages that trigger security flags during enterprise audits. For a company helping others achieve HIPAA compliance, every “Low” or “Medium” CVE (Common Vulnerability and Exposure) requires investigation and documentation, creating significant “security toil” for their engineering team.”
Reshma Khilnani
CEO, Medplum
Medplum addresses this by providing a compliant foundation. But even with that foundation, their team found themselves facing another challenge common to high-growth platforms: “Vulnerability Noise.”
Healthcare is one of the most security-conscious industries. Medplum’s enterprise customers, including Series C and D funded digital health companies, don’t just ask about security; they actively verify it. These customers routinely scan Medplum’s Docker images as part of their security due diligence.
Even with lean base images, standard distributions often include non-essential packages that trigger security flags during enterprise audits. For a company helping others achieve HIPAA compliance, every “Low” or “Medium” CVE requires investigation and documentation. This creates significant “security toil” for their engineering team.
The First Attempt: Distroless
This wasn’t Medplum’s first attempt at solving the problem. Back in November 2024, the team investigated Google’s distroless images as a potential solution.
The motivations were similar to what DHI would later deliver:
Less surface area in production images, and therefore less CVE noise
Smaller images for faster deployments
Simpler build process without manual hardening scripts
The idea was sound. Distroless images strip away everything except the application runtime: no shell, no package manager, minimal attack surface. On paper, it was exactly what Medplum needed.
But the results were mixed. Image sizes actually increased. Build times went up. There were concerns about multi-architecture support for native dependencies. The PR was closed without merging.
The core problem remained: many CVEs in standard images simply aren’t actionable. Often there isn’t a fix available, so all you can do is document and explain why it doesn’t apply to your use case. And often the vulnerability is in a corner of the image you’re not even using, like Perl, which comes preinstalled on Debian but serves no purpose in a Node.js application.
Fully removing these unused components is the only real answer. The team knew they needed hardened images. They just hadn’t found the right solution yet.
The Solution: Docker Hardened Images
When Docker made Hardened Images freely available under Apache 2.0, Medplum’s team saw an opportunity to simplify their security posture while maintaining compatibility with their existing workflows.
By switching to Docker Hardened Images, Medplum was able to offload the repetitive work of OS-level hardening – like configuring non-root users and stripping out unnecessary binaries – to Docker. This allowed them to provide their users with a “Secure-by-Default” image that meets enterprise requirements without adding complexity to their open-source codebase.
This shift is particularly significant for an open-source project. Rather than maintaining custom hardening scripts that contributors need to understand and maintain, Medplum can now rely on Docker’s expertise and continuous maintenance. The security posture improves automatically with each DHI update, without requiring changes to Medplum’s Dockerfiles.
“By switching to Docker Hardened Images, Medplum was able to offload the repetitive work of OS-level hardening—like configuring non-root users and stripping out unnecessary binaries—to Docker. This allowed their users to provide their users with a “Secure-by-Default” image that meets enterprise requirements without adding complexity to their open-source codebase.”
Cody Ebberson
CTO, Medplum
The Migration: Real Code Changes
The migration was remarkably clean. Previously, Medplum’s Dockerfile required manual steps to ensure security best practices. By moving to DHI, they could simplify their configuration significantly.
Let’s look at what actually changed. Here’s the complete server Dockerfile after the migration:
# Medplum production Dockerfile
# Uses Docker "Hardened Images":
# https://hub.docker.com/hardened-images/catalog/dhi/node/guides
# Supported architectures: linux/amd64, linux/arm64
# Stage 1: Build the application and install production dependencies
FROM dhi.io/node:24-dev AS build-stage
ENV NODE_ENV=production
WORKDIR /usr/src/medplum
ADD ./medplum-server-metadata.tar.gz ./
RUN npm ci –omit=dev &&
rm package-lock.json
# Stage 2: Create the runtime image
FROM dhi.io/node:24 AS runtime-stage
ENV NODE_ENV=production
WORKDIR /usr/src/medplum
COPY –from=build-stage /usr/src/medplum/ ./
ADD ./medplum-server-runtime.tar.gz ./
EXPOSE 5000 8103
ENTRYPOINT [ "node", "–require", "./packages/server/dist/otel/instrumentation.js", "packages/server/dist/index.js" ]
Notice what’s not there:
No groupadd or useradd commands: DHI runs as non-root by default
No chown commands: permissions are already correct
No USER directive: the default user is already non-privileged
Before vs. After: Server Dockerfile
Before (node:24-slim):
FROM node:24-slim
ENV NODE_ENV=production
WORKDIR /usr/src/medplum
ADD ./medplum-server.tar.gz ./
# Install dependencies, create non-root user, and set permissions
RUN npm ci &&
rm package-lock.json &&
groupadd -r medplum &&
useradd -r -g medplum medplum &&
chown -R medplum:medplum /usr/src/medplum
EXPOSE 5000 8103
# Switch to the non-root user
USER medplum
ENTRYPOINT [ "node", "–require", "./packages/server/dist/otel/instrumentation.js", "packages/server/dist/index.js" ]
After (dhi.io/node:24):
FROM dhi.io/node:24-dev AS build-stage
ENV NODE_ENV=production
WORKDIR /usr/src/medplum
ADD ./medplum-server-metadata.tar.gz ./
RUN npm ci –omit=dev && rm package-lock.json
FROM dhi.io/node:24 AS runtime-stage
ENV NODE_ENV=production
WORKDIR /usr/src/medplum
COPY –from=build-stage /usr/src/medplum/ ./
ADD ./medplum-server-runtime.tar.gz ./
EXPOSE 5000 8103
ENTRYPOINT [ "node", "–require", "./packages/server/dist/otel/instrumentation.js", "packages/server/dist/index.js" ]
The migration also introduced a cleaner multi-stage build pattern, separating metadata (package.json files) from runtime artifacts.
Before vs. After: App Dockerfile (Nginx)
The web app migration was even more dramatic:
Before (nginx-unprivileged:alpine):
FROM nginxinc/nginx-unprivileged:alpine
# Start as root for permissions
USER root
COPY <<EOF /etc/nginx/conf.d/default.conf
# … nginx config …
EOF
ADD ./medplum-app.tar.gz /usr/share/nginx/html
COPY ./docker-entrypoint.sh /docker-entrypoint.sh
# Manual permission setup
RUN chown -R 101:101 /usr/share/nginx/html &&
chown 101:101 /docker-entrypoint.sh &&
chmod +x /docker-entrypoint.sh
EXPOSE 3000
# Switch back to non-root
USER 101
ENTRYPOINT ["/docker-entrypoint.sh"]
After (dhi.io/nginx:1):
FROM dhi.io/nginx:1
COPY <<EOF /etc/nginx/nginx.conf
# … nginx config …
EOF
ADD ./medplum-app.tar.gz /usr/share/nginx/html
COPY ./docker-entrypoint.sh /docker-entrypoint.sh
EXPOSE 3000
ENTRYPOINT ["/docker-entrypoint.sh"]
Results: Improved Security Posture
After merging the changes, Medplum’s team shared their improved security scan results. The migration to DHI resulted in:
Dramatically reduced CVE count – DHI’s minimal base means fewer packages to patch
Non-root by default – No manual user configuration required
No shell access in production – Reduced attack surface for container escape attempts
Continuous patching – All DHI images are rebuilt when upstream security updates are available
For organizations that require stronger guarantees, Docker Hardened Images Enterprise adds SLA-backed remediation timelines, image customizations, and FIPS/STIG variants.
Most importantly, all of this was achieved with zero functional changes to the application. The same tests passed, the same workflows worked, and the same deployment process applied.
CI/CD Integration
Medplum also updated their GitHub Actions workflow to authenticate with the DHI registry:
– name: Login to Docker Hub
uses: docker/login-action@v2.2.0
with:
username: ${{ secrets.DOCKERHUB_USERNAME }}
password: ${{ secrets.DOCKERHUB_TOKEN }}
– name: Login to Docker Hub Hardened Images
uses: docker/login-action@v2.2.0
with:
registry: dhi.io
username: ${{ secrets.DOCKERHUB_USERNAME }}
password: ${{ secrets.DOCKERHUB_TOKEN }}
This allows their CI/CD pipeline to pull hardened base images during builds. The same Docker Hub credentials work for both standard and hardened image registries.
The Multi-Stage Pattern for DHI
One pattern worth highlighting from Medplum’s migration is the use of multi-stage builds with DHI variants:
Build stage: Use dhi.io/node:24-dev which includes npm/yarn for installing dependencies
Runtime stage: Use dhi.io/node:24 which is minimal and doesn’t include package managers
This pattern ensures that build tools never make it into the production image, further reducing the attack surface. It’s a best practice for any containerized Node.js application, and DHI makes it straightforward by providing purpose-built variants for each stage.
Medplum’s Production Architecture
Medplum’s hosted offering runs on AWS using containerized workloads. Their medplum/medplum-server image, built on DHI base images, now deploys to production.
Here’s how the build-to-deploy flow works:
Build time: GitHub Actions pulls dhi.io/node:24-dev and dhi.io/node:24 as base images
Push: The resulting hardened image is pushed to medplum/medplum-server on Docker Hub
Deploy: AWS Fargate pulls medplum/medplum-server:latest and runs the hardened container
The deployed containers inherit all DHI security properties (non-root execution, minimal attack surface, no shell) because they’re built on DHI base images. This demonstrates that DHI works seamlessly with production-grade infrastructure including:
AWS Fargate/ECS for container orchestration
Elastic Load Balancing for high availability
Aurora PostgreSQL for managed database
ElastiCache for Redis caching
CloudFront for CDN and static assets
No infrastructure changes were required. The same deployment pipeline, the same Fargate configuration, just a more secure base image.
Why This Matters for Healthcare
For healthcare organizations evaluating container security, Medplum’s migration offers several lessons:
1. Eliminating “Vulnerability Noise”
The biggest win from DHI isn’t just security, it’s reducing the operational burden of security. Fewer packages means fewer CVEs to investigate, document, and explain to customers. For teams without dedicated security staff, this reclaimed time is invaluable.
2. Compliance-Friendly Defaults
HIPAA requires covered entities to implement technical safeguards including access controls and audit controls. DHI’s non-root default and minimal attack surface align with these requirements out of the box. For companies pursuing SOC 2 Type 2 certification, which Medplum implemented from Day 1, or HITRUST certification, DHI provides a stronger foundation for the technical controls auditors evaluate.
3. Reduced Audit Surface
When security teams audit container configurations, DHI provides a cleaner story. Instead of explaining custom hardening scripts or why certain CVEs don’t apply, teams can point to Docker’s documented hardening methodology, SLSA Level 3 provenance, and independent security validation by SRLabs. This is particularly valuable during enterprise sales cycles where customers scan vendor images as part of due diligence.
4. Practicing What You Preach
For platforms like Medplum that help customers achieve compliance, using hardened images isn’t just good security, it’s good business. When you’re helping healthcare organizations meet regulatory requirements, your own infrastructure needs to set the example.
5. Faster Security Response
With DHI Enterprise, critical CVEs are patched within 7 days. For healthcare organizations where security incidents can have regulatory implications, this SLA provides meaningful risk reduction and a concrete commitment to share with customers.
Conclusion
Medplum’s migration to Docker Hardened Images demonstrates that improving container security doesn’t have to be painful. With minimal code changes (54 additions and 52 deletions) they achieved:
Secure-by-Default images that meet enterprise requirements
Automatic non-root execution
Dramatically reduced CVE surface
Simplified Dockerfiles with no manual hardening scripts
Less “security toil” for their engineering team
A stronger compliance story for enterprise customers
By offloading OS-level hardening to Docker, Medplum can focus on what they do best: building healthcare infrastructure while their security posture improves automatically with each DHI update.
For a platform with 500,000+ Docker Hub pulls serving healthcare organizations worldwide, this migration shows that DHI is ready for production workloads at scale. More importantly, it shows that security improvements can actually reduce operational burden rather than add to it.
For platforms helping others achieve compliance, practicing what you preach matters. With Docker Hardened Images, that just got a lot easier.
Ready to harden your containers? Explore the Docker Hardened Images documentation or browse the free DHI catalog to find hardened versions of your favorite base images.
Resources
Medplum DHI Pull Request
Medplum GitHub Repository
Docker Hardened Images Documentation
DHI Free Announcement
DHI Node.js Guide
Quelle: https://blog.docker.com/feed/