Introducing the Docker Community Directory and Docker Community Slack

Today, we’re thrilled to officially introduce the Community Directory and Slack to further enable community building and collaboration. Our goal is to give everyone the opportunity to become a more informed and engaged member of the community by creating sub groups and channels based on location, language, use cases, interest in specific Docker-centric projects or initiatives.
 
Sign up for the Docker Community Directory and Slack
 
Docker Community Directory
Members who join the Docker Community Directory will benefit from the following:

Latest product updates and release notes
Targeted invitations and promo codes for Docker community events (DockerCon, Docker Summits, Meetups, Docker Partner events, trainings, workshops and hackathons)
Ability to participate in raffles for Docker Swag
Chance to get priority access to product betas
Opportunity to get involved as a user and/or customer reference, meetup organizer, mentor, speaker, etc.
Be listed on the Docker Community Directory without sharing your email (built in direct messaging system)
Access to the Docker Community Slack

The Docker Community Directory is a tool for community members to collaborate. Everyone should use it respectfully, with genuine and specific Docker-centric messages. It should not be used to send messages that could be qualified as spam or otherwise violate Docker’s community code of conduct. We invite community members who think the directory is not being used properly by one member to reach out to community@docker.com with more information, so that we can address the situation accordingly. Those members not abiding by the community code of conduct and misusing the platform will be subject to a warning and potential removal from the directory.
Docker Community Slack
We launched the Docker Community Slack a few months ago, so that the Docker Team could easily collaborate with two key groups of amazing contributors: Docker Captains and Docker Meetup Organizers. After a few weeks of planning and figuring out the best way to proceed, we are now ready and excited to extend the invitation to the broader community!
Due to a high level of engagement, our Slack team reaches the 10,000 messages archive limit very quickly, you might not able to see older slack messages. Everyone interested in seeing or searching older messages can look at our Community Slack archive here: dockercommunity.slackarchive.io
How can I be invited to join?
Docker has set up a registration form. Provide the information required and a Slack invite will be sent to you. You can also contact community@docker.com if you have any questions or concerns.
What’s the Docker Community Slack URL ?
Once you’ve received the invitation and joined our slack team, you can go to dockercommunity.slack.com to login.
Who are the admins of the Docker Community Slack?
Karen Bajza (@kbajza), Lisa McNicol (@lisa.mcnicol), Sophia Parafina (@spara), Mano Marks (@mano), Jenny Burcio (@jenny), Sebastiaan van Stijn (@thajeztah) and Victor Coisne (@vcoisne) are the current administrators of the Docker Community Slack team and private channels. They are also in charge of monitoring compliance with the code of conduct. If you witness inappropriate behaviour, please reach out to one of us so that we can respond appropriately.
Who should I contact if I want to create a new public or private channel?
The Docker Community Team is the central authority for this Slack team. If you’re interested in creating a new public or private channel for your topic of interest, language or location, please reach out to one of the administrators listed above.
What happens to the IRC and Gitter channels?
The IRC and Gitter channels will be closed down. We will post an announcement on those channels before closing, so that users have time to register for Slack. We have enabled gateway access for users that prefer using XMPP or IRC client. Instructions for connecting an XMPP or IRC client can be found on the Slack website.

Sign up for the docker Community Directory and Slack to meet, share and learn!Click To Tweet

The post Introducing the Docker Community Directory and Docker Community Slack appeared first on Docker Blog.
Quelle: https://blog.docker.com/feed/
What’s New in Docker Datacenter with Engine 1.12 – Demo Q&A

Last week we announced the latest release of (DDC) with Engine 1.12 integration, which includes Universal Control Plane (UCP) 2.0 and Docker Trusted Registry (DTR) 2.1. Now, IT operations teams can manage and secure their environment more effectively and developers can self-service select from an even more secure image base. Docker Datacenter with Engine 1.12 boasts improvements in orchestration and operations, end to end security (image signing, policy enforcement, mutual TLS encryption for clusters), enables Docker service deployments and includes an enhanced UI. Customers also have backwards compatibility for Swarm 1.x and Compose.

 
To showcase some of these new features we hosted a webinar where we provided an overview of Docker Datacenter, talked through some of the new features and showed a live demo of solution. Watch the recording of the webinar below:


We hosted a Q&A session at the end of the webinar and have included some of the most common audience questions  received.
Audience Q&A
Can I still deploy run and deploy my applications built with a previous Docker Engine version?
Yes. UCP 2.0 automatically sets up and manages a Swarm cluster alongside the native built-in swarm-mode cluster from Engine 1.12 on the same set of nodes. This means that when you use “docker run” commands, they are handled by the Swarm 1.x part of the UCP cluster and thus ensures full backwards compatibility with your existing Docker applications. The best part is, no additional product installation or configuration is required by the admin to make this work.In addition to this, previous versions of the Docker Engine (1.10 and 1.11) will still be supported as part of Docker Datacenter.
 
Will Docker Compose continue to work in Docker Datacenter?  I.e Deploy containers to multiple hosts in a DDC cluster, as opposed to only on a single host?
In UCP, “docker-compose up” will deploy to multiple hosts on the cluster. This is different from an open-source Engine 1.12 swarm-mode, where it will only deploy on a single node, because UCP offers full backwards compatibility (using the parallel Swarm 1.x cluster, as described above). Note that you will have to use Compose v2 in order to deploy across multiple hosts, as Compose v1 format does not support multi-host deployment.
 
For the built in HTTP routing mesh, which External LB&;s are supported? Nginx, HAProxy, AWS EC2 Elastic LB? Does this work similar to what Interlock was doing?
The experimental HTTP routing mesh (HRM) feature is focused on providing correct routing between hostnames and services, so it will  work across any of the above load balancers, as long as you configure them appropriately for this purpose.
The HRM and Interlock LB/SD feature sets provide similar capabilities but for different application architectures. HRM is used for swarm-mode based services, while Interlock is used for non-swarm-mode “docker run” containers.
For more information on these features, check out our blog post on DDC networking updates and the updated reference architecture linked within that post.
 
Will the HTTP routing mesh feature be available also in the open source free version of the docker engine?
Docker Engine 1.12 (open-source) contains the TCP-based routing mesh, which allows you to route based on ports. Docker Datacenter also provides the HTTP routing mesh feature which extends the open-source feature to allow you to route based on hostnames.
 
What is “docker service” used for and why?
A Docker service is a construct within swarm-mode that consists of a group of containers (“tasks”) from the same image. Services follow a declarative model that allows you to specify the desired state of your application: you specify how many instances of the container image you want, and swarm-mode ensures that those instances are deployed on the cluster. If any of those instances go down (e.g. because a host is lost), swarm-mode automatically reschedules them elsewhere on the cluster. The service also provides integrated load balancing and service discovery for its container instances.
 
What type of monitoring of host health is built in?
The new swarm-mode in Docker Engine 1.12 uses a RAFT-based consensus algorithm to determine the health of nodes in the cluster. Each swarm manager sends regular pings to workers (and to other managers) in order to determine their current status. If the pings return an unhealthy response or do not meet the latency minimums for the cluster (configurable in the settings), then that node might be declared unhealthy and containers will be scheduled elsewhere in the cluster. In Universal Control Plane (UCP), the status of nodes is described in detail in the web UI on the dashboard and Nodes pages.
 
What kind of role based access controls (RBAC) are available for networks and load balancing features?
The previous version of UCP (1.1) had the ability to provide granular label-based access control for containers. We’ve since expanded that granular access control to include both services and networks, so you can use labels to define which networks a team of users has access to, and what level of access that team has. The load balancing features make use of both services and networks so will be access controlled through those resources.
 
Is it possible to enforce a criteria that only allows production DTR run only containers that are signed?
Yes, you can accomplish this using a combination of features in the new version of Docker Datacenter. DTR 2.1 contains a Notary server (Docker Content Trust), which allows you to provide your users cryptographic keys to sign images. UCP 2.0 has the ability to run only signed images on the cluster. Furthermore, you can use “delegations” to define which teams must sign the image prior to it being deployed; for example in a low security cluster you could allows any UCP user to sign, whereas in production, you might require signatures from Release Management, Security, and Developer teams. Learn more about running images with Docker Content Trust here.
 
As a very large enterprise doing various POC&8217;s for Docker, one of the big questions is vulnerabilities in the open source code that can be part of the base images. Is there anything that Docker is developing to counter this?
Earlier this year, we announced Docker Security Scanning, which provides a detailed security profile of Docker images for risk management and software compliance purposes. Docker Security Scanning is currently available for private repositories in Docker Cloud private and coming soon to Docker Datacenter.
 
Is there any possibility to trace which user is accessing a container?
Yes, you can use audit logging. To provide auditing of your cluster, you can utilize UCP’s Remote Log Server feature. This allows you to send system debug information to a syslog server of your choice, including a full list of all commands run against the UCP cluster. This would include information such as which user attempted to deploy or access a container.
 
What checks does the new DDC have for potential noisy neighbor container scenarios, or for rogue containers that can potentially hog the underlying infrastructure?
One of the ways you can provide a check against noisy neighbor scenarios is through the use of runtime resource constraints. These allow you to set limits on how much system resources (e.g. cpu, memory) that any given container is allowed to use. These are configurable within the UI.
 
Do you have a trial license for Docker Datacenter ?
We offer a free 30-day trial of Docker Datacenter. Trial software  can be accessed by visiting the Docker Store &; www.docker.com/trial
 
For pricing, is a node defined as a host machine or a container?
The subscription is licensed and priced on a per node per year basis. A node is anything with the Docker Commercially Supported (CS) Engine installed on it. It could be a bare metal server, cloud instance or within a virtual machine. More pricing details are available here.
 
More Resources:

Request a demo: of the latest Docker Datacenter
See What’s New in Docker Datacenter
Learn more by visiting the Docker Datacenter webpage
Sign up for a free 30 day trial

Check out the FAQ from last week’s Docker Datacenter demo! To Tweet

The post What’s New in Docker Datacenter with Engine 1.12 &8211; Demo Q&;A appeared first on Docker Blog.
Quelle: https://blog.docker.com/feed/

Kompose: a tool to go from Docker-compose to Kubernetes

Editor’s note: Today’s post is by Sebastien Goasguen, Founder of Skippbox, showing a new tool to move from ‘docker-compose’ to Kubernetes.At Skippbox, we developed kompose a tool to automatically transform your Docker Compose application into Kubernetes manifests. Allowing you to start a Compose application on a Kubernetes cluster with a single kompose up command. We’re extremely happy to have donated kompose to the Kubernetes Incubator. So here’s a quick introduction about it and some motivating factors that got us to develop it.Docker is terrific for developers. It allows everyone to get started quickly with an application that has been packaged in a Docker image and is available on a Docker registry. To build a multi-container application, Docker has developed Docker-compose (aka Compose). Compose takes in a yaml based manifest of your multi-container application and starts all the required containers with a single command docker-compose up. However Compose only works locally or with a Docker Swarm cluster.But what if you wanted to use something else than Swarm? Like Kubernetes of course.The Compose format is not a standard for defining distributed applications. Hence you are left re-writing your application manifests in your container orchestrator of choice.We see kompose as a terrific way to expose Kubernetes principles to Docker users as well as to easily migrate from Docker Swarm to Kubernetes to operate your applications in production.Over the summer, Kompose has found a new gear with help from Tomas Kral and Suraj Deshmukh from Red Hat, and Janet Kuo from Google. Together with our own lead kompose developer Nguyen An-Tu they are making kompose even more exciting. We proposed Kompose to the Kubernetes Incubator within the SIG-apps and we received approval from the general Kubernetes community; you can now find kompose in the Kubernetes Incubator.Kompose now supports Docker-compose v2 format, persistent volume claims have been added recently, as well as multiple container per pods. It can also be used to target Openshift deployments, by specifying a different provider than the default Kubernetes. Kompose is also now available in Fedora packages and we look forward to see it in CentOS distributions in the coming weeks.kompose is a single Golang binary that you build or install from the release on GitHub. Let’s skip the build instructions and dive straight into an example.Let’s take it for a spin!Guestbook application with DockerThe Guestbook application has become the canonical example for Kubernetes. In Docker-compose format, the guestbook can be started with this minimal file:version: “2”services:  redis-master:    image: gcr.io/google_containers/redis:e2e    ports:      – “6379”  redis-slave:    image: gcr.io/google_samples/gb-redisslave:v1    ports:      – “6379”    environment:      – GET_HOSTS_FROM=dns  frontend:    image: gcr.io/google-samples/gb-frontend:v4    ports:      – “80:80″    environment:      – GET_HOSTS_FROM=dnsIt consists of three services. A redis-master node, a set of redis-slave that can be scaled and find the redis-master via its DNS name. And a PHP frontend that exposes itself on port 80. The resulting application allows you to leave short messages which are stored in the redis cluster.To get it started with docker-compose on a vanilla Docker host do:$ docker-compose -f docker-guestbook.yml up -dCreating network “examples_default” with the default driverCreating examples_redis-slave_1Creating examples_frontend_1Creating examples_redis-master_1So far so good, this is plain Docker usage. Now let’s see how to get this on Kubernetes without having to re-write anything.Guestbook with ‘kompose’Kompose currently has three main commands up, down and convert. Here for simplicity we will show a single usage to bring up the Guestbook application.Similarly to docker-compose, we can use the kompose up command pointing to the Docker-compose file representing the Guestbook application. Like so:$ kompose -f ./examples/docker-guestbook.yml upWe are going to create Kubernetes deployment and service for your dockerized application.If you need more kind of controllers, use ‘kompose convert’ and ‘kubectl create -f’ instead.INFO[0000] Successfully created service: redis-masterINFO[0000] Successfully created service: redis-slaveINFO[0000] Successfully created service: frontendINFO[0000] Successfully created deployment: redis-masterINFO[0000] Successfully created deployment: redis-slaveINFO[0000] Successfully created deployment: frontendApplication has been deployed to Kubernetes. You can run ‘kubectl get deployment,svc’ for details.kompose automatically converted the Docker-compose file into Kubernetes objects. By default, it created one deployment and one service per compose services. In addition it automatically detected your current Kubernetes endpoint and created the resources onto it. A set of flags can be used to generate Replication Controllers, Replica Sets or Daemon Sets instead of Deployments.And that’s it! Nothing else to do, the conversion happened automatically.Now, if you already now Kubernetes a bit, you’re familiar with the client kubectl and you can check what was created on your cluster.$ kubectl get pods,svc,deploymentsNAME                             READY        STATUS        RESTARTS     AGEfrontend-3780173733-0ayyx        1/1          Running       0            1mredis-master-3028862641-8miqn    1/1          Running       0            1mredis-slave-3788432149-t3ejp     1/1          Running       0            1mNAME                             CLUSTER-IP   EXTERNAL-IP   PORT(S)      AGEfrontend                         10.0.0.34    <none>        80/TCP       1mredis-master                     10.0.0.219   <none>        6379/TCP     1mredis-slave                      10.0.0.84    <none>        6379/TCP     1mNAME                             DESIRED      CURRENT       UP-TO-DATE AVAILABLE   AGEfrontend                         1            1             1            1           1mredis-master                     1            1             1            1           1mredis-slave                      1            1             1            1           1mIndeed you see the three services, the three deployments and the resulting three pods. To access the application quickly, access the _frontend_ service locally and enjoy the Guestbook application, but this time started from a Docker-compose file.Hopefully this gave you a quick tour of kompose and got you excited. They are more exciting features, like creating different type of resources, creating Helm charts and even using the experimental Docker bundle format as input. Check Lachlan Evenson’s blog on using a Docker bundle with Kubernetes. For an overall demo, see our talk from KubeConHead over to the Kubernetes Incubator and check out kompose, it will help you move easily from your Docker compose applications to Kubernetes clusters in production.Download KubernetesGet involved with the Kubernetes project on GitHub Post questions (or answer questions) on Stack Overflow Connect with the community on SlackFollow us on Twitter @Kubernetesio for latest updates
Quelle: kubernetes

Kubernetes Containers Logging and Monitoring with Sematext

Editor’s note: Today’s post is by Stefan Thies, Developer Evangelist, at Sematext, showing key Kubernetes metrics and log elements to help you troubleshoot and tune Docker and Kubernetes.Managing microservices in containers is typically done with Cluster Managers and Orchestration tools. Each container platform has a slightly different set of options to deploy containers or schedule tasks on each cluster node. Because we do container monitoring and logging at Sematext, part of our job is to share our knowledge of these tools, especially as it pertains to container observability and devops. Today we’ll show a tutorial for Container Monitoring and Log Collection on Kubernetes.Dynamic Deployments Require Dynamic MonitoringThe high level of automation for the container and microservice lifecycle makes the monitoring of Kubernetes more challenging than in more traditional, more static deployments. Any static setup to monitor specific application containers would not work because Kubernetes makes its own decisions according to the defined deployment rules. It is not only the deployed microservices that need to be monitored. It is equally important to watch metrics and logs for Kubernetes core services themselves, such as Kubernetes Master running etcd, controller-manager, scheduler and apiserver and Kubernetes Workers (fka minions) running kubelet and proxy service. Having a centralized place to keep an eye on all these services, their metrics and logs helps one spot problems in the cluster infrastructure. Kubernetes core services could be installed on bare metal, in virtual machines or as containers using Docker. Deploying Kubernetes core services in containers could be helpful with deployment and monitoring operations – tools for container monitoring would cover both core services and application containers. So how does one monitor such a complex and dynamic environment?Agent for Kubernetes Metrics and LogsThere are a number of open source docker monitoring and logging projects one can cobble together to build a monitoring and log collection system (or systems). The advantage is that the code is all free. The downside is that this takes times – both initially when setting it up and later when maintaining. That’s why we built Sematext Docker Agent – a modern, Docker-aware metrics, events, and log collection agent. It runs as a tiny container on every Docker host and collects logs, metrics and events for all cluster nodes and all containers. It discovers all containers (one pod might contain multiple containers) including containers for Kubernetes core services, if core services are deployed in Docker containers. Let’s see how to deploy this agent.Deploying Agent to all Kubernetes Nodes Kubernetes provides DeamonSets, which ensure pods are added to nodes as nodes are added to the cluster. We can use this to easily deploy Sematext Agent to each cluster node!Configure Sematext Docker Agent for KubernetesLet’s assume you’ve created an SPM app for your Kubernetes metrics and events, and a Logsene app for your Kubernetes logs, each of which comes with its own token. The Sematext Docker Agent README lists all configurations (e.g. filter for specific pods/images/containers), but we’ll keep it simple here.Grab the latest sematext-agent-daemonset.yml (raw plain-text) template (also shown below)Save it somewhere on diskReplace the SPM_TOKEN and LOGSENE_TOKEN placeholders with your SPM and Logsene App tokensapiVersion: extensions/v1beta1kind: DaemonSetmetadata:  name: sematext-agentspec:  template:    metadata:      labels:        app: sematext-agent    spec:      selector: {}      dnsPolicy: “ClusterFirst”      restartPolicy: “Always”      containers:      – name: sematext-agent        image: sematext/sematext-agent-docker:latest        imagePullPolicy: “Always”        env:        – name: SPM_TOKEN          value: “REPLACE THIS WITH YOUR SPM TOKEN”        – name: LOGSENE_TOKEN          value: “REPLACE THIS WITH YOUR LOGSENE TOKEN”        – name: KUBERNETES          value: “1”        volumeMounts:          – mountPath: /var/run/docker.sock            name: docker-sock          – mountPath: /etc/localtime            name: localtime      volumes:        – name: docker-sock          hostPath:            path: /var/run/docker.sock        – name: localtime          hostPath:            path: /etc/localtimeRun Agent as DaemonSetActivate Sematext Agent Docker with kubectl:> kubectl create -f sematext-agent-daemonset.ymldaemonset “sematext-agent-daemonset” createdNow let’s check if the agent got deployed to all nodes:> kubectl get podsNAME                   READY     STATUS              RESTARTS   AGEsematext-agent-nh4ez   0/1       ContainerCreating   0          6ssematext-agent-s47vz   0/1       ImageNotReady       0          6sThe status “ImageNotReady” or “ContainerCreating” might be visible for a short time because Kubernetes must download the image for sematext/sematext-agent-docker first. The setting imagePullPolicy: “Always” specified in sematext-agent-daemonset.yml makes sure that Sematext Agent gets updated automatically using the image from Docker-Hub.If we check again we’ll see Sematext Docker Agent got deployed to (all) cluster nodes:> kubectl get pods -l sematext-agentNAME                   READY     STATUS    RESTARTS   AGEsematext-agent-nh4ez   1/1       Running   0          8ssematext-agent-s47vz   1/1       Running   0          8sLess than a minute after the deployment you should see your Kubernetes metrics and logs! Below are screenshots of various out of the box reports and explanations of various metrics’ meanings.Interpretation of Kubernetes MetricsThe metrics from all Kubernetes nodes are collected in a single SPM App, which aggregates metrics on several levels: Cluster – metrics aggregated over all nodes displayed in SPM overviewHost / node level – metrics aggregated per node Docker Image level – metrics aggregated by image name, e.g. all nginx webserver containersDocker Container level – metrics aggregated for a single containerHost and Container Metrics from the Kubernetes ClusterEach detailed chart has filter options for Node, Docker Image, and Docker Container. As Kubernetes uses the pod name in the name of the Docker Containers a search by pod name in the Docker Container filter makes it easy to select all containers for a specific pod. Let’s have a look at a few Kubernetes (and Docker) key metrics provided by SPM.Host Metrics such as CPU, Memory and Disk space usage. Docker images and containers consume more disk space than regular processes installed on a host. For example, an application image might include a Linux operating system and might have a size of 150-700 MB depending on the size of the base image and installed tools in the container. Data containers consume disk space on the host as well. In our experience watching the disk space and using cleanup tools is essential for continuous operations of Docker hosts. Container count – represents the number of running containers per hostContainer Counters per Kubernetes Node over timeContainer Memory and Memory Fail Counters. These metrics are important to watch and very important to tune applications. Memory limits should fit the footprint of the deployed pod (application) to avoid situations where Kubernetes uses default limits (e.g. defined for a namespace), which could lead to OOM kills of containers. Memory fail counters reflect the number of failed memory allocations in a container, and in case of OOM kills a Docker Event is triggered. This event is then displayed in SPM because Sematext Docker Agents collects all Docker Events. The best practice is to tune memory setting in a few iterations:Monitor memory usage of the application containerSet memory limits according to the observationsContinue monitoring of memory, memory fail counters, and Out-Of-Memory events. If OOM events happen, the container memory limits may need to be increased, or debugging is required to find the reason for the high memory consumptions. Container memory usage, limits and fail countersContainer CPU usage and throttled CPU time. The CPU usage can be limited by CPU shares – unlike memory, CPU usage it is not a hard limit. Containers might use more CPU as long the resource is available, but in situations where other containers need the CPU limits apply and the CPU gets throttled to the limit. There are more docker metrics to watch, like disk I/O throughput, network throughput and network errors for containers, but let’s continue by looking at Kubernetes Logs next. Understand Kubernetes LogsKubernetes containers’ logs are not much different from Docker container logs. However, Kubernetes users need to view logs for the deployed pods. That’s why it is very useful to have Kubernetes-specific information available for log search, such as:Kubernetes name spaceKubernetes pod nameKubernetes container nameDocker image nameKubernetes UIDSematext Docker Agent extracts this information from the Docker container names and tags all logs with the information mentioned above. Having these data extracted in individual fields makes it is very easy to watch logs of deployed pods, build reports from logs, quickly narrow down to problematic pods while troubleshooting, and so on! If Kubernetes core components (such as kubelet, proxy, api server) are deployed via Docker the Sematext Docker Agent will collect Kubernetes core components logs as well. All logs from Kubernetes containers in LogseneThere are many other useful features Logsene and Sematext Docker Agent give you out of the box, such as:Automatic format detection and parsing of logsSematext Docker Agent includes patterns to recognize and parse many log formatsCustom pattern definitions for specific images and application typesAutomatic Geo-IP enrichment for container logsFiltering logs e.g. to exclude noisy services Masking of sensitive data in specific log fields (phone numbers, payment information, authentication tokens)Alerts and scheduled reports based on logsAnalytics for structured logs e.g. in Kibana or GrafanaMost of those topics are described in our Docker Log Management post and are relevant for Kubernetes log management as well. If you want to learn more about Docker monitoring, read more on our blog.–Stefan Thies, Developer Evangelist, at SematextDownload KubernetesGet involved with the Kubernetes project on GitHub Post questions (or answer questions) on Stack Overflow Connect with the community on SlackFollow us on Twitter @Kubernetesio for latest updates
Quelle: kubernetes

Three Considerations for Planning your Docker Datacenter Deployment

Congratulations! You&;ve decided to make the change your application environment with Docker Datacenter. You&8217;re now on your way to greater agility, portability and control within your environment. But what do you need to get started? In this blog, we will cover things you need to consider (strategy, infrastructure, migration) to ensure a smooth POC and migration to production.
1. Strategy
Strategy involves doing a little work up-front to get everyone on the same page. This stage is critical to align expectations and set clear success criteria for exiting the project. The key focus areas are to determining your objective, plan out how to achieve it and know who should be involved.
Set the objective &; This is a critical step as it helps to set clear expectations, define a use case and outline the success criteria for exiting a POC. A common objective is to enable developer productivity by implementing a Continuous Integration environment with Docker Datacenter.
Plan how to achieve it &8211; With a clear use case and outcome identified, the next step is to look at what is required to complete this project. For a CI pipeline, Docker is able to standardize the development environment, provide isolation of the applications and their dependencies and eliminate any &;works on my machine&; issues to facilitate the CI automation. When outlining the plan, make sure to select the pilot application. The work involved will vary depending on whether it is a legacy application refactoring or new application development.
Integration between source control and CI allows Docker image builds to be automatically triggered from a standard Git workflow.  This will drive the automated building of Docker images. After Docker images are built they are shipped to the secure Docker registry to store them (Docker Trusted Registry) and role based access controls enable secure collaboration. Images can then be pulled and deployed across a secure cluster as running applications via the management layer of Docker Datacenter (Universal Control Plane).
Know who should be involved &8211; The solution will involve multiple teams and it is important to include the correct people early to avoid any potential barriers later on. These teams can include the following teams, depending on the initial project: development, middleware, security, architects, networking, database, and operations. Understand their requirements and address them early and gain consensus through collaboration.
PRO TIP &8211; Most first successes tend to be web applications with some sort of data tier that can either utilize traditional databases or be containerized with persistent data being stored in volumes.
 
2. Infrastructure
Now that you understand the basics of building a strategy for your deployment, it’s time to think about infrastructure.  In order to install Docker Datacenter (DDC) in a highly available (HA) deployment, the minimum base infrastructure is six nodes.  This will allow for the installation of three UCP managers and three DTR replicas on worker nodes in addition to the worker nodes where the workloads will be deployed. An HA set up is not required for an evaluation but we recommend a minimum of 3 replicas and managers for production deployments so your system can handle failures.
PRO TIP &8211; A best practice is to not deploy and run any container workloads on the UCP managers and DTR replicas. These nodes perform critical functions within DDC and are best if they only run the UCP or DTR services.
Nodes are defined as cloud, virtual or physical servers with Commercially Supported (CS) Docker Engine installed as a base configuration.
Each node should consist of a minimum of:

4GB of RAM
16GB storage space
For RHEL/CentOS with devicemapper: separate block device OR additional free space on the root volume group should be available for Docker storage.
Unrestricted network connectivity between nodes
OPTIONAL Internet access to Docker Hub to ease the initial downloads of the UCP/DTR and base content images
Installed with Docker supported operating system 
Sudo access credentials to each node

Other nodes may be required for related CI tooling. For a POC built around DDC in a HA deployment with CI/CD, ten nodes are recommended. For a POC built around DDC in a non-HA deployment with CI/CD, five nodes are recommended.
Below are specific requirements for the individual components of the DDC platform:
Universal Control Plane

Commercially Supported (CS) Docker Engine must be used in conjunction with DDC.
TCP Load balancer should be available for UCP in an HA configuration.
A valid DNS entry should be created for the load balancer VIP.
SSL certificate from a trusted root CA should be created (a self-signed certificate is created for UCP and may be used but additional configuration is required).
DDC License for 30 day trial or annual subscription must be obtained or purchased for the POC.

Docker Trusted Registry

Commercially Supported (CS) Docker Engine must be used in conjunction with DDC.
TCP Load balancer should be available for DTR in an HA configuration.
A valid DNS entry should be created for the load balancer VIP.
Image Storage options include a clustered filesystem for HA or blob storage (AWS S3, Azure, S3 compatible storage, or OpenStack Swift)
SSL certificate from a trusted root CA should be created (a self-signed certificate is created for DTR and may be used but additional configuration is required).
LDAP/AD is available for authentication; managed built-in authentication can also be used but requires additional configuration
DDC License for 30 day trial or annual subscription must be obtained or purchased for the POC.

The POC design phase is the ideal time to assess how Docker Datacenter will integrate into your existing IT infrastructure, from CI/CD, networking/load balancing, volumes for persistent data, configuration management, monitoring, and logging systems. During this phase, understand how  how the existing tools fit and discover any  gaps in your tooling. With the strategy and infrastructure prepared, begin the POC installation and testing. Installation docs can be found here.
 
3. Moving from POC Into Production
Once you have the built out your POC environment, how do you know if it’s ready for production use? Here are some suggested methods to handle the migration.

Perform the switchover from the non-Dockerized apps to Docker Datacenter in pre-production environments. Have Dev, Test, and Prod environments, switchover Dev and/or Test and run through a set burn in cycle to allow for the proper testing of the environment to look for any unexpected or missing functionality. Once non-production environments are stable, switch over to the production environment.

Start integrating Docker Datacenter alongside your existing application deployments. This method requires that the application can run with multiple instances running at the same time. For example, if your application is fronted by a load balancer, add the Dockerized application to the existing load balancer pool and begin sending traffic to the application running in Docker Datacenter. Should issues arise, remove the Dockerized application running  from the load balancer pool until issues can be resolved.

Completely cutover to a Dockerized environment all in one go. As additional applications begin to utilize Docker Datacenter, continue to use a tested pattern that works best for you to provide a standard path to production for your applications.

We hope these tips, learned from first hand experience with our customers help you in planning for your deployment. From standardizing your application environment and simultaneously adding more flexibility for your application teams, Docker Datacenter gives you a foundation to build, ship and run containerized applications anywhere.

3 Considerations for a successful deployment Click To Tweet

Enjoy your Docker Datacenter POC

Get started with your Docker Datacenter POC
See What’s New in Docker Datacenter
Learn more by visiting the Docker Datacenter webpage
Sign up for a free 30 day trial

The post Three Considerations for Planning your Docker Datacenter Deployment appeared first on Docker Blog.
Quelle: https://blog.docker.com/feed/

Visualize Kubelet Performance with Node Dashboard

In Kubernetes 1.4, we introduced a new node performance analysis tool, called the node performance dashboard, to visualize and explore the behavior of the Kubelet in much richer details. This new feature will make it easy to understand and improve code performance for Kubelet developers, and lets cluster maintainer to decide configurations according to provided Service Level Objectives (SLOs).BackgroundA Kubernetes cluster is made up of both master and worker nodes. The master node manages the cluster’s state, and the worker nodes do the actual work of running and managing pods. To do so, on each worker node, a binary, called Kubelet, watches for any changes in pod configuration, and takes corresponding actions to make sure that containers run successfully. High performance of the Kubelet, such as low latency to converge with new pod configuration and efficient housekeeping with low resource usage, is essential for the entire Kubernetes cluster. To measure this performance, Kubernetes uses end-to-end (e2e) tests to continuously monitor benchmark changes of latest builds with new features.Kubernetes SLOs are defined by the following benchmarks:     * API responsiveness: 99% of all API calls return in less than 1s.     * Pod startup time: 99% of pods and their containers (with pre-pulled images) start within 5s.Prior to 1.4 release, we’ve only measured and defined these at the cluster level, opening up the risk that other factors could influence the results. Beyond these, we also want to have more performance related SLOs such as the maximum number of pods for a specific machine type allowing maximum utilization of your cluster. In order to do the measurement correctly, we want to introduce a set of tests isolated to just a node’s performance. In addition, we aim to collect more fine-grained resource usage and operation tracing data of Kubelet from the new tests.Data CollectionThe node specific density and resource usage tests are now added into e2e-node test set since 1.4. The resource usage is measured by a standalone cAdvisor pod for flexible monitoring interval (comparing with Kubelet integrated cAdvisor). The performance data, such as latency and resource usage percentile, are recorded in persistent test result logs. The tests also record time series data such as creation time, running time of pods, as well as real-time resource usage. Tracing data of Kubelet operations are recorded in its log stored together with test results.Node Performance DashboardSince Kubernetes 1.4, we are continuously building the newest Kubelet code and running node performance tests. The data is collected by our new performance dashboard available at node-perf-dash.k8s.io. Figure 1 gives a preview of the dashboard. You can start to explore it by selecting a test, either using the drop-down list of short test names (region (a)) or by choosing test options one by one (region (b)). The test details show up in region (c) containing the full test name from Ginkgo (the Go test framework used by Kubernetes). Then select a node type (image and machine) in region (d).Figure 1. Select a test to display in node performance dashboard.The “BUILDS” page exhibits the performance data across different builds (Figure 2). The plots include pod startup latency, pod creation throughput, and CPU/memory usage of Kubelet and runtime (currently Docker). In this way it’s easy to monitor the performance change over time as new features are checked in.Figure 2. Performance data across different builds.Compare Different Node ConfigurationsIt’s always interesting to compare the performance between different configurations, such as comparing startup latency of different machine types, different numbers of pods, or comparing resource usage of hosting different number of pods. The dashboard provides a convenient way to do this. Just click the “Compare it” button the right up corner of test selection menu (region (e) in Figure 1). The selected tests will be added to a comparison list in the “COMPARISON” page, as shown in Figure 3. Data across a series of builds are aggregated to a single value to facilitate comparison and are displayed in bar charts.Figure 3. Compare different test configurations.Time Series and Tracing: Diving Into Performance DataPod startup latency is an important metric for Kubelet, especially when creating a large number of pods per node. Using the dashboard you can see the change of latency, for example, when creating 105 pods, as shown in Figure 4. When you see the highly variable lines, you might expect that the variance is due to different builds. However, as these test here were run against the same Kubernetes code, we can conclude the variance is due to performance fluctuation. The variance is close to 40s when we compare the 99% latency of build and , which is very large. To drill into the source of the fluctuation, let’s check out the “TIME SERIES” page.Figure 4. Pod startup latency when creating 105 pods.Looking specifically at build 162, we are able to see that the tracing data plotted in the pod creation latency chart (Figure 5). Each curve is an accumulated histogram of the number of pod operations which have already arrive at a certain tracing probe. The timestamp of tracing pod is either collected from the performance tests or by parsing the Kubelet log. Currently we collect the following tracing data:”create” (in test): the test creates pods through API client;”running” (in test): the test watches that pods are running from API server;”pod_config_change”: pod config change detected by Kubelet SyncLoop;”runtime_manager”: runtime manager starts to create containers;”infra_container_start”: the infra container of a pod starts;”container_start': the container of a pod starts;”pod_running”: a pod is running;”pod_status_running”: status manager updates status for a running pod;The time series chart illustrates that it is taking a long time for the status manager to update pod status (the data of “running” is not shown since it overlaps with “pod_status_running”). We figure out this latency is introduced due to the query per second (QPS) limits of Kubelet to the API server (default is 5). After being aware of this, we find in additional tests that by increasing QPS limits, curve “running” gradually converges with “pod_running’, and results in much lower latency. Therefore the previous e2e test pod startup results reflect the combined latency of both Kubelet and time of uploading status, the performance of Kubelet is thus under-estimated.Figure 5. Time series page using data from build 162.Further, by comparing the time series data of build 162 (Figure 5) and build 173 (Figure 6), we find that the performance pod startup latency fluctuation actually happens during updating pod statuses. Build 162 has several straggler “pod_status_running” events with a long latency tails. It thus provides useful ideas for future optimization. Figure 6. Pod startup latency of build 173.In future we plan to use events in Kubernetes which has a fixed log format to collect tracing data more conveniently. Instead of extracting existing log entries, then you can insert your own tracing probes inside Kubelet and obtain the break-down latency of each segment. You can check the latency between any two probes across different builds in the “TRACING” page, as shown in Figure 7. For example, by selecting “pod_config_change” as the start probe, and “pod_status_running’ as the end probe, it gives the latency variance of Kubelet over continuous builds without status updating overhead. With this feature, developers are able to monitor the performance change of a specific part of code inside Kubelet. Figure 7. Plotting latency between any two probes.Future WorkThe node performance dashboard is a brand new feature. It is still alpha version under active development. We will keep optimizing the data collecting and visualization, providing more tests, metrics and tools to the developers and the cluster maintainers. Please join our community and help us build the future of Kubernetes! If you’re particularly interested in nodes or performance testing, participate by chatting with us in our Slack channel or join our meeting which meets every Tuesday at 10 AM PT on this SIG-Node Hangout.–Zhou Fang, Software Engineering Intern, GoogleDownload KubernetesGet involved with the Kubernetes project on GitHub Post questions (or answer questions) on Stack Overflow Connect with the community on SlackFollow us on Twitter @Kubernetesio for latest updates
Quelle: kubernetes

Get to Know the Docker Datacenter Networking Updates

The latest release of Docker Datacenter (DDC) on Docker Engine 1.12 brings many new networking features that were designed with service discovery and high availability in mind. As organizations continue their journey towards modernizing legacy apps and microservices architectures, these new features were created to address modern day infrastructure demands. DDC builds on and extends the built-in orchestration capabilities including declarative services, scheduling, networking and security features of Engine 1.12. In addition to these new features, we published a new Reference Architecture to help guide you in designing and implementing this for your unique application requirements.

Among the new features in DDC are:

DNS for service discovery
Automatic internal service load balancing
Cluster-wide transport-layer (L4) load balancing
Cluster-wide application-layer (L7) load balancing using the new HTTP Routing Mesh (HRM) experimental feature

 
When creating a microservice architecture where services are often decoupled and communicated using APIs, there is an intrinsic need for many of these services to know how to communicate with each other. If a new service is created, how will it know where to find the other services it needs to communicate with? As a service needs to be scaled, what mechanism can be used for the additional containers to be added to a load balancer pool? DDC ships with the tools that tackle these challenges and enable engineers to deliver software at the pace of ever shifting business needs.
As services are created in DDC, the service name registers in a DNS resolver for each docker network. Each service will register in the Docker DNS resolver and can be reached from other applications on the same network by its service name. DNS works well for service discovery; it requires minimal configuration and can integrate with existing systems since the model has existed for decades.
It&;s also important for services to remain highly available after they discover each other. What good is a newly discovered service if you can&8217;t reach the API that developers labored over for weeks? I think we all know the answer to that, and it&8217;s a line in an Edwin Starr song (Hint: Absolutely nothing). There are a few new load balancing features introduced in DDC that are designed to always keep your services accessible. When services register in DNS, they are automatically assigned a Virtual IP (VIP). Internal requests pass through the VIP and then are load balanced. Docker handles the distribution of traffic among each healthy service task.
 
There are two new ways to load balance applications externally into a DDC managed cluster: the Swarm Mode Routing Mesh and the experimental HTTP Routing Mesh (HRM).

The Swarm Mode Routing Mesh works on the transport-layer (L4) where the admin assigns a port to a service (8080 in the example below) and when the external web traffic comes to the port on any host, the Routing Mesh will route the traffic onto any host that is running a container for that service. With Routing Mesh, the host that accepts the incoming traffic does not need to have the service running on it.
The HTTP Routing Mesh works on the application-layer (L7) where the admin assigns a label to the service that corresponds to the host address. The external load balancer routes the hostnames to the nodes and the Routing Mesh send the traffic across the nodes in the cluster to the correct containers for the service.

These offer multiple options to load balance and keep your application highly available

Finally, while it&8217;s important to keep your services highly available, it&8217;s also important for the management of your cluster to be highly available. We improved the API health checks for Docker Trusted Registry (DTR) so that a load balancer can easily be placed in front of all replicas in order to route traffic to healthy instances.  The new health check API endpoint is /health and you can set a HTTPS check from your load balancer to the new endpoint to ensure high availability of DTR.
 

There is a new Reference Architecture available with more detailed information on load balancing with Docker Datacenter and Engine 1.12.  Additionally because DDC is backwards compatible for applications built with previous versions of Docker Engine (1.11 and 1.10 using Docker Swarm 1.2), both the new Routing Mesh and Interlock based load balancing and service discovery are supported in parallel on the same DDC managed cluster. For your applications built with previous versions of Engine, a Reference Architecture for Load Balancing and Service Discovery with DDC + Docker Swarm 1.2 is also available.

New networking features plus Reference ArchitectureClick To Tweet

More Resources:

Read the latest RA: Docker UCP Service Discovery and Load Balancing
See What’s New in Docker Datacenter
Learn more by visiting the Docker Datacenter webpage
Sign up for a free 30 day trial

The post Get to Know the Docker Datacenter Networking Updates appeared first on Docker Blog.
Quelle: https://blog.docker.com/feed/
DockerCon Returns to Europe in 2017

DockerCon is making its return to Europe next year! DockerCon Europe will be held in the beautiful city of Copenhagen, Denmark at Bella Center Cope
nhagen from October 16 &; October 18, 2017. We plan on opening the week on Monday, October 16 with paid trainings and workshops, then General Session will kick off the conference the morning of Tuesday October 17 and the conference will continue through Wednesday October 18.
Three reasons why we are excited about DockerCon Europe in Copenhagen
 

On behalf of the entire Docker team, it’s safe to say that we cannot wait to reunite with the Docker Community in Europe under one roof again! Local Docker Meetup chapters take place every week to fuel the community enthusiasm, but there is something special about coming together for DockerCon and collaborating, learning and networking as a big group.

Recently remodeled in 2014/2015, the Bella Center Copenhagen is an ultra-modern event space featuring Scandinavian design throughout including open space with lots of indoor greenery. Bella Center Copenhagen is also one of the most sustainable venues in the world. They practice waste sorting in 16 categories, have an 850 kW wind turbine on-site for energy, as well as a living roof that is home to one million bees!

Another fun fact: Did you know that over one million people visit the mermaid statue in Copenhagen, inspired by Hans Christian Andersen’s The Little Mermaid fairytale? With all of the aquatic references throughout the city, we can’t wait to see what Moby scenes Docker illustrator Laurel will come up with!

Stay tuned in the upcoming months for both DockerCon US (April 17-20, 2017 in Austin, Texas) and DockerCon EU news including ticket sales and call for papers. In the meantime, catch up on all past DockerCon action and be sure to save the dates!
 

The post DockerCon Returns to Europe in 2017 appeared first on Docker Blog.
Quelle: https://blog.docker.com/feed/

Exciting news from CheConf

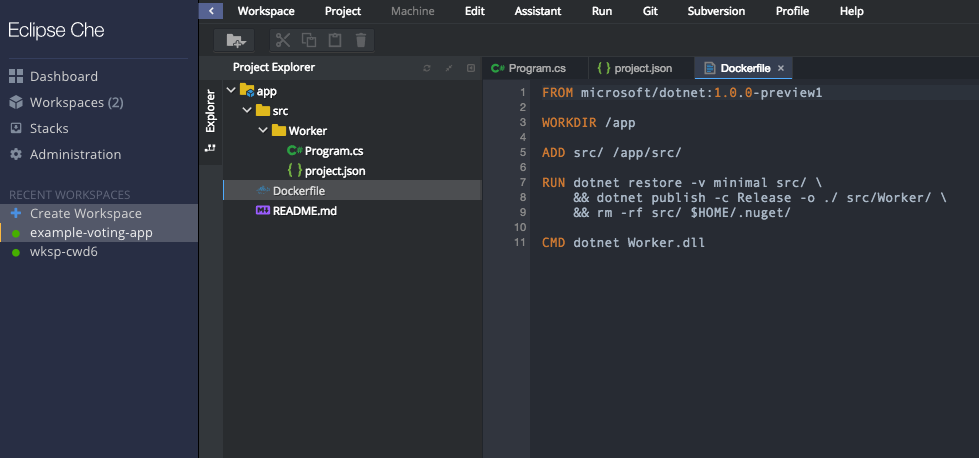
Eclipse Che is a developer workspace server and cloud IDE. With Che, you can define a workspace with the project code files and all of their dependencies necessary to edit, build, run, and debug them. You can share your workspaces with other team members. And Che drives Codenvy, cloud workspaces for development teams, with access control and other features.
 
Today in the keynote at CheConf 2016, Tyler Jewell made several related announcements.

Che runs on your machine as a Docker container, and generates other containers for workspaces making it a fully Dockerized IDE.
Docker now powers the Che CLI, including most Che utilities like IP lookup, curl, compiling Che, versioning, launching.
Che has added support for Docker Compose files in workspaces, making it really easy to write and debug Compose-based applications, right in Che.
Che agents, such as SSH or language servers for intellisense, are deployed as containers.
Chedir is a command line utility for converting source repos into Dockerized workspaces.
Che is now available in the Docker Store.
Codenvy is packaged as a set of Docker containers. With docker-compose up you start up ten docker containers that run Codenvy on your network.
Codenvy also uses Docker Swarm as the clustering and workspace distribution technology. Before the end of the year, Che and Codenvy will have an identical CLI &; so anywhere Docker exists, you can run Che or a clustered Codenvy deployment with the same syntax.

This is all pretty exciting. We’ve been happy to work with Codenvy on this project. After the keynote at CheConf, Docker’s own Patrick Chanezon led a session: Docker 101 & Why Docker Powers Che and here are the slides.

Docker 101 Checonf 2016 from Patrick Chanezon

More importantly, we wanted to get to work directly on Che, which is the fastest moving project under the Eclipse umbrella. So we’re happy to announce that Docker is joining the Eclipse Project! We look forward to working more with Eclipse and Codenvy going forward.
So check out the Che documentation, and Che in the Docker Store. And check out our other developer tools labs in the Docker Labs repo on GitHub. We’ll be adding in some Che content going forward.

Exciting news from : Docker Compose powers @eclipse_che Click To Tweet

The post Exciting news from CheConf appeared first on Docker Blog.
Quelle: https://blog.docker.com/feed/
Introducing Image Signing Policy in Docker Datacenter

My colleague colleague Ying Li and I recently blogged about Securing the Software Supply Chain and drew the analogy between traditional physical supply chains and the creation, building, and deployment involved in a software supply chain. We believe that a software pipeline that can be verified at every stage is an important step in raising the security bar for all software, and we didn’t stop at simply presenting the idea.

Integrated Content Trust and Image Signing Policy
In the recent release of Docker Datacenter,  we announced a new feature that starts to brings these security capabilities together along the software supply chain. Built on Notary, a signing infrastructure based on The Update Framework (TUF), along with Docker Content Trust (DCT), an integration of the Notary toolchain into the Docker client, DDC now allows administrators to set up signing policies that prevent untrusted content from being deployed.
In this release of DDC, the Docker Trusted Registry (DTR) now also ships with integrated Notary services. This means you’re ready to start using DCT and the new Signing Policy features out of the box! No separate server and database to install, configure and connect to the registry.

Bringing it all together
Image signing is important for image creators to provide a proof of origin and verification through a digital signature of that image. Because an image is built in layers and passes through many different stages and is touched by different systems and teams, the ability to tie this together with a central policy ensures a greater level of application security.
In the web UI under settings, the admin can enable Content Trust to enforce that only signed images can be deployed to the DDC managed cluster. As part of that configuration, the admin can also select which signatures are required in order for that image to be deployed.

The configuration screen prompts the admin to select any number of teams from which a signature is required. A team in DDC can be defined as automated systems (Build / CI) or people in your organization.
The diagram below shows a sample workflow where the Content Trust Settings are required to check for CI and QA.

Stage 1: Developer checks in code and kicks of an integration test. Code passes CI and automatically triggers a new image build, signature and push to Docker Trusted Registry (DTR).
Stage 2: QA team pulls image from DTR, performs additional testing and once completed (and passes), signs and pushes the image to DTR
Stage 3: Release engineering goes to deploy the image to the production cluster. Since the Content Trust setting requires a signature from both CI and QA, DDC will check the image for both signatures and since they exist (in our example) will deploy the container.

We are excited to introduce this feature to our enterprise users to increase the security of their software supply chain and add a level of automated enforcement of policies that can be set up centrally.  As applications scale and teams grow, these features help provide assurances with proof of content origin, safe transport and that the approval gates have been met before deploying to production.
Download the free 30 day evaluation of Docker Datacenter to get started today.

offers enhanced security w/layered image signing & policy enforcementClick To Tweet

Learn More

Save your seat: Demo webinar &; Tomorrow Wed Nov. 16th
Learn more by visiting the Docker Datacenter webpage
See What’s New in Docker Datacenter
Read the blog about the Secure Software Supply Chain
Sign up for a free 30 day trial license

The post Introducing Image Signing Policy in Docker Datacenter appeared first on Docker Blog.
Quelle: https://blog.docker.com/feed/






