NVIDIA Tesla T4 GPUs now available in beta

In November, we announced that Google Cloud Platform (GCP) was the first and only major cloud vendor to offer NVIDIA’s newest data center GPU, the Tesla T4, via a private alpha. Today, these T4 GPU instances are now available publicly in beta in Brazil, India, Netherlands, Singapore, Tokyo, and the United States. For Brazil, India, Japan, and Singapore, these are the first GPUs we have offered in those GCP regions.The T4 GPU is well suited for many machine learning, visualization and other GPU accelerated workloads. Each T4 comes with 16GB of GPU memory, offers the widest precision support (FP32, FP16, INT8 and INT4), includes NVIDIA Tensor Core and RTX real-time visualization technology and performs up to 260 TOPS1 of compute performance. Customers can create custom VM shapes that best meet their needs with up to four T4 GPUs, 96 vCPUs, 624GB of host memory and optionally up to 3TB of in-server local SSD. Our T4 GPU prices are as low as $0.29 per hour per GPU on Preemptible VM instances. On-demand instances start at $0.95 per hour per GPU, with up to a 30% discount with sustained use discounts. Committed use discounts are also available as well for the greatest savings for on-demand T4 GPU usage—talk with sales to learn more.Broadest GPU availabilityWe’ve distributed our T4 GPUs across the globe in eight regions, allowing you to provide low latency solutions to your customers no matter where they are. The T4 joins our NVIDIA K80, P4, P100 and V100 GPU offerings, providing customers with a wide selection of hardware-accelerated compute options. T4 GPUs are now available in the following regions: us-central1, us-west1, us-east1, asia-northeast1, asia-south1, asia-southeast1, europe-west4,  and southamerica-east1.Machine learning inferenceThe T4 is the best GPU in our product portfolio for running inference workloads. Its high performance characteristics for FP16, INT8 and INT4 allow you to run high scale inference with flexible accuracy/performance tradeoffs that are not available on any other GPU. The T4’s 16GB of memory supports large ML models or running inference on multiple smaller models simultaneously. ML inference performance on Google Compute Engine’s T4s has been measured at up to 4267 images/sec2 with latency as low as 1.1ms3. Running production workloads on T4 GPUs on Compute Engine is a great solution thanks to the T4’s price, performance, global availability across eight regions and high-speed Google network. To help you get started with ML inference on the T4 GPU, we also have a technical tutorial demonstrating how to deploy a multi-zone, auto-scaling ML inference service on top of Compute Engine VMs and T4 GPUs.Machine learning trainingThe V100 GPU has become the primary GPU for ML training workloads in the cloud thanks to its high performance, Tensor Core technology and 16GB of GPU memory to support larger ML models. The T4 supports all of this at a lower price point,  making it a great choice for scale-out distributed training or when a V100 GPU’s power is overkill. Our customers tell us they like the near-linear scaling of many training workloads on our T4 GPUs as they speed up their training results with large numbers of T4 GPUs.ML cost savings options only on Compute EngineOur T4 GPUs complement our V100 GPU offering nicely. You can scale up with large VMs up to eight V100 GPUs, scale down with lower cost T4 GPUs or scale out with either T4 or V100 GPUs based on your workload characteristics. With Google Cloud as the only major cloud provider to offer T4 GPUs, our broad product portfolio lets you save money or do more with the same resources.* Prices listed are current Compute Engine on-demand pricing for certain regions.Prices may vary by region and lower prices are available through SUDs and Preemptible GPUsStrong visualization with RTXThe NVIDIA T4 with its Turing architecture is the first data center GPU to include dedicated ray-tracing processors. Called RT Cores, they accelerate the computation of how light travels in 3D environments. Turing accelerates real-time ray tracing over the previous-generation NVIDIA Pascal architecture and can render final frames for film effects faster than CPUs, providing hardware-accelerated ray tracing capabilities via NVIDIA’s OptiX ray-tracing API. In addition, we are glad to also offer virtual workstations running on T4 GPUs that give creative and technical professionals the power of the next generation of computer graphics with the flexibility to work from anywhere and on any device.Getting startedWe make it easy to get started with T4 GPUs for ML, compute and visualization. Check out our GPU product page to learn more about the T4 and our other GPU offerings. For those looking to get up and running quickly with GPUs and Compute Engine, our Deep Learning VMimage comes with NVIDIA drivers and various ML libraries pre-installed. Not a Google Cloud customer? Sign up today and take advantage of our $300 free tier.1. 260 TOPs INT4 performance, 130 TOPs INT8, 65 TFLOPS FP16, 8.1 TFLOPS FP322. INT8 precision, resnet50, batch size 1283. INT8 precision, resnet50, batch size 1
Quelle: Google Cloud Platform

Running TensorFlow inference workloads at scale with TensorRT 5 and NVIDIA T4 GPUs

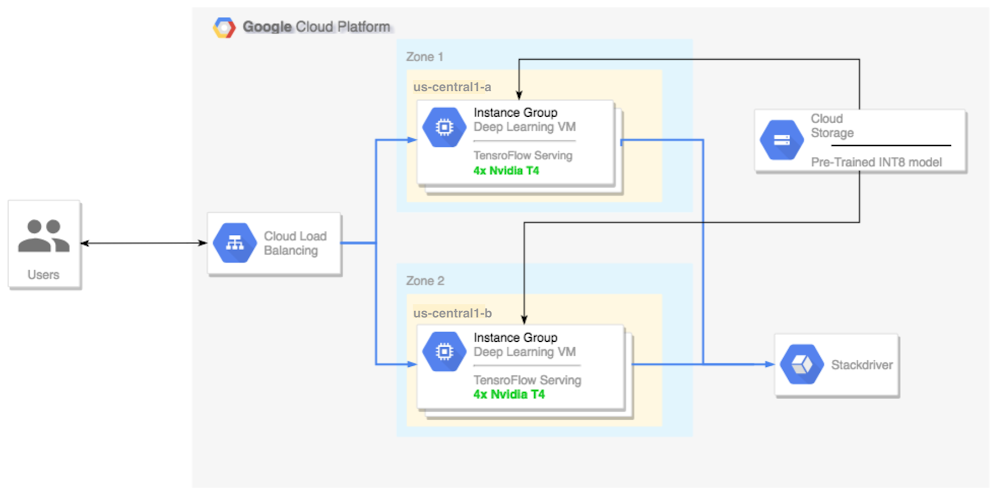
Today, we announced that Google Compute Engine now offers machine types with NVIDIA T4 GPUs, to accelerate a variety of cloud workloads, including high-performance computing, deep learning training and inference, broader machine learning (ML) workloads, data analytics, and graphics rendering.In addition to its GPU hardware, NVIDIA also offers tools to help developers make the best use of their infrastructure. NVIDIA TensorRT is a cross-platform library for developing high-performance deep learning inference—the stage in the machine learning process where a trained model is used, typically in a runtime, live environment, to recognize, process, and classify results. The library includes a deep learning inference data type (quantization) optimizer, model conversion process, and runtime that delivers low latency and high throughput. TensorRT-based applications perform up to 40 times faster1 than CPU-only platforms during inference. With TensorRT, you can optimize neural network models trained in most major frameworks, calibrate for lower precision with high accuracy, and finally, deploy to a variety of environments. These might include hyperscale data centers, embedded systems, or automotive product platforms.In this blog post, we’ll show you how to run deep learning inference on large-scale workloads with NVIDIA TensorRT 5 running on Compute Engine VMs configured with our Cloud Deep Learning VM image and NVIDIA T4 GPUs.OverviewThis tutorial shows you how to set up a multi-zone cluster for running an inference workload on an autoscaling group that scales to meet changing GPU utilization demands, and covers the following steps:Preparing a model using a pre-trained graph (ResNet)Benchmarking the inference speed for a model with different optimization modesConverting a custom model to TensorRT formatSetting up a multi-zone cluster that is:Built on Deep Learning VMs preinstalled with TensorFlow, TensorFlow serving, and TensorRT 5.Configured to auto-scale based on GPU utilization.Configured for load-balancing.Firewall enabled.  Running an inference workload in the multi-zone cluster.Here’s a high-level architectural perspective for this setup:Preparing and optimizing the model with TensorRTIn this section, we will create a VM instance to run the model, and then download a model from the TensorFlow official models catalog.Create a new Deep Learning Virtual Machine instanceCreate the VM instance:If command is successful you should see a message that looks like this:Notes:You can create this instance in any available zone that supports T4 GPUs.A single GPU is enough to compare the different TensorRT optimization modes.Download a ResNet model pre-trained graphThis tutorial uses the ResNet model, which trained on the ImageNet dataset that is in TensorFlow. To download the ResNet model to your VM instance, run the following command:Verify model was downloaded correctly:Save the location of your ResNet model in the $WORKDIR variable:Benchmarking the modelLeveraging fast linear algebra libraries and hand tuned kernels, TensorRT can speed up inference workloads, but the most significant speed-up comes from the quantization process. Model quantization is the process by which you reduce the precision of weights for a model. For example, if the initial weight of a model is FP32, you have the option to reduce the precision to FP16, INT8, or even INT4, with the goal of improving runtime performance. It’s important to pick the right balance between speed (precision of weights) and accuracy of a model. Luckily, TensorFlow includes functionality that does exactly this, measuring accuracy vs. speed, or other metrics such as throughput, latency, node conversion rates, and total training time.Note: This test is limited to image recognition models at the moment, however it should not be too hard to implement a custom test based on this code.Set up the ResNet modelTo set up the model, run the following command:This test requires a frozen graph from the ResNet model (the same one that we downloaded before), as well as arguments for the different quantization modes that we want to test.The following command prepares the test for the execution:Run the testThis command will take some time to finish.Notes:$WORKDIR is the directory in which you downloaded the ResNet model.The –native arguments are the different available quantization modes you can test.Review the resultsWhen the test completes, you will see a comparison of the inference results for each optimization mode.To see the full results, run the following command:V100 (Old)V100T4P4From the above results, you can see that FP32 and FP16 performance numbers are identical under predictions. This means that if you are content working with TensorRT, you can definitely start using FP16 right away. INT8, on the other hand, shows slightly worse accuracy and requires understanding the accuracy-versus-performance tradeoffs for your models.In addition, you can observe that when you run the model with TensorRT 5:Using FP32 optimization improves throughput by 40% (440 vs 314). At the same time it decreases latency by ~30%, making it 0.28 ms instead of 0.40 ms.Using FP16 optimization rather than native TF graph increases the speed by 214%! (from 314 to 988 fps). At the same time latency decreased by 0.12 ms (almost 3x decrease!).Using INT8, the last result displayed above, we observed a speedup of 385% (from 314 to 1524) with the latency decreasing to 0.08 ms.Notes:The above results do not include latency for image pre-processing nor HTTP requests latency. In production systems the inference’ speed may not be a bottleneck at all, and you will need to account for all the factors mentioned in order to measure your end to end inference’ speed.Now, let’s pick a model, in this case, INT8.Converting a custom model to TensorRTDownload and extract ResNet modelTo convert a custom model to a TensorRT graph you will need a saved model. To download a saved INT8 ResNet model, run the following command:Convert the model to a TensorRT graph with TFToolsNow we can convert this model to its corresponding TensorRT graph with a simple tool:You now have an INT8 model in your $WORKDIR/resnet_v2_int8_NCHW/00001 directory.To ensure that everything is set up properly, try running an inference test.Upload the model to Cloud StorageYou’ll need to run this step so that the model can be served from the multi-zone cluster that we will set up in the next section. To upload the model, complete the following steps:1. Archive the model.2. Upload the archive.If needed, you can obtain an INT8 precision variant of the frozen graph from Cloud Storage at this URL:Setting up a multi-zone clusterCreate the clusterNow that we have a model in Cloud Storage, let’s create a cluster.Create an instance templateAn instance template is a useful way to create new instances. Here’s how:Notes:This instance template includes a startup script that is specified by the metadata parameter.The startup script runs during instance creation on every instance that uses this template, and performs the following steps:Installs NVIDIA drivers, NVIDIA drivers are installed on each new instance. Without NVIDIA drivers, inference will not work.Installs a monitoring agent that monitors GPU usage on the instanceDownloads the modelStarts the inference serviceThe startup script runs tf_serve.py, which contains the inference logic. For this example, I have created a very small Python file based on the TFServe package.To view the startup script, see start_agent_and_inf_server.sh.Create a managed instance groupYou’ll need to set up a managed instance group, to allow you to run multiple instances in specific zones. The instances are created based on the instance template generated in the previous step.Notes:INSTANCE_TEMPLATE_NAME is the name of the instance that you created in the previous step.You can create this instance in any available zone that supports T4 GPUs. Ensure that you have available GPU quotas in the zone.Creating the instance takes some time. You can watch the progress with the following command:Once the managed instance group is created, you should see output that resembles the following:Confirm metrics in Stackdriver1. Access Stackdriver’s Metrics Explorer here2. Search for gpu_utilization. StackDriver > Resources > Metrics Explorer3. If data is coming in, you should see something like this:Enable auto-scalingNow, you’ll need to enable auto-scaling for your managed instance group.Notes:The custom.googleapis.com/gpu_utilization is the full path to our metric.We are using level 85, this means that whenever GPU utilization reaches 85, the platform will create a new instance in our group.Test auto-scalingTo test auto-scaling, perform the following steps:1. SSH to the instances. See Connecting to Instances for more details.2. Use the gpu-burn tool to load your GPU to 100% utilization for 600 seconds:Notes:During the make process, you may receive some warnings, ignore them.You can monitor the gpu usage information, with a refresh interval of 5 seconds:3. You can observe the autoscaling in Stackdriver, one instance at a time.4. Go to the Instance Groups page in the Google Cloud Console.5. Click on the deeplearning-instance-group managed instance group.6. Click on the Monitoring tab.At this point your auto-scaling logic should be trying to spin as many instances as possible to reduce the load. And that is exactly what is happening:At this point you can safely stop any loaded instances (due to the burn-in tool) and watch the cluster scale down.Set up a load balancerLet’s revisit what we have so far:A trained model, optimized with TensorRT 5 (using INT8 quantization)A managed instance group. These instances have auto-scaling enable based on the GPU utilizationNow you can create a load balancer in front of the instances.Create health checksHealth checks are used to determine if a particular host on our backend can serve the traffic.Create inferences forwarderConfigure named-ports of the instance group so that LB can forward inference requests, sent via port 80, to the inference service that is served via port 8888.Create a backend serviceCreate a backend service that has an instance group and health check.First, create the health check:Then, add the instance group to the new backend service:Set up the forwarding URLThe load balancer needs to know which URL can be forwarded to the backend services.Create the load balancerAdd an external IP address to the load balancer:Find the allocated IP address:Set up the forwarding rule that tells GCP to forward all requests from the public IP to the load balancer:After creating the global forwarding rules, it can take several minutes for your configuration to propagate.Enable the firewallYou need to enable a firewall on your project, or else it will be impossible to connect to your VM instances from the external internet. To enable a firewall for your instances, run the following command:Running inferenceYou can use the following Python script to convert images to a format that can be uploaded to the server.Finally, run the inference request:That’s it!Toward TensorFlow inference blissRunning ML inference workloads with TensorFlow has come a long way. Together, the combination of NVIDIA T4 GPUs and its TensorRT framework make running inference workloads a relatively trivial task—and with T4 GPUs available on Google Cloud, you can spin them up and down on demand. If you have feedback on this post, please reach out to us here.Acknowledgements: Viacheslav Kovalevskyi, Software Engineer, Gonzalo Gasca Meza, Developer Programs Engineer, Yaboo Oyabu, Machine Learning Specialist and Karthik Ramasamy, Software Engineer contributed to this post.1. Inference benchmarks show ResNet training times to be 27x faster, and GNMT times to be 36x faster
Quelle: Google Cloud Platform

Check up on your remote fleet: Cloud IoT now makes Device Activity Logging generally available

Embedded systems engineers who develop IoT systems often face a number of challenges. Getting devices connected to the internet for the first time and every time is a tall order in today’s fragmented IoT market. Even the process of determining whether or not a particular device is working properly can be a challenge. Device Activity Logging (or just Logging, for short) allows customers to receive device activity logs from Cloud IoT Core, right in Stackdriver. Cloud IoT Core produces two types of logs: audit logs and now device logs as well. Both are available for viewing in Stackdriver.A view of the device activity logs available in IoT Core, using Stackdriver tools to sort and filter the logs. LoggingDuring development it can be frustrating to understand why a device isn’t connecting as it was designed to, or otherwise behaving as intended. Furthermore, debugging a deployed device or group of devices in a fleet of thousands can be near impossible without the correct instrumentation. Detailed activity logs are usually the only way to understand the lifecycle a specific device has encountered, and many IoT platforms make this information difficult to access.With Cloud IoT Core, you can now enable device logging for a single device or for an entire fleet. Device Activity Logging allows users to select different log levels, depending on the verbosity of logs they are interested in. Users can choose to see just errors, full connection history, or even a log of every time a device sends a message (note: message content is not logged, only the actual event). Device Activity Logs are written to Stackdriver, which means that they are available alongside all the rest of your GCP (and IoT) audit logs. This makes debugging errors or solving connectivity problems  a snap.An example of what a monitoring dashboard for a small number of devices might look like.MonitoringLogs are great for diagnosing problems with devices, but sometimes it’s necessary to understand the health of your entire fleet of devices, with just a quick glance. You can get a good idea of what’s going on within your business just by seeing how many devices are connected and how often they communicate. To meet this need, many businesses will build custom dashboards, or at least employ a simple visualization tool.The new monitoring tab in IoT Core can help you get a complete picture of your fleet with no additional setup. IoT Core automatically reports this data to Stackdriver Metrics where they can then be queried to create custom dashboards, if you wish. However, we have already created a standard dashboard of the most useful metrics, right in IoT Core.Simply click on the “Monitoring” tab to see information about how many devices are connected, how many messages they are sending, and how much data they are using. If you need more granular information, you can easily follow the link to Stackdriver Metrics.ConclusionTo find out more about which events are logged under each logging level, take a look at the documentation. Logging and Monitoring are now generally available, so try enabling it for some of your devices today. If you’d prefer to explore the functionality of Cloud IoT Core in an interactive, educational format, try our Cloud IoT Qwiklab, which includes logging examples.
Quelle: Google Cloud Platform

Building Google's Game of the Year with Cloud Text-to-Speech and App Engine

At the end of every year, we take a look at Google Search trends, culminating in our annual Year in Search film. This year, we decided to also build Game of the Year, the first quiz game based on Google Search trends. We thought it would be fun to bring the trends to life, and we wanted to experiment a bit with our own technology. You can see here what the game is all about:To build the game, we used Google Cloud technologies and WaveNet, which is a deep neural network that generates raw audio waveforms. Here’s how we did it.Bringing the game to life with Cloud Text-to-Speech, WaveNet and SSMLMonths before we built anything for production, our designers, writers, and developers here on the Brand Studio team worked on varying game ideas and prototypes centered around the year’s Search trends data. A key feature of these early prototypes was Cloud Text-to-Speech. From the beginning, we wanted to take advantage of its ability to personalize any statement with a user’s name on the fly using a natural-sounding voice. This feature lets us develop our “host,” a delightful feature and core part of the game.From a practical perspective, using Cloud Text-to-Speech also significantly reduced production overhead. We could change copy easily without needing a voice actor to re-record every time we added or changed a question or answer. It also allows us to easily scale if we decide to add new questions to the game or translate it to other languages.As part of our early prototypes, we also played with several WaveNet voices. Its ability to sound out everything from awkward brand names to difficult-to-pronounce celebrity names was uncanny—and especially important given that some of 2018’s Search trends aren’t exactly standard words you find in the dictionary. We also explored Speech Synthesis Markup Language (SSML), which lets you tailor WaveNet’s speech by modifying inflection, emphasis, timing, and other very granular speech parameters. We used SSML mostly in our initial demos to make even more natural-sounding speech. Because our final product underwent frequent content updates, we couldn’t take advantage of SSML as much as we would have liked by launch time. Fortunately, we found the default speech synthesis to be pretty impressive as is. We were pleasantly surprised when the WaveNet model pronounced certain strings like “Givenchy” (jzhiv-on-shee) as intended. Other interpretations did not quite work as we had hoped (see: Go…o.o.o.o.o.o.o.o.o.o…al), but were humorous enough to keep in the final build.Finding the right audio balanceOur initial prototypes showcased all of the possible accents, languages, and genders available in Cloud Text-to-Speech. In some iterations we used the voice primarily as a source of comic relief in between questions, such as by ribbing the player for getting a wrong answer, or incorporating terrible puns after some questions. While fun to listen to, we realized we needed to strike the right balance between humorous audio commentary and unobtrusive gameplay. In the end, it felt more natural to have the host read the questions and answer selections like an actual game show host would, and to develop the host’s “character” via clever writing. Limiting the host to speaking only the written questions and facts also meant that those not using the audio experience wouldn’t miss any of the fun dialogue or receive a lesser game experience.The amount of dialogue was also important in calculating the necessary API quota. Exceeding the quota causes the host to remain silent on subsequent play-throughs of the game that day, as the API returns an appropriate “quota exceeded” error. We worked with the Cloud Text-to-Speech team to estimate queries per minute and characters per minute based on expected traffic and the length and frequency of each spoken phrase. In order to avoid issues in the event that the game did exceed our quota, we wrote in a simple check to disable the host’s voice and talking animation if any client or server errors were returned by the API. This allows the game to continue seamlessly for users with the music and sound effects only.Though we ended up narrowing down the host’s voice to only two options (one male and one female), which are randomized at the start, users can customize those voices in-game by changing the speed and pitch on the intro page, as shown below. We decided to limit those ranges to avoid unintended audio-timing bugs that appeared with extreme changes to the voice speed—for example, the host talking too slowly to finish speaking before the next line of dialogue begins. We hope that users find this balance of audio features as delightful as we do!Building the game at scaleWe built the game on App Engine to take advantage of Google Cloud’s ability to quickly scale based on traffic, its developer-friendly environment, access management, easy deployment and versioning, and API management tools. The game is a single-page Angular app, which is statically served and front-end-cached to reduce latency, and integrates the Cloud Text-to-Speech API, Matter.js for physics, Hammer.js for touch gestures, and Tween.js for animation. To easily scale and maintain the content, we used an internally built content management system to store and edit the questions, answers, fun facts and images used throughout the game.The Cloud Text-to-Speech API integrated seamlessly into the game’s build, creating a smooth, natural audio experience across all supported platforms. Knowing how easily we can include this technology in our applications opens a lot of doors to enhance future projects in delightfully unexpected ways. We’re equally excited to see what other developers come up with using this awesome piece of technology.Give Game of the Year a shot and find out how well you know the trends of 2018.
Quelle: Google Cloud Platform

New BigQuery UI features help you work faster

Since announcing our new interface back in July, our goal has been to make it easier for BigQuery users and their teams to uncover insights and share them with teammates and colleagues. Whether you’re a veteran or brand new to BigQuery, we wanted to highlight some of the major improvements we’ve made to the interface in the past five months. Some of this functionality was previously available in the classic UI, while other elements are totally new. Let’s take a closer look.Collaboration featuresRecently we’ve released several features designed to enable analysts to easily collaborate. One of the most important additions is the ability to share queries. When you’re viewing one of your saved queries, just click the Link Sharing button above the editor and turn on link sharing to let others see your query. They’ll see any updates you make to the query too, so there’s no need to paste new versions into email.You can now also add metadata to your BigQuery resources. You can add and edit descriptions for your datasets or tables, making it easier for you and your team members to understand them. You can also create custom labels that can consist of any keys and values you choose, which can serve your team as keywords to search your datasets and tables. Click the pencil icons on the Details pages for a dataset or table to edit the metadata.You can now edit individual column descriptions through the UI: in the Schema view for a table, click the Edit Schema button to edit descriptions for existing fields or add new ones.Public datasetsThe Google Cloud Public Dataset Program gives you access to more than 100 valuable sources of data—from census data to Bitcoin transactions to human genomes—all at BigQuery’s standard analysis pricing. Now you can include these datasets in your BigQuery queries to find your own insights or join them with your own data. Just choose the Add Data option in the Resources section and select Explore public datasets to visit the marketplace.Browse the marketplace for the dataset that you want, then select View Dataset to see and query it in BigQuery.Sorting and filtering queriesYou’ve told us that it can be hard to find a specific query of interest in a lengthy query history. As such, sorting and filtering your personal and project query history have been highly-requested features. Now you can do both. Sort by the query’s date, duration, duration/MB, input bytes, slot time, or slot time/MB. Filter by the query text, bytes processed, job ID, job status, user email, and the start and end time. You can also combine filtering conditions logically to create more complex searches.And beyondThe features above are just a few of the items we’ve been working on. We’ve also made lots of updates to improve performance, security, and reliability. For example, when you have many columns in your table, the results view and table previews now load 5-10 times faster when you first view them. For easy creation of secure tables, you can now also use the UI to create tables with your own managed encryption keys (learn more in our CMEK documentation). You’ll also notice a variety of small visual improvements like better text-wrapping and getting-started messages for anyone who hasn’t run queries or added datasets yet. And of course we’ve fixed many bugs—thank you for helping us by reporting them!  We hope you find the interface for BigQuery useful. We’re hard at work on new features and we look forward to sharing more soon. In the meantime, please keep sending us your feedback by selecting the Send Feedback option at the top right of the Google Console while you’re using BigQuery.
Quelle: Google Cloud Platform

How retailers like Ulta and DSW are improving customer experiences using Google Cloud

The increasing adoption of technologies like connected devices, augmented reality, and machine learning has changed the way we shop, and retailers are evolving how they do business to meet the needs of their customers.When I talk to retailers, they tell me it’s no longer enough to keep pace with shoppers’ growing expectations—they must get ahead of them. That’s why more and more are turning to the cloud. They’re using it to eliminate data silos and take advantage of cloud-based analytics. They’re tapping into machine learning to improve all aspects of the value chain. And they’re making use of reliable and secure cloud infrastructure to scale their businesses.Although every retail customer is different, we’ve found many of them share similar objectives. Here are three major ways we’re seeing retailers take advantage of the cloud.Storing and analyzing data in the cloudData presents both a challenge and an opportunity for retailers. Which is why Ulta Beauty, the largest beauty retailer in the U.S, is moving to Google Cloud Platform (GCP). Now, with the help of BigQuery, Ulta Beauty will be able to more efficiently predict and analyze outcomes and develop more meaningful data insights that can be leveraged to deliver a more personalized, relevant guest journey.They are not alone. This week, DSW is also sharing why they chose GCP to help relaunch their DSW VIP loyalty program for the first time in over 10 years. With more than 90% of transactions running through their loyalty program, DSW needed a flexible and scalable solution to deliver a real-time loyalty program for their 26 million active members. They’ve already seen a 9% uptick in new customers and have improved their already strong retention rate.Improving customer experiences with AI and machine learningOnce retailers are able to access these insights, they are turning to AI to help personalize the overall shopping experience. At first, we primarily saw retail companies leveraging AI tools such as machine learning for product recommendations. Now, we are seeing our customers use AI to forecast trends, predict inventory needs and can help prevent stock outs, and provide personalized recommendations to their customers to intelligently and efficiently serve them.Just look at METRO AG, one of the largest B2B wholesalers globally. They’re using AI and machine learning to better serve their customers. For example, many of their customers are restaurant owners. With Google Cloud AI capabilities, they can create tools that identify when a restaurant is out of a particular ingredient and automatically order more. Ocado is another great example. The world’s largest online-only grocery retailer drove a7% increase in contact center efficiencyby using Google Cloud machine learning technology to respond to customer emails four times faster.To help businesses further accelerate their AI solutions, we have developed our Advanced Solutions Lab (ASL), which gives businesses the opportunity to work side-by-side with Google’s AI and ML experts to solve high impact challenges. Fast Retailing, the Japanese retailer behind Uniqlo, is working with Google Cloud and ASL to help them better analyze customer datato forecast demand and deeply understand what their customers want. Carrefour, one of the world’s leading retailers, also announced last year that their engineers will be working side-by-side with our AI experts toco-create new consumer experiences. This is in addition to deploying G Suite to their employees to support the company’s digital transformation.Scaling their infrastructure to meet demandOf course, none of this innovation is possible without a reliable infrastructure that can scale instantly to meet surges in traffic. And many have found the reliability and security they need with the cloud. That’s why global cosmetics brand Lush chose Google Cloud. They migrated their e-commerce platform to GCP to handle increased traffic without compromising stability. This move that ultimately reduced infrastructure hosting costs by 40 percent. L.L.Bean alsomodernized its IT infrastructure by moving capabilities from its on-premises systems to GCP, improving customer satisfaction and IT efficiency across multiple sales channels. We talk more about this topic in a recent announcement highlighting how Google Cloud worked closely with customers like Shopify to help them meet customer demand on Black Friday and Cyber Monday.  We’re excited by our work with these amazing retailers and we look forward to collaborating with many more on their journey to the cloud. If you are at NRF’s Big Show this week, visit us at booth #4255, and be sure to check out our Big Ideas Sessionto hear more about how brands like Carrefour, METRO AG, Ocado and Ulta are transforming the retail industry with the help of Google Cloud. Or you can learn more by visiting our solutions page for retail.
Quelle: Google Cloud Platform

Peak performance: How retailers used Google Cloud during Black Friday/Cyber Monday

At Google Cloud, we work with businesses in a range of industries, and we’ve seen nearly every business experience peak events when their online traffic skyrockets. For retailers, their peak events are Black Friday and Cyber Monday (or BFCM)—the period right after Thanksgiving in the U.S., when holiday shopping starts. The weekend kicks off the all-important holiday shopping season of November and December, when an estimated20% of all annual retail sales occur.During an average day, online retail sales in the U.S. total about $1.4 billion,CNET reports. In contrast, on Black Friday 2018, U.S. online sales totaled $6.22 billion (up 24% from 2017). Cyber Monday 2018 sales surged to $7.9 billion (up 19% from 2017)—the biggest online sales day ever in the U.S., according toAdobe Analytics.  Traffic to retailers’ mobile and shopping apps surges to levels unmatched during the rest of the year, and availability or scalability issues can result in millions of dollars of lost sales. Every year, there are well-publicized retail website crashes, so avoiding downtime—along with the accompanying reputation damage, unhappy customers and stressed, overworked IT teams—is particularly important for retailers.We know that a solid technology infrastructure is the foundation for retailers to stay ahead of demand and succeed during this busy season. Beyond that, though, support for that infrastructure is essential. Support isn’t just activated if something goes wrong. Support for an event like Black Friday and Cyber Monday involves preparation well ahead of time, and includes testing, architecture reviews, capacity planning, operational drills, and war rooms during the event itself. We took a prescriptive approach to BFCM support, setting expectations and ownership early (more than six months ahead), to understand what each retail customer needed, both on their side and from our team.  We’ll go through the steps that helped our retail customers have a fruitful and disaster-free season. These steps can generally help you prepare for your own peak event. We’ll also describe how one large-scale retail platform in particular—Shopify—had a successful BFCM using Google Cloud.  Preparing to support retailers on Black Friday/Cyber MondayWe started planning for Black Friday and Cyber Monday for our retail customers in the spring of 2018 to align with their typical preparation timeline. We formed a task force composed of representatives from Google Cloud’s Professional Services, Customer Engineering,Support,Customer Reliability Engineering (CRE), and Product and Engineering teams. We met regularly to strategize, develop tactics, and execute on those tactics with the goal of making sure Google team members and our GCP retail customers were well-prepared.We focused on a few key technology areas where planning could help prevent any issues.1. Early capacity planningAs early as May 2018, our account teams began reaching out to GCP retail customers. We discussed high-level planning, such as their particular holiday shopping objectives and the infrastructure capacity they might need to meet those goals.We worked closely with retailers to review their architectures and advise on techniques to forecast and plan for increases in capacity before Black Friday, since scalability is essential when planning for traffic spikes. We conducted tests across teams and services, and stress-tested systems to uncover any constraints or weaknesses and remediate as needed. Those tailored preparations paid off across the board. With GCP capacity status firmly green—available—throughout Black Friday and Cyber Monday, shoppers visiting our retail customers’ sites could make their purchases without running into a slow or unresponsive site.2. Reliability testingIdentifying potential reliability issues in a “pre-mortem” (an important component of CRE) was another preemptive step we took. Early on, our CRE team partnered with our retail customers to analyze the reliability of their infrastructures, and run through tabletop exercises to see how well-prepared the customer was in the face of a failure. In some cases, the Professional Services team helped perform load testing to make sure retailers’ platforms could handle expected levels of peak traffic, and in others we encouraged regular load testing and evaluation. And given how important mobile commerce has become, we also tested the performance and reliability of customers’ mobile apps. We also employed Apigee’s API monitoring tools to ensure API stability. We’ve seen APIs become more important in retail technology, since they allow more flexible, microservice-based e-commerce sites.3. Operational war rooms“What could possibly go wrong?”That’s the million-dollar question to ask before a big IT event. We got together with our retail customers’ IT and engineering teams to explore and test for possible worst-case scenarios, like an entire site crash. We created a central Black Friday/Cyber Monday war room staffed with senior-level, experienced Googlers from the Professional Services, Support, and Site Reliability Engineering (SRE) teams. This team of first responders was prepared to use real-time communications to stay connected and address any problems as soon as they arose. This was in addition to understanding customer and vendor integrations and making sure escalation paths were defined ahead of time, so that customer expectations were clear for various channels.During that weekend, we doubled the number of on-call support staff available to retail customers. In some cases, we placed account teams on-site at GCP and Apigee retail customer locations to help as needed. We monitored whether any retail customers were starting to have reliability or latency problems. If something needed to be triaged, the war room team kicked into action, tackling issues and advising on next steps. The Google war room team also had direct, open access to Google engineers and executives for additional support.Apigee team members kept a close eye on API traffic during the Black Friday period. The number of API calls for Apigee’s customers (excluding those who host the platform on-premises) grew 95% compared to the same span of time in 2017. Peak API traffic running through Apigee more than doubled, from 48,000 transactions per second (TPS) to 108,000 TPS this year, and the platform remained 99.999% available.How retailers sailed through Black Friday and Cyber MondayOne of our retail partners, Shopify, is an e-commerce platform supporting more than 600,000 independent retailers. The complexity of managing all those storefronts makes predicting holiday site traffic and sales spikes even more challenging. Shopify provides a platform with 99.98% uptime, and calls BFCM their annual “World Cup” event.SourceShopify’s platform is made up of many internal services and interaction points with third-party providers, such as payment gateways and shipping carriers. Each of those dependencies has to be reliable and perform well for BFCM to go off without a hitch.In 2017, on Black Friday and Cyber Monday, only about 10% of Shopify’s stores ran on GCP. The rest were hosted from their own data center. In 2018, Shopify went all-in on GCP as its infrastructure provider, with 100% of its retailers running on our platform.Shopify was an early adopter of Docker containers and now usesGoogle Kubernetes Engine as itscontainer management system, along with theCloud Storage unified object storage service.Shopify Production Engineers began working side-by-side with Google’s BFCM team months before the holiday shopping season. We collaborated on capacity planning so Shopify would have the right capacity buffer needed to accommodate an even bigger peak load than they had in 2017, and helped diagnose and fix potential performance problems, such as network latency.During the rest of the year, our Shopify account team stayed highly engaged with Shopify engineers on Slack, Google Hangouts Chat, and other real-time communications tools. For Black Friday and Cyber Monday, we increased our communication further and dispatched Googlers to Shopify’s own war room in Toronto.“As we went into BFCM 2018, we no longer had data center capacity to fall back on,” says Camilo Lopez, Director of Production Engineering at Shopify. “But we were confident that with Google Cloud, we had the extra support and strong technology foundation needed for a successful Black Friday and Cyber Monday. The big event came and went without incident. Our merchants collectively sold over$1.5 billion USD in merchandise that weekend,up from $1 billion in 2017.”This BFCM weekend was a record breaker for Shopify, with a peak of nearly 11,000 orders created per minute and around 100,000 requests per second being served for extended periods during the weekend. Overall, most system metrics followed a pattern of 1.8 times what they were in 2017.Cloud planning and support make for stress-free events  By following the above strategies, you can be ready for whatever comes your way, whether it’s a huge, unanticipated traffic spike or a major uptick in sales you count on every year. And that brings benefits for customers and your IT teams. After this year’s successful BFCM, a staff member from one of our newer retailers sent us a note of thanks and remarked that 2018 was the first time in years that he was able to enjoy Thanksgiving dinner with his family.To achieve your own low-stress peak events, plan and prepare before the event. Consider how your service might fail, how you’d detect these failures, and how you’d react to them. Perform tests to find potential weaknesses. Choose good measures of your customers’ experience, and closely monitor your infrastructure during the event. Do a post-mortem immediately afterwards to make the next big event is even smoother. Find out more here on adopting these strategies for your organization.And of course, our GCP support team is here to help during these events, both planned and unplanned. If you have a large event where we can help, get in touch with your Technical Account Manager, or your Google Cloud account team.
Quelle: Google Cloud Platform

Livin’ la vida local: Easier Kubernetes development from your laptop

Running applications in containers on top of Kubernetes is all the rage. However, the brave new world of containers isn’t always kind to application developers who are used to a fast local developer experience. With Kubernetes, there can be lots of differences between how you develop and run an application locally vs. in a Kubernetes cluster.Here at Google, we want to speed up your workflow and reduce these differences, so you can enjoy a great local developer experience. To that end, we made some recent contributions to the open-source projects for Minikube, which lets you run Kubernetes workloads locally, and Skaffold, a command line tool for continuous development on Kubernetes. We think these updates will make a big difference in your day-to-day life as a Kubernetes developer.Run GPU workloads on minikubeAs machine learning (ML) and other compute intensive applications become more and more popular, there’s an increasing need for hardware accelerators like GPUs to speed up these workloads. If you have containerized ML workloads, for instance, you can use GPUs on Google Kubernetes Engine (GKE), which provides a production-ready environment.However, there hasn’t been a local Kubernetes development environment that supports GPU workloads. That means that to develop and test GPU apps, you either have to use a local environment that doesn’t resemble your production GKE environment, or you have to use a remote environment, increasing the latency of the feedback cycle. Neither of these are great options, since doing development on an environment that differs from production can result in subtle bugs and reduced productivity.This is where Minikube can help. Minikube is the de-facto standard for running Kubernetes workloads locally. It runs a single-node Kubernetes cluster inside a VM on your developer machine. Then, this past summer, we added GPU support to minikube, improving the developer experience of creating GPU workloads on Kubernetes.Now, you can pass-through a spare GPU from your workstation to this VM and run GPU workloads on minikube. Currently, this integration only works on Linux and has some hardware requirements. Learn more about the requirements and find detailed instructions on how to set this up in the minikube documentation.Run services of type=LoadBalancer on minikubeIf the plan is to deploy your application to a cloud platform, you probably want to create some services with the Kubernetes LoadBalancer type, which creates a load balancer and external IP. For example, in GKE, the platform provisions the necessary infrastructure including firewall rules and an external endpoint and updates the service status with the external IP in the External-IP field. However, until recently, if you tried to do this in minikube, you would be faced with a never-resolving External-IP. For example, kubectl get svc nginx returns:Minikube supports emulating behavior of services with a LoadBalancer type. But in case of minikube The command currently runs as a separate daemon, and creates a network route to the minikube VM, making the ClusterIP available from the host machine, and copies the clusterIP to the ExternalIP field:You’ve been asking for this feature for a long time, and unlike other local container development environments, it works for as many load balancing services as you like. See the documentation for more details and try it out!Build and deploy Java projects with Jib and SkaffoldJava developers draw from a vast ecosystem of tooling and libraries that make developing in Java a breeze. However, effectively containerizing Java apps on Kubernetes can be difficult. Build times can be slow. Containers can be heavy. Making a change and having your application server reload with that new change applied is not a simple process.We announced Jib a few months ago. Jib containerizes your Java applications with zero configuration. With Jib, you don’t need to install Docker, run a Docker daemon, or even write a Dockerfile. Jib leverages information from your build system to containerize your applications efficiently and enable fast rebuilds. Jib is available as a plugin for Maven or Gradle so that you can use Jib with the build system you are familiar with. Just apply the plugin and run your build—you’ll have your container available no time.Jib is now available as a builder in Skaffold. You can use Skaffold with a Maven or Gradle project configured with the Jib plugin. Skaffold uses Jib to containerize your JVM-based applications and deploy them to a Kubernetes cluster when it detects a change. No more tedious steps to redeploy your application for every change you make. You can now focus on what you really care about—writing code. To get started, simply add jibMaven or jibGradle to your artifact in your skaffold.yaml. See the Skaffold repository for an example.We’re excited for you to try out Skaffold and Jib to help you improve your Java on Kubernetes development workflow. We are building out more integrations and welcome your feedback!Sync files to your pods with SkaffoldWith even one change to a file, Skaffold rebuilds the images that depend on that file, pushes them to a registry, and then redeploys the relevant parts of your Kubernetes application. For most projects, immediate rebuild and redeploy is the quickest way to see the effects of local changes to your code.However, what if you’re working on a simple web application and you modify just one HTML file. Though a rebuild and redeploy would incorporate this change correctly, it’s no longer the fastest solution. Instead, it would be much more efficient if Skaffold could simply inject the new version of the file into an already running container. The change would immediately be picked up, and the engineer could quickly visualize modifications to the code.The Skaffold file sync feature solves this problem. For each image, you can specify which files can be synced directly into a running container. Then, when you modify these files, Skaffold copies them directly into the running container rather than kicking off a full rebuild and redeploy. With Skaffold’s file sync feature, you can enjoy even faster development!Visit the links below and give a try of all Skaffold’s new features.Skaffold exampleshttp://skaffold.devDownload the latest SkaffoldMaking local development for Kubernetes awesomeAlmost all great apps get their start on a developer’s laptop. Here at Google Cloud, we have a great group of people dedicated to making local development for Kubernetes applications awesome. Here’s a big shout out to everyone on the team who contributed to this article: Rohit Agarwal, Priya Wadhwa, Appu Goundan, Q Chen and Brian de Alwis, Kim Lewandowski, Ahmet Alp Balkan, David Gageot, Vic Iglesias and Don McCasland. And if you have other ideas about how to improve the local Kubernetes app development process, let us know!
Quelle: Google Cloud Platform

Identity and authentication, the Google Cloud way

Users expect simple and secure sign-up, sign-in, and self-service experiences from all their favorite devices. As a security professional, you could build identity and access management functionality for your organization, but that’s hard and expensive: you’d need to build and maintain an identity platform that stays up-to-date with constantly evolving authentication requirements, keeps user accounts secure in the face of increasing threats, and scale the system reliably when the demand for the service grows. Or, you can have Google do it for you.Whatever your identity needs, Google Cloud has a complete set of tools that you can integrate to create a modern, sophisticated identity platform. This post describes Google Cloud’s authentication and identity management offerings to help you determine what solution best fits your needs.Authentication use casesSetting up authentication can be tricky. You’ve got a variety of use cases—everything from workplace productivity suites, cloud-based resources and APIs. Some authentication is done on behalf of a piece of software, e.g., when one service invokes another service’s API. Most other authentication is based on user populations, including customers, partners, and employees. Some of these populations collaborate through shared resources, e.g., a G Suite document that’s shared between an employee and a customer. The following diagram shows a potential (simplified) scenario:In all but the most trivial cases, there are lots of different types of users that need to be authenticated:Internal users accessing workplace or office productivity solutionsInternal users accessing third-party appsInternal users accessing internally built and hosted appsInternal users accessing and administering cloud resources directlyUsers making a proxy call to an API (tracking who made call, and on behalf of which end user the request was made)External users accessing applicationsIf you deploy your own applications, those too need to be authenticated. Examples include:API calls from internal servicesAPI calls from third partiesDevices authenticating to cloud-hosted servicesWith this variety of users, use cases and applications, it can be confusing to know which identity and authentication method to use, in what circumstances.  GCP identity management and authentication methodsGoogle Cloud offers a number of authentication and identity management solutions that support many common use cases:Cloud Identity- Cloud Identity is an Identity as a Service (IDaaS) and enterprise mobility management (EMM) product that offers identity services and endpoint administration for G Suite or as a stand-alone product. As an administrator, you can use Cloud Identity to manage your users, apps, and devices from the central Google Admin console. Click here to learn more about Cloud Identity features.Secure LDAP – This feature of Cloud Identity and G Suite lets employees access LDAP-based apps and infrastructure using their Cloud Identity (or G Suite) credentials. With Secure LDAP, IT teams can use a single cloud-based identity and access management solution (Cloud Identity) to enable employees access to both SaaS and traditional apps/infrastructure.Cloud Identity for Customers and Partners (CICP) – CICP is a customer identity and access management (CIAM) platform that lets you add Google-grade identity management functionality to your apps. Built on top of Firebase Authentication, CICP provides an end-to-end authentication system for third-party users to access your apps and services, including mobile/web apps, games, and APIs, to name a few. If you’re building a service on Google Cloud (or anywhere else for that matter), and need secure, yet easy-to-use authentication capabilities, check out CICP.In addition to managing/federating end user credentials, CICP also provides a token brokerage service.API Proxies (Apigee Edge / Cloud Endpoints) – Google Cloud API proxies are an abstraction layer that “fronts” for your backend service APIs, providing not only a proxy but also management and security features such as authentication and validation. That way, you know what is calling your APIs, with short-lived tokens and logging helping to prevent their unauthorized use. Google Cloud provides two options: Cloud Endpoints are a great choice across GCP while Apigee Edge works cross-platform and includes enterprise features like rate limiting, quotas, analytics, and more.Cloud Identity-Aware Proxy (IAP) – Cloud IAP works by verifying user identity and the context of a request to access a cloud-based application hosted on GCP. It determines if a user should be allowed to access the application. Cloud IAP is a building block toward BeyondCorp, an enterprise security model that enables every employee to work from untrusted networks without having to use a VPN.When Cloud IAP grants a user access to an application or resource, they’re subject to the fine-grained access controls implemented by the product in use without requiring a VPN. When a user tries to access a Cloud IAP-secured resource, Cloud IAP performs authentication and authorization checks. Context-aware access allows organizations to define and enforce granular access to GCP workloads and G Suite based on a user’s identity and the context (location, device, etc.) of their request. Context-aware access verifies that:The user is trusted: they have a password, authentication strength (e.g. 2SV, Security Keys), and Cloud IAP’s machine-learning detects no abnormal user behaviour.The device is trusted with Endpoint Verification.The location is trusted (IP address).Authenticating against GCP  – Authenticating directly to GCP requires a recognized identity such as a Google account, a service account, a Google Group or a Cloud Identity or G Suite identity (including identities that have been synced with Cloud Identity).Mapping your use case to a GCP authentication methodNote in all cases we assume that GCP is the identity providerThe following matrix helps you determine what identity/authentication solution is appropriate for your use case:Internal user authentication requirementsApplication access authentication requirementsAuthentication decision treeIf text and tables aren’t your thing, here’s a visual way to help you decide how to pick the appropriate identity and authentication method for your use case.As you can see, Google Cloud provides a wealth of authentication options for seemingly any kind of user or application. To learn more about identity and authentication of Google Cloud, check out the resources in this blog post. Then, there’s also the Security & Identity Fundamentals quest1, a hands-on training course. And be sure to let us know about any use cases that aren’t covered here!1. Use code 1j-security-983 and get one month of Qwiklabs access to complete the quest free of charge (redeem by Jan 31, 2019)
Quelle: Google Cloud Platform

Coastal classifiers: using AutoML Vision to assess and track environmental change

Tracking changes in the coastline and its appearance is an effective means for many scientists to monitor both conservation efforts and the effects of climate change. That’s why the Harte Research Institute at TAMUCC (Texas A&M University – Corpus Christi) decided to use Google Cloud’s AutoML Vision classifiers to identify attributes in large data sets of coastline imagery, in this case, of the coastline along the Gulf of Mexico. This post will describe how AutoML’s UI helped TAMUCC’s researchers improve their model’s accuracy, by making it much easier to build custom image classification models on their own image data. Of course not every organization wants to analyze and classify aerial photography, but the techniques discussed in this post have much wider applications, for example industrial quality control and even endangered species detection. Perhaps your business has a use case that can benefit from AutoML Vision’s custom image classification capabilities.The research problem: classification of shoreline imageryThe researchers at the Harte Research Institute set out to identify the types of shorelines within aerial imagery of the coast, in order to accurately predict the Environmental Sensitivity Index (ESI) of shorelines displayed in the images, which indicate how sensitive a section of shoreline would be to an oil spill.   Anthony Reisinger and his colleagues at the Harte developed an Environmental Sensitivity Index map of shorelines that may be impacted by oil spills for the State (government) of Texas. During this process, the team looked at oblique aerial photos and orthophotos similar to what one might find on Google Maps, and manually traced out shorelines for the entire length (8950 miles) of the Texas coast (see below). After the team traced the shoreline, they then coded it with ESI values that indicate how sensitive the shoreline is to oil. These values were previously standardized by experts who had spent many years in the field and scrutinizing coastal images.Texas coast with cyan overlay of ESI shorelineAfter an oil spill, the State of Texas uses these ESI shoreline classifications to send out field crews to highly sensitive environments near the oil spill. The State then isolates sensitive habitats with floating booms (barriers that float on water and extend below the surface) to minimize the oil’s impact on the environment and the animals that live there.As you might imagine, the process of learning how to identify the different types of environment classifications and how sensitive these shorelines are to oil spills takes years of first-hand experience, especially when imagery is only available at different scales and resolutions. Some of the team’s research over the years has utilized machine learning, so the researchers decided to see if their expert knowledge could be transferred over to a machine and automate the identification of the different types of ESI shorelines within the images and among the different types of imagery used.  Coastal environments can rapidly change due to natural processes as well as coastal development, thus, the state needs to update its ESI shoreline assessments periodically. At the moment, the team plans to update the ESI shoreline data set for the entire Gulf Coast that lies within the State of Texas. During this process, new oblique imagery will be acquired to help identify the shorelines sensitivity to oil spills. With AutoML Vision, the team takes newly-acquired oblique imagery and predicts the ESI values in the shoreline photos, thereby classifying (or coding) the new shoreline file we create.Imagery typesThe team experimented with two different types of aerial shoreline images: oblique and orthorectified. For orthorectified aerial photos, a grid was overlaid on the imagery and ESI shorelines, and both were extracted for each grid cell and joined together. For the oblique shoreline photos, the team experimented with applying both single labels and multiple labels (also known as multi-class detection). Details of this latter approach are mentioned later in this post.Rectified imagery overlaid with ESI shorelines and grid used to extract both imagery and shorelines.But to begin, let’s take a look at the results on the oblique image set. Early experiments comparing precision and recall metrics of AutoML models using orthorectified aerial photos of different pixel resolutions and acquisition dates were compared to AutoML models of oblique photos. Interestingly, the team found that prediction accuracy using oblique imagery models was higher than that for orthorectified imagery models. The oblique imagery models’ higher performance is likely due to larger geographic coverage of the oblique imagery, and the inclusion of vertical information in these images.Cloud Vision’s limitations for our use caseA little testing confirmed that the out-of-the-box Cloud Vision API won’t help with this task: Cloud Vision can identify many image categories, but, unsurprisingly, the results proved too general for the team’s purposes.Cloud Vision’s labels are too general for coastline classification.The team then decided that the shoreline images dataset is perfect for use with AutoML Vision, which let the team build their own domain-specific classifier.Cloud AutoML Vision provides added flexibilityCloud AutoML allows developers with limited machine learning expertise to train high-quality models specific to their data and business needs, by leveraging Google’s state-of-the-art transfer learning and Neural Architecture Search technology. Google’s suite of AutoML products currently includes Natural Language and Translate as well as Vision, all currently in beta.By using AutoML Vision, the team was able to train custom image classification models with only a labeled dataset of images. AutoML does all the rest for you: it trains advanced models using your data, lets you inspect your data and analyze the results via an intuitive UI, and provides an API for scalable serving.The first AutoML experiment: single-labeled imagesThe team first experimented with a single-label version of the oblique image set, in which the label referred to a single primary shoreline type included in the image. The quality of this model was passable, but not as accurate as the team had hoped. To generate the image labels, the direction of the camera and aircraft position were used to project a point to the closest shoreline, and each image was assigned a label based on both the camera’s heading and the proximity of the shoreline to the plane’s position.Map showing single-label method used to join the aircraft’s position with the nearest ESI shoreline from the image on the left. Image was taken from the aircraft’s position in the map (Note: the projected point was assigned the value of the closest shoreline point to the plane/camera’s location; however, this photo contains multiple shoreline types).Precision and recall metrics across all labels, using the single-label dataset.The AutoML UI allows easy visual inspection of your model’s training process and evaluation results, under the Evaluate tab. You can look at the metrics for all images, or focus on the results for a given label, including its true positives, false positives, and false negatives. Thumbnail renderings of the images allow you to quickly scan each category.From inspection of the false positives, the team was able to determine that this first model often predicted coastline types that were actually present in the image, but did not match the single label. Below, you can see one example, in which the given coastline label was salt_brackish_water_marshes, but the model predicted gravel_shell_beaches with higher probability. In fact, the image does show gravel shell beaches as well as marshes.AutoML Vision correctly predicts that this image contains gravel shell beaches, even though it wasn’t labeled as such.After examining these evaluation results, the team concluded that this data would be a better fit for multi-label classification, in which a given image could be labeled as containing more than one type of shoreline. (Similarly, you might want to apply multiple classes to your training data as well, depending on your use case.)The second AutoML experiment: multi-labeled imagesAutoML supports multi-labeled datasets, and enables you to train and use such models. With this capability in mind, the team soon discovered it was possible to generate such a dataset from the original source images, and then ran a second set of experiments using the same images, but tagged with multiple labels per image, where possible. This dataset resulted in significantly more accurate models than those built using the single-label dataset.Map illustrating the multi-label method of ESI shoreline label extraction using modeled field-of-view (FOV) of the camera and the image taken from the aircraft’s position on the map (Note: this method allows for the majority of the shorelines in the FOV to be assigned to this image).Precision and recall metrics across all labels, for a model trained on the multi-label dataset.The following image is representative of how the multi-labeling helped: its labels include both gravel_shell_beaches and salt_brackish_water_marshes, and it correctly predicts both.This image’s multiple classifications were correctly predicted.Viewing evaluation results and metricsAutoML’s user interface (UI) makes it easy to view evaluation results and metrics. In addition to overall metrics, you can view how well the model performed with each label, including display of representative true positives, false positives, and false negatives. A slider lets you adjust the score threshold for classification—for all labels or for just a single label—and then observe how the precision-recall tradeoff curve changes in response.Often, classification accuracy is higher for some labels than others, especially if your dataset includes some bias. This information can be useful in determining whether you might increase model accuracy by sourcing additional images for some of your labels, then further training (or retraining) them.Viewing evaluation results for the “gravel_shell_beaches” label.Comparing models built using the same datasetAutoML Vision allows you to indicate how much (initial1) compute time to devote to creating a model. As part of the team’s experimentation, it also compared two models, the first created using one hour of compute time, and the other using 24 hours. As expected, the latter model was significantly more accurate than the former. (This was the case for the single-label dataset as well.)Viewing evaluation results for the “gravel_shell_beaches” label.Using your models for predictionAutoML Vision makes it easy for you to use your trained models for prediction. You can use the Predict tab in the UI to see visually how a model is doing on a few images. You can use the ‘export data’ feature in the top navigation bar to see which of your images were in which data set (training, validation, or test) to avoid using training images.Predicting the classes of shoreline shown in a new imageThen, you can access your model via its REST API for scalable serving, either programmatically or from the command line. The Predict tab in the AutoML UI includes examples of how to do this.What’s nextWe hope this helps demonstrate how Cloud AutoML Vision can be used to accurately classify different types of shorelines in aerial images. We plan to create an updated version of the ESI shoreline dataset in the future and use the AutoML model to predict shoreline types on newly acquired oblique photography and orthorectified imagery. Use of AutoML will allow non-experts the ability to assign ESI values to these shorelines we create. Try it yourselfThe datasets we used in these experiments are courtesy of the Harte Research Institute at the Texas A&M University – Corpus Christi. You can use these datasets yourself. See this README for more information, and see this documentation page for permission details. Of course you can use the same techniques to classify other types of geographical or geological features, or even entirely unrelated image categories. AutoML Vision lets you extend and retrain the models that back the Cloud Vision API with additional classes, on data from your organization’s use case.AcknowledgementsThanks to Philippe Tissot, Associate Director, Conrad Blucher Institute for Surveying and Science, Texas A&M University – Corpus Christi; James Gibeaut, Endowed Chair for Coastal and Marine Geospatial Sciences, Harte Research Institute, Texas A&M University – Corpus Christi; and Valliappa Lakshmanan, Tech Lead, Google Big Data and Machine Learning Professional Services, for their contributions to this work.1. For options other than the default ‘1 hour’ of compute time, model training can be resumed later if desired. If you like, you can add additional images to the dataset before resumption.
Quelle: Google Cloud Platform