Train ML models on large images and 3D volumes with spatial partitioning on Cloud TPUs

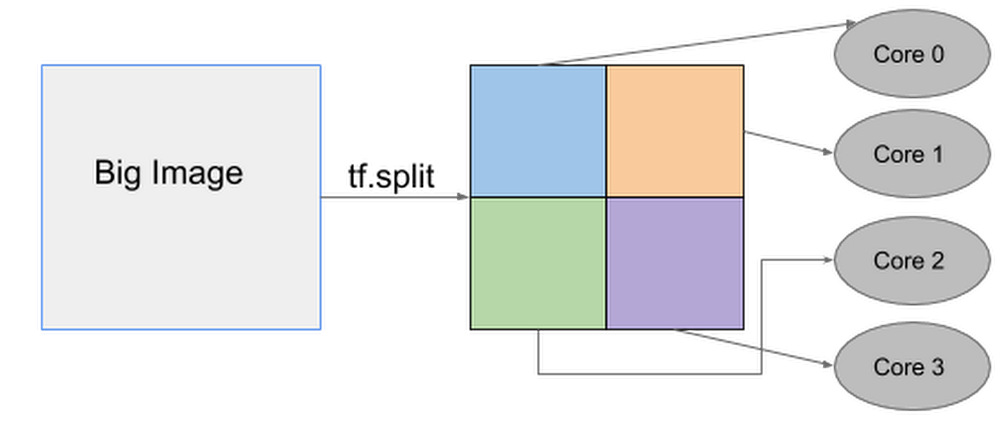
Convolutional neural networks (CNNs) are the foundation of recent advances in image classification, object detection, image segmentation, and many other computer vision applications. However, practitioners often encounter a problem when they try to train and run state-of-the-art computer vision models on larger input images: their CNN no longer fits on a single accelerator chip!To overcome this limitation, Cloud TPUs now provide a new spatial partitioning capability that makes it possible to split up a single model across several TPU chips to process much larger input data sizes. This technique is general enough to handle large 2D images as well as 3D volumes, which makes it valuable for applications ranging from object detection for autonomous navigation to analysis of 3D medical scans. For example, Mayo Clinic has used spatial partitioning on Cloud TPU Pods to segment CT scans at their full 256x256x256 pixel resolution instead of being forced to downsample, which can cause accuracy loss and other issues.At Google, we have been using spatial partitioning for many different applications, including medical image segmentation, video content analysis, and object detection for autonomous driving. Cloud TPU spatial partitioning allows you to seamlessly scale your model by leveraging 2, 4, 8, or even 16 cores for training ML models that would otherwise not fit into the memory on a single TPU core. When using more than one core for your model, our XLA compiler will automatically handle the necessary communications among all cores. This means there are no code changes required! All you need to do is configure how the inputs to the model should be partitioned.Below is an example of how one big image can be split up into four smaller images that are then processed separately on individual TPU cores.TPU spatial partitioning APIThe TPU spatial partitioning API is supported in TPUEstimator; to use it, you specify in TPUConfig how to partition each input tensor. The following is a TPUConfig example of four-way spatial partitioning for an image classification model. This configuration will split the features tensor into four parts along the height dimension (assuming the tensor has shape [batch, height, width, channel]).Reference models2D object detectionRetinaNet is an object detection model that localizes objects in images with a bounding box and also classifies the identified objects. The largest image size that fits on a single Cloud TPU core (with per-device batch 8) is 1280×1280. With spatial partitioning, we can train 4x larger images across the eight TPU cores of a single Cloud TPU device. The table below shows that spatial partitioning can also be used across a multi-host Cloud TPU Pod slice to accommodate an even larger image size (2560×2560). By automatically distributing all of the necessary processing across 64 TPU cores, the overall step time remains low even when working with a much larger image:3D image segmentation3D UNet is a popular dense 3D segmentation model which has been widely used in the medical imaging domain. The original resolution for CT images can be as large as 256x256x256, which is too large to fit into a single Cloud TPU core. In the past, medical researchers would typically need to downsample the input volume to 128x128x128, potentially giving up accuracy in the process. With Cloud TPU spatial partitioning, no compromise is necessary: 16-way spatial partitioning makes it possible to process CT image scans at the the full input resolution of 256x256x256.The table below shows that spatial partitioning across 128 TPU cores makes it possible to process a full-resolution 256x256x256 CT scan sample even faster than a 128x128x128 sample can be processed on a smaller number of cores.Getting started with spatial partitioningTo learn how to configure spatial partitioning properly for your applications, consult this guide. You can also try out our reference models (RetinaNet, 3D UNet) to train 2D object detection and 3D image segmentation models with spatial partitioning enabled.AcknowledgementsMany thanks to our collaborators Panagiotis Korfiatis, Ph.D., and Daniel Blezek, Ph.D., from Mayo Clinic for providing the initial 3D UNet model and training data.Thanks also to those who contributed to this post and who helped implement spatial partitioning on Cloud TPUs, including Zak Stone, Wes Wahlin, Xiaodan Song, Greg Mikels, Yeqing Li, Le Hou, Chiachen Chou, and Allen Wang.
Quelle: Google Cloud Platform

Cloud Spanner amps up SLA, adds CSV support, and sharpens monitoring details

Providing reliable data services that you can trust to serve your data is the most important goal for our database team here at Google Cloud Platform (GCP). That’s why we put money on the table in the form of availability service-level agreements (SLAs).We’re pleased to announce that all Cloud Spanner instances (not just those of three nodes or more) are now covered under the SLA. Cloud Spanner now supports 99.99% monthly uptime percentage for all regional instances and 99.999% monthly uptime percentage for all multi-region instances under the Cloud Spanner SLA, regardless of instance size.How is this achieved? Each regional Cloud Spanner node is backed by three replicas (each in a different availability zone), and each multi-region Cloud Spanner node has five or more replicas behind it. Cloud Spanner replication allows the service to deliver high availability for each node, and Cloud Spanner’s industry-leading architecture allows all of these replicas to stay in sync and provide up-to-date data. Cloud Spanner provides “scale insurance”—you can start in production with a small instance and not have to re-architect as your application grows. All of this is backed by the SLA.What else is new with Cloud SpannerAdditionally, Cloud Spanner continues to launch multiple features to improve your experience developing applications on GCP, wherever you are in the world. Other recent highlights include:Open source JDBC driver.Written and supported by Google and available under the Apache-based EULA, our JDBC driver implements best practices to aid Java developers using Cloud Spanner. Get started here.Import and export data in CSV format. To help you move data in and out of Cloud Spanner using open and popular formats, the service now supports importing CSV (comma-separated values) files into Cloud Spanner, as well as exporting data from Cloud Spanner to CSV files, in addition to the already supported Apache Avro format. Using Cloud Dataflow, customers can import data into Cloud Spanner from a Cloud Storage bucket that contains a JSON manifest file and a set of CSV files, or export data from Cloud Spanner to a Cloud Storage bucket. To learn more, check out the documentation.Sao Paulo region. Cloud Spanner is now available in Sao Paulo, Brazil, benefiting those of you who need regional instances in South America.Introspection. One of the major differences of using a managed database service like Cloud Spanner instead of running your own database is the ability to peek under the hood when something doesn’t go as expected. To help you better understand how your Cloud Spanner instance is behaving, we have introduced improvements to the fidelity of monitoring data you can get from the system.Latency graphs. If you’re using Cloud Spanner, you can use latency metrics to understand the overall health of your instance and diagnose latency-related issues. The Cloud Spanner console now has graphs for 50th percentile and 99th percentile latency at the database and instance level, including breakdowns for read and write latency. These graphs are also available in Stackdriver.Finer-grained CPU utilization graphs. These enable you to see how Cloud Spanner CPU resources are used and get better insight into system operations vs. user-initiated work. CPU utilization graphs help customers diagnose CPU-related issues and allocate nodes more effectively. Cloud Spanner console now has graphs for rolling average and high-priority CPU utilization, as well as including the database and user/system breakdowns in the total CPU utilization graph.We hope these updates make developing on Cloud Spanner an even more reliable and productive experience. We can’t wait to hear about what you build. Check out our Cloud Spanner YouTube playlist to learn more.
Quelle: Google Cloud Platform

Monitoring your Compute Engine footprint with Cloud Functions and Stackdriver

Compute Engine instances running on Google Cloud Platform (GCP) can scale up and down quickly as needed by your business. As your fleet of instances grows, you’ll want to ensure that you have enough Compute Engine quota for growth over time and that you understand your resource usage and costs. At scale, gaining a single view across projects and products requires comprehensive monitoring, and you’ll want to be able to track and manage all your cloud resources. It’s also worth keeping in mind that several of our GCP managed services, such as Cloud Dataflow, Cloud Dataproc, Google Kubernetes Engine, and managed instance groups, all provide autoscaling. That means they scale Compute Engine instances up or down based on the processing load and therefore aren’t static in number. As the number of your GCP projects grows, identifying the current instance count and tracking the count over time gets harder. In this post, we’ll show you how to set up custom monitoring metrics in Stackdriver so you can have a continual view into your instances at any given time.Compute Engine instances automatically report many different metrics to Stackdriver Monitoring, GCP’s integrated monitoring solution, including instance uptime, CPU utilization and memory utilization. Stackdriver Monitoring also provides an agent that provides more detailed CPU, memory and disk metrics. You can use these metrics to indirectly calculate an accurate number of your virtual machines. For example, you could calculate the number of running instances by counting the uptime metric, as shown here:This approach, while easy to implement, has several parameters to keep in mind. For example, this approach requires that all the projects are within the same Stackdriver Workspace and it only captures instances that are in a RUNNING state (not TERMINATED). If these requirements don’t apply to your GCP environment, then you can easily build a dashboard using an existing metric. However, if you need to implement the counting approach, Stackdriver Monitoring provides a way to record the instance count via custom monitoring metrics. Custom monitoring metrics are metrics that you write and use like any other metric in Stackdriver, including for alerting and dashboards. Let’s take a look at how you can use these custom metrics to monitor the total number of Compute Engine instances in your GCP environment.Getting and reporting instance metricsThere are three steps to find the current number of Compute Engine instances in your environment and then write this number as a custom monitoring metric to Stackdriver Monitoring:Get a list of the VMs for all your projects. First, use the projects.list method in the Cloud Resource Manager API to get a list of projects to include. Once you have the list, use the instances.list method in the Compute Engine API to get a list of all the VMs in each project.Write the list of VMs to Stackdriver Monitoring as a custom metric. You can also use custom labels.Build a dashboard in Stackdriver Monitoring. You can build a dashboard with the custom metrics and group by your custom labels.Here’s what this looks like in practice. The following reference architecture describes a serverless, event-based architecture to get a list of Compute Engine instances for all projects within an organization and then write those metrics to Stackdriver Monitoring.Cloud SchedulerUsing a custom monitoring metric means that you need to regularly write metric values to Stackdriver Monitoring. Using Cloud Scheduler, you can initiate the process of gathering the compute instance count and writing the custom monitoring metric every 10 minutes. Cloud Scheduler sends a Cloud Pub/Sub message, which then triggers the first Cloud Function to gather a list of projects.Cloud FunctionsCloud Functions is a good option as an orchestrator because it’s serverless, well-integrated into the GCP platform and scales up and down as required by the load. Cloud Functions enable an event-driven, asynchronous design pattern, which helps to both scale over time and decouple the functionality across different Cloud Functions. To make it even easier, you can use the NodeJS client libraries for Cloud Resource Manager, Compute Engine, Cloud Pub/Sub and Stackdriver Monitoring. Using the client libraries allows you to work directly with native objects rather than the details of the API calls.The reference architecture divides the processing into three Cloud Functions:list_projects—Triggered by the Cloud Scheduler. Gathers a list of all projects using the projects.list method on the Cloud Resource Manager API and writes each of the project IDs to a separate Cloud Pub/Sub. This means that the write_vm_count function will be executed once for each project. write_vm_count—Triggered by the each Cloud Pub/Sub message with a separate project ID. Uses the instances.list method in the Compute Engine API to get a list of all the VMs in each project. Write the results as another Cloud Pub/Sub message to trigger the write_to_stackdriver function.write_to_stackdriver—Triggered by each Cloud Pub/Sub message from write_vm_count with the compute instance count. Writes a custom monitoring metric to Stackdriver Monitoring.The diagram below captures the logical fanout in the architecture, which allows the work of gathering and reporting the instance count to happen in parallel and asynchronously. Cloud Functions and Cloud Pub/Sub make it easy to implement an asynchronous, event-driven architecture. For example, if there are three projects found in the list_projects function, then three Cloud Pub/Sub messages are sent and the write_vm_count is executed three times. The write_to_stackdriver function is also executed three times.Stackdriver Monitoring Stackdriver Monitoring collects metrics, events, and metadata from GCP and generates insights via dashboards, charts, and alerts. In order to store custom monitoring metrics, set up a Stackdriver Monitoring Workspace. You can create the Workspace inside the same project as the Cloud Functions, though you could also use a separate project. Workspaces provide a container for one or more GCP metrics (included with your deployment) and provide access to the Stackdriver Monitoring user interface, including the dashboards for rich visualizations. Once you begin reporting the custom monitoring metric, you can build a dashboard to track the value over time, filtering and grouping the chart by the labels on the metric. Stackdriver Monitoring metricsWhen you write the custom monitoring metrics, you must select a metric name and also supply any labels associated with your metric. These labels are used for aggregation and require thoughtful design. For an excellent explanation of the details of Stackdriver Monitoring metrics, check out Stackdriver tips and tricks: Understanding metrics and building charts.Two clear choices for labels include the gcp_project_id and Compute Engine instance instance_status labels. These labels let you group and filter the metric values by projects and by instance status. For example, if you have 55 instances across 10 projects, you could view the instance count by project to monitor how many instances are allocated in each project. You could also group by the instance status to view the instance count by status across all projects. Or, you could combine the two labels to see the number of instances by status in each project. Using labels gives you the flexibility to group the results in a way that you want.Cloud IAM permissionsCloud Functions supplies a default runtime Service Account that is assigned editor permissions. You can either use the default service account or create specific service accounts for each Cloud Function. Using a specific service account lets you implement the least set of privilege required for your Cloud Functions. There are several different permissions required to list the projects and then write the custom monitoring metric. Compute Viewer—This Cloud Identity and Access Management (IAM) permission can be granted at the organization level for the service account that your Cloud Function uses so that the projects.list method in the Cloud Resource Manager API returns all the projects in the organization. This is also required for use of of the instances.list method the Compute Engine API. If these permissions aren’t added, you will only get projects and instances to which your service account has access to list. Any missing permissions will generate errors.Cloud Pub/Sub Publisher—This Cloud IAM permission is required in the project in which you host the Cloud Function for the service account that your Cloud Function uses. This permission enables the list_projects and write_vm_count functions to publish their messages to a Cloud Pub/Sub topic.Monitoring Metric Writer—This Cloud IAM permission is required in the project in which you write the Stackdriver Monitoring metric for the service account that your Cloud Function uses. This permission enables the write_to_stackdriver function to publish metrics.Sample Stackdriver custom metric dashboardStackdriver Monitoring dashboards can contain many charts. Writing the labels gcp_project_id and Compute Engine instance_status means that you can filter and group by both of those metrics. As an example, you can create a chart graphing the count of instances over time grouped by the label instance_status, as shown here:You can also create a chart graphing the count of instances over time, grouped by the label gcp_project_id, like this:Sample custom metrics alertsOnce you have a metric in Stackdriver Monitoring, you can also use it for alerting purposes. For example, you could set up an alert to generate an email (like below) or SMS to notify you when you total running instance count exceeds a certain threshold (25, in the example below).Monitoring your Compute Engine instance footprint provides valuable insight into your usage trends and helps you manage your instance quota. For more, head over to the Github repo and learn about Stackdriver Monitoring.
Quelle: Google Cloud Platform

Catch web app vulnerabilities before they hit production with Cloud Web Security Scanner

This the second blog in our six part series on how to use Cloud Security Command Center. In our first post, we looked at how to enable Cloud Security Command Center and how it can improve your cloud security posture. Today’s web applications are developed at a rapid pace, and that pace is only getting faster. This makes it difficult to know if your web apps have vulnerabilities and how to fix them before they hit production. We recognize this problem, and it’s why we developed Cloud Web Security Scanner, a built-in feature in Cloud Security Command Center that allows you to detect vulnerabilities—including cross-site scripting or outdated libraries—in GKE, Compute Engine, and App Engine. In this blog, we’ll walk through how to get started with Cloud Web Security Center, with the help of a video, so you can start reducing your web app vulnerabilities. Enabling Cloud Web Security ScannerCloud Web Security Command Center isn’t turned on by default, so the first step is to enable it. In the Google Cloud Platform Console, visit the Cloud Security Command Center page, choose an organization for Cloud Web Security Scanner, and select the project within that organization that you want to use it on. If you haven’t already enabled the Cloud Web Security Scanner API, you’ll be prompted to do it here.Create, save, and run scans Cloud Web Security Scanner allows you to create, save, and run scans to detect key vulnerabilities in development before they’re pushed to production.To create a scan, add the url of the application you’d like to test, then save it by visiting the scan’s configuration page—where you can also find out more information about the scan, its history, and the controls for editing it. When you want to run a scan, just schedule the time you want it to run from the Cloud Web Security Scanner page. Once you’ve completed these steps, Cloud Security Scanner will automatically crawl your application—following all the links within the scope of your starting URLs—and attempt to exercise as many user inputs and event handlers as possible. When the scan is done, it will show any vulnerabilities it detected.View your findings and fix them After you’ve turned on Cloud Web Security Scanner and run your scans, you can also use it to explore the findings (results). It can identify many common web vulnerabilities on these pages, including Flash injection and  mixed content. In addition to using the Cloud Web Security Scanner page, you can enable Cloud Web Security Scanner under Security Sources and view your findings directly on the Cloud Security Command Center dashboard. This lets you see findings from Cloud Web Security Scanner, and other built-in security features, in one place to get a holistic look into your security posture in GCP. Just click on a finding to bring up more information about the issue and how to fix it.For more information…To learn more about Cloud Web Security Scanner and enable it for your web applications, check out our video.
Quelle: Google Cloud Platform

Architecting data pipelines at Universe.com puts customer experience on center stage

Editor’s note:Today we’re hearing from Universe, an event-based ticketing and marketing platform and a division of Live Nation. They moved to Google Cloud so they could develop new features faster, gather and act on data insights, and bring customers a great online experience.At Universe, we serve customers day and night and are always working to make sure they have a great experience, whether online or at one of our live events. Our technology has to make that possible, and our legacy systems weren’t cutting it anymore. What we needed was a consistent, reliable infrastructure that would help our internal teams provide a fast and innovative ticket-buying experience to customers. With our data well-managed, we could free up time for our developers to bring new web features to customers, like tailored add-ons at checkout.Our team of about 20 software engineers needed more flexibility and agility in our infrastructure; we were using various data processing tools, and it wasn’t easy to share data across teams so that everyone saw the same information. We also needed to incorporate streaming data into the data warehouse to ensure the consistency and integrity of data that’s read in a particular window of time from multiple sources. Our developer teams needed to be able to ship new features faster, and the data back ends were getting in the way.   In addition, when GDPR regulations went into effect, we needed to make sure all our data was anonymized, and we couldn’t do that with our legacy tools.Finding the right data tools for the jobTo make sure our customers were getting a top-notch online experience, we had to make the right technology choices. Our first step was to centralize multiple data sources and create a single data warehouse that could serve as the foundation for all of our reporting requirements, both internal and external. The new technology infrastructure we built had to let us move and analyze data easily, so our teams could focus on using that data and insights to better serve our customers. Previously, we had lots of siloed systems and applications running in AWS. We did a trial using Redshift, but we needed more flexibility than it offered in how we loaded historical data into our cloud data warehouse. Though we were using MongoDB Atlas for our transactional database, it was important to continue using SQL for querying data.  The trial task that really sold us on BigQuery was when we wanted to alter a small table that had about 20 million rows, used for internal reporting. We needed to add a value, but our PostgreSQL system wouldn’t allow it. Using Apache Beam, we set up a simple pipeline that moved data from the original source into BigQuery to see if we could add the column there. BigQuery ingested the data and let us add the new value in seconds. That was a significant moment that led us to start looking at how we could build end-to-end solutions on Google Cloud. BigQuery gave us multiple options to load our historical data in batches and build powerful pipelines. We also explored Google Cloud’s migration tools and data pipeline options. Once we saw how Cloud Dataflow worked, with its Apache Beam back-end, we never looked back. Google Cloud provided us with the data tools we needed to build our data infrastructure. Cloud for data, and for usersIntroducing new technologies isn’t always simple—companies sometimes avoid it altogether because it’s so hard. But our Google Cloud onboarding process has been easy. It took us less than two months to fully deploy our BigQuery data warehouse using the Cloud Dataflow-Apache Beam combination. Moving to Google Cloud brought us a lot of technology advantages, but it’s also been hugely helpful for our internal users and customers. The data analytics capabilities that we’re now able to offer users has really impressed our internal teams, including developers and DevOps, even those who haven’t used this type of technology before. Some internal clients are already entirely self-service. We’ve hosted frequent demos, and also hosted some “hack days,” where we share knowledge with our internal teams to show them what’s possible. We quickly found that BigQuery helped us solve scale and speed problems. One of our main pain points had been adding upsell opportunities for customers during the checkout process. The legacy technology hadn’t allowed us to quickly reflect those changes in the data warehouse. With BigQuery, we’re able to do that, and devote fewer resources to making it happen. We’ve also eliminated the time we were spending tuning memory and availability, since BigQuery handles that. Database administration and tuning required specialized knowledge and experience and took up time. With BigQuery, we don’t have to worry about configuring that hardware and software. It just works.Two features in particular that we implemented using BigQuery have helped us improve the performance of our core transactional database. First, using Cloud Dataflow to convert raw MongoDB logs to structured rows under a BigQuery table, which we can then query using SQL to identify slow or underperforming queries. Second, we can now query multiple logging tables using wildcards, since we load Fastly logs to BigQuery. Along with MongoDB Atlas as our main transactional database, much of our infrastructure now runs as Google Cloud microservices using Google Kubernetes Engine (GKE), including the home page and our payment system. Kubernetes cron jobs power background scheduled jobs, and we also use Cloud Pub/Sub. Cloud Storage handles any data storage if any space constraints emerge. Our overall performance has increased by about 10x with BigQuery. Both our customers and internal clients, like our sales and finance teams, benefit from the new low-latency reporting. Reports that used to be weekly or monthly are now available in near-real time. It’s not only faster to read records, but faster to move the data, too. We have Cloud Dataflow pipelines that write to multiple places, and the speed of moving and processing data is incredibly helpful. We stream in financial data using Cloud Dataflow in streaming mode, and plan to have different streaming pipelines as we grow. We have several batch pipelines that run every day. We can move terabytes of data without performance issues, and process more than 100,000 rows of data per second from the underlying database. It used to take us a month to move that volume of data into our data warehouse. With BigQuery, it takes two days.We’re also enjoying how easy and productive these tools are. They make our life as software engineers easier, so we can focus on the problem at hand, not fighting with our tools. What’s next for UniverseOur team will continue to push even more into Google Cloud’s data platform. We have plans to explore Cloud Datastore next. We’re also moving our databases to PostgreSQL on GCP, using Cloud Dataflow and Beam. BigQuery’s machine learning tools may also come into play as Universe’s cloud journey evolves, so we can start doing predictive analytics based on our data. We’re looking forward to gaining even more speed and agility to meet our business goals and customer needs.    Learn more here about Google Cloud, and more here about Universe.
Quelle: Google Cloud Platform

Modernize Apache Spark with Cloud Dataproc on Kubernetes

Google Cloud Dataproc provides open source data and analytic processing for data engineers and data scientists who need to process data and train models faster at scale. However, as enterprise infrastructure becomes increasingly hybrid in nature, machines can sit idle, single workload clusters continue to sprawl, and open source software and libraries continue to become outdated and incompatible with your stack. It’s critical that Cloud Dataproc continues to empower data professionals to focus more on workloads than infrastructure by combining the best of cloud and open source. We’re happy to announce alpha availability of Cloud Dataproc for Kubernetes so that we can continue to support this vision. With this announcement, we are bringing enterprise-grade support, management, and security to Apache Spark jobs running on GKE clusters. (Get all the technical details here.)“Enterprises are increasingly looking for products and services that support data processing across multiple locations and platforms,” said Matt Aslett, Research Vice President at 451 Research. “The launch of Cloud Dataproc on Kubernetes is significant in that it provides customers with a single control plane for deploying and managing Apache Spark jobs on Google Kubernetes Engine in both public cloud and on-premises environments.”This is the first step in a larger journey to a container-first world. While Apache Spark is the first open source processing engine we will bring to Cloud Dataproc on Kubernetes, it won’t be the last. Kubernetes has flipped the big data and machine learning open source software (OSS) world on its head, since it gives data scientists and data engineers a way to unify resource management, isolate jobs, and build resilient infrastructures across any environment. Deploy unified resource management With this alpha announcement, big data professionals are no longer obligated to deal with two separate cluster management interfaces to manage open source components running on Kubernetes and YARN. Using Cloud Dataproc’s new capabilities, you’ll get one central view that can span both cluster management systems. Supporting both YARN and Kubernetes can bring your enterprise the needed flexibility to modernize certain hybrid workloads while continuing to monitor YARN-based workloads. Isolate OSS jobs to accelerate the analytics life cycleContainerizing and isolating OSS jobs on Kubernetes will allow data professionals to move faster and remove the version and library dependencies associated with traditional big data technologies. You can move models and new ETL pipelines from dev to production without having to worry about compatibility. Building on a new agile infrastructure like Kubernetes will make OSS easier and faster to upgrade. Build resilient infrastructureDeploying Spark jobs on a self-healing GKE environment will help mission-critical ETL and machine learning jobs run smoothly. Data scientists and data engineers don’t have to worry about sizing and building clusters, manipulating Docker files, or messing around with Kubernetes networking configurations. It just works. With leading support from the team that built Kubernetes, enterprises have access to the skills they need to close any Kubernetes skills gap on their team. Open source has always been a core pillar of Google Cloud’s data and analytics strategy. As we continue to work with the community to set industry standards, we continue to integrate those standards into our services so organizations around the world can unlock the value of data faster. Moving Cloud Dataproc to Kubernetes involved changes to Cloud Dataproc and the open-source ecosystem that we run as a managed service. We will continue to work with other open source communities, like Apache Flink, to enable Cloud Dataproc on Kubernetes capabilities for more and more open source projects. This alpha announcement of bringing enterprise-grade support, management, and security to Apache Spark jobs on Kubernetes is the first of many as we aim to simplify infrastructure complexities for data scientists and data engineers around the world. Email us for more information and to join the alpha program. Also, be sure to check out the tech deep dive on this alpha.
Quelle: Google Cloud Platform

Alpha access to Cloud Dataproc Jobs on GKE

Cloud Dataproc is Google Cloud’s fully managed Apache Hadoop and Spark service. The mission of Cloud Dataproc has always been to make it simple and intuitive for developers and data scientists to apply their existing tools, algorithms, and programming languages to cloud-scale datasets. Its flexibility means you can continue to use the skills and techniques you are already using to explore data of any size. We hear from enterprises and SaaS companies around the world that they’re using Cloud Dataproc for data processing and analytics. Cloud Dataproc now offers alpha access to Spark jobs on Google Kubernetes Engine (GKE). (Find out more about the program here.) This means you can take advantage of the latest approaches in machine learning and big data analysis (Apache Spark and Google Cloud) together with the state-of-the-art cloud management capabilities that developers and data scientists have come to rely upon with Kubernetes and GKE. Using these tools together can bring you flexibility, auto-healing jobs, and a unified infrastructure, so you can focus on workloads, not maintaining infrastructure. Email us for more information and to join the alpha program. Let’s take a look at Cloud Dataproc in its current form and what the new GKE alpha offers. Cloud Dataproc now: Cloud-native Apache Spark Cloud Dataproc has democratized big data and analytics processing for thousands of customers, offering the ability to spin up a fully loaded and configured Apache Spark cluster in minutes. With Cloud Dataproc, features such as Component Gateway enable secure access to notebooks with zero setup or installation, letting you immediately start exploring data of any size. These notebooks, combined with Cloud Dataproc Autoscaling, make it possible to run ML training or process data of various sizes without ever having to leave your notebook or worry about how the job will get done. The underlying Cloud Dataproc cluster simply adjusts compute resources as needed, within predefined limits. Once your ML model or data engineering job is ready for production, or for use in an automated or recurring way, you can use the Cloud Dataproc Jobs API to submit a job to an existing Cloud Dataproc cluster with a jobs.submit call over HTTP, using the gcloud command-line tool, or in the Google Cloud Platform Console itself. Submitting your Spark code with the Jobs APIs ensures the jobs are logged and monitored, in addition to having them managed across the cluster. It also makes it easy to separate the permissions of who has access to submit jobs on a cluster and who has permissions to reach the cluster itself, without needing a gateway node or an application like Livy. Cloud Dataproc next: Extending the Jobs API with GKEThe Cloud Dataproc Jobs API has been a perfect match for companies who prefer to wrap their job automation and extract, transform, and load processing (ETL) jobs in custom tooling such as Spotify’s Spydra or Cloud Dataproc’s Workflow Templates. However, developers and data scientists who have embraced containerization and the cloud management capabilities of Kubernetes have started to demand more from their big data processing services. In order to automate your Spark job today, you would either need to continue running the cluster that created the job (expensive and does not take advantage of the pay-as-you-need capability of the cloud), or you need to carefully track how to re-create that same cluster environment in the cloud, which can become a complicated mixture of configurations, initialization scripts, conda environments, and library/package management scripts. This process can be additionally cumbersome in multi-tenant environments, where various software packages, configurations, and OS updates may conflict.  With Cloud Dataproc on Kubernetes, you can eliminate the need for multiple types of clusters that have various sets of software, and the complexity that’s involved. By extending the Cloud Dataproc Jobs API to GKE, you can package all the various dependencies of your job into a single Docker container. This Docker container allows you to integrate Spark jobs directly into the rest of your software development pipelines. Additionally, by extending the Cloud Dataproc Jobs API for GKE, administrators have a unified management system where they can tap into their Kubernetes knowledge. You can avoid having a silo of Spark applications that need to be managed in standalone virtual machines or in Apache Hadoop YARN.Kubernetes: Yet another resource negotiator? Apache Hadoop YARN (introduced in 2012) is a resource negotiator commonly found in Spark platforms across on-prem and cloud. YARN provides the core capabilities of scheduling computing resources in Cloud Dataproc clusters that are based on Compute Engine. By extending the Jobs API in Cloud Dataproc with GKE, you can choose to replace your YARN management with Kubernetes. There are some key advantages to using Kubernetes over YARN: 1. Flexibility.Greater flexibility of production jobs can be achieved by having a consistent configuration of software libraries embedded with the Spark code. Containerizing Spark jobs isolates dependencies and resources at the job level instead of the cluster level. This flexibility will give you more predictable workload cycles and make it easier to target your troubleshooting when something does go wrong.  2. Auto-healing. Kubernetes provides declarative configuration for your Spark jobs. This means that you can declare at the start of the job the resources required to process the job. If for some reason Kubernetes resources (i.e., executors) become unhealthy, Kubernetes will automatically restore them and your job will continue to run with the resources you declared at the onset.   3. Unified infrastructure.At Google, we have used a system called Borg to unify all of our processing, whether it’s a data analytics workload, web site, or anything else. Borg’s architecture served as the basis for Kubernetes, which you can use to remove the need for a big data (YARN) silo. By migrating Spark jobs to a single cluster manager, you can focus on modern cloud management in Kubernetes. At Google, having a single cluster manager system has led to more efficient use of resources and provided a unified logging and management framework. This same capability is now available to your organization. Kubernetes is not just “yet another resource negotiator” for big data processing. It’s an entirely new way of approaching big data that can greatly improve the reliability and management of your data and analytics workloads. Spark jobs on GKE in actionLet’s walk through what is involved with submitting an Apache Spark job to Cloud Dataproc on GKE during the alpha phase. Step 0: Register your GKE cluster with Cloud DataprocBefore you can execute Cloud Dataproc jobs on GKE, you must first register your GKE cluster with Cloud Dataproc. During alpha, the registration will be completed with a helm installation.  Once the GKE cluster is registered, you will be able to see your GKE cluster unified with the rest of your Cloud Dataproc clusters by running the command:Step 1: Define your Cloud Dataproc Docker containerCloud Dataproc offers Docker images that will match the bundle of software provided on theCloud Dataproc image version list. The alpha offering contains an image based on Debian 9 Stretch that mirrors the same Spark 2.4.3 package as Cloud Dataproc 1.4. This makes it seamless to port Spark code between Cloud Dataproc running on Compute Engine and Cloud Dataproc jobs on GKE. This Docker container encapsulates not only Cloud Dataproc’s agent for job management but also builds on top of Google Cloud’s Spark Operator for Kubernetes (in beta). This fully open source operator provides many of the integrations between Kubernetes and the rest of the Google Cloud Platform, including:Integration with BigQuery, Google’s serverless data warehouse Google Cloud Storage as a replacement for HDFSLogs shipped to Stackdriver MonitoringAccess to sparkctl, a command-line tool that simplifies client-local application dependencies in a Kubernetes environment.This Cloud Dataproc Docker container can be customized to include all the packages and configurations needed for your Spark job. Step 2: Submit your job Once the Docker container is ready, you can submit a Cloud Dataproc job to the GKE cluster. You can follow the same instructions that you would use for any Cloud Dataproc Spark job.Extending Cloud Dataproc with your own container Running the above job will mirror a software environment on Kubernetes to that found on Cloud Dataproc. However, with the GKE option, there is an extra benefit of being able to specify a container image associated with the job. This container property provides a reliable pairing of your job code and necessary software configurations.Starting your Cloud Dataproc on Kubernetes testingAt Google Cloud, we work with thousands of customers who have migrated production workloads to Kubernetes and reaped the benefits described in this post. However, it’s important to note that while Cloud Dataproc is a generally available service used to run a variety of mission-critical applications across enterprises, the Cloud Dataproc on GKE feature is in alpha and still under active development. Kubernetes support in the latest stable version of Spark is still considered an experimental feature. In future versions, there may be behavior changes around configuration, container images, and entry points. The Google Cloud Spark Operator that is core to this Cloud Dataproc offering is also a beta application and subject to the same stipulations. So far, we’ve been very impressed and excited by the preliminary adoption and new workloads customers have opened by running their Spark processing on Kubernetes. We’re looking forward to taking this journey to production together with our customers and invite you to join our alpha program.  Email us for more information and to join the alpha program.
Quelle: Google Cloud Platform

How to deploy a Windows container on Google Compute Engine

Last year, we published a blog post and demonstrated how to deploy a Windows container running Windows Server 2016 on Google Compute Engine. Since then, there have been a number of important developments. First, Microsoft announced the availability of Windows Server 2019. Second, Kubernetes 1.14 was released with support for Windows nodes and Windows containers.Supporting Windows workloads and helping you modernize your apps using containers and Kubernetes is one of our top priorities at Google Cloud. Soon after the Microsoft and Kubernetes announcements, we added support for Windows Server 2019 in Compute Engine and Windows containers in Google Kubernetes Engine (GKE). Given this expanded landscape for Windows containers on Google Cloud, let’s take a fresh look at how best to deploy and manage them. In this first post, we’ll show you how to deploy an app to a Windows container on Windows Server 2019 on Compute Engine. Then stay tuned for the next post, where we’ll deploy and manage the same Windows container via Kubernetes 1.14 on GKE. Let’s get started!Create a Windows Server instance on Compute EngineFirst, you need a Windows Server instance on which to run a Windows container. Compute Engine comes with many flavors of Windows Server (Server vs. Server Core), and many versions (2008 to 2019). There are also container-optimized versions that come with Docker and some base images already installed. For this exercise, let’s choose the latest container-optimized version of Windows Server. In Google Cloud console, create a VM with the Windows Server 2019 Datacenter for Containers image:Make sure that HTTP/HTTPS traffic is enabled:And also make sure to select “Allow full access to all Cloud APIs”:Allowing HTTP/HTTPs and Cloud API traffic will be useful later when we want to push/pull Docker images. Once the VM is up and running, you can set a Windows password and connect into it using Remote Desktop (RDP). Inside the VM, open a Command Prompt in Admin mode and type the following:As you can see, Docker is already installed and the Windows Server Core image for 2019 is already on the VM (“pulled,” in Docker-speak). We will use this as a base image for our Windows container app. Create a Windows container appFor the app inside the Windows container, let’s use an IIS Web Server. IIS has an image for Windows Server 2019. We could use the image as is and it will serve the default IIS page. But let’s do something more interesting and have IIS serve a page we define. Create a folder called my-windows-app with the following folder and file structure:Replace index.html with the following content:This is the page IIS will serve. Build a Docker imageNext, let’s create a Dockerfile for the Docker image. Notice that we’re using the IIS Container image version that is compatible with Windows Server 2019:Build the Docker image and tag it with Google Container Registry and your project id. This will be useful when we push the image to Container Registry later (replace dotnet-atamel with your project id):Once the Docker image is built, you will be able to see it along with its IIS dependency:Run your Windows containerWe’re now ready to run the Windows container. From inside the command prompt, run the container and expose it on port 80:You can check that the container is running:To see the web page, go to the External IP column of the Compute Engine instance and simply open it with HTTP in the browser:We’re now running an IIS site inside a Windows container! If you want to try out these steps on your own, we also published a codelab on this topic:Note that this setup is not ideal for production. It does not survive server restarts or crashes. In a production system, you’ll want a static IP for your VM and create a startup script to start the container. This will take care of server restarts but doesn’t help so much for server crashes. To make the app resilient against server crashes, you can run the container inside a pod managed by Kubernetes. The process for doing this will be the topic of our next blog post.
Quelle: Google Cloud Platform

Working with Qubole to tackle the challenges of machine learning at an enterprise scale

With virtually unlimited storage and compute resources, the cloud has emerged as the prime location for enterprises doing large-scale big data and machine learning projects. Enterprises need ever more sophisticated technology to quickly innovate with data projects in the cloud, without compromising ease of use, scale, and security. At Google Cloud, we’re building cloud infrastructure that’s flexible and open-source-centric to meet customer needs.Our partners are essential to our mission of helping customers grow their tech capabilities and their businesses. Qubole, a recently announced Google Cloud Platform (GCP) partner, offers an integrated cloud-native data analytics platform. Qubole provides GCP users with a unified, self-service platform where data scientists and data engineers can collaborate using familiar tools and languages, as well as performance-optimized versions of open source data processing engines. The Qubole data platform provides a range of optimized open-source engines, including Apache Spark, TensorFlow, Presto, Airflow, Hadoop, Hive, and more. With Qubole, you can combine and analyze data from BigQuery and data lakes on Cloud Storage super quickly.Building modern machine learning modelsWe’ve heard great stories from customers using the Qubole platform for powerful analytics, including Recursion Pharmaceuticals, True Fit, and AgilOne, which provides a customer data platform for its enterprise users. They support real-time use cases and large volumes of data. To do that, AgilOne operates complex machine learning (ML) models and stores vast quantities of data using Qubole and GCP for its 150-plus customers, including lululemon, Travelzoo, and TUMI. AgilOne Cortex is a machine learning framework that uses supervised machine learning models to predict customer events such as purchase, subscription, and engagement. It segments customers together based on interest and behavior using unsupervised learning techniques. AgilOne Cortex’s recommender system models lets customers orchestrate offers and messages to customers on a one-on-one basis. AgilOne uses cloud platforms to perform close to one billion predictions every day, averaging dozens of millions of customer predictions for each client across all its models.In order to meet the challenges of such vast amounts of data and millions of predictions , AgilOne chose Qubole and GCP to better automate the provision of machine learning data-processing resources based on workload, while allowing for portability across cloud providers; eliminating prototyping bottlenecks; supporting the seamless orchestration of jobs; and automating cluster management.AgilOne now runs a variety of workloads for querying data, running ML models, orchestrating ML workflows, and more on Qubole—all on a single platform with optimized versions of Apache Spark, Apache Airflow, Zeppelin Notebooks, and leveraging Qubole’s APIs to automate tasks. Using GCP and Qubole, AgilOne has seen some key benefits:Elimination of critical bottlenecks through intelligent, autonomous and self-service provisioning of compute resources for the data science models.Increased efficiency for AgilOne’s machine learning and ops teams.Improved prototyping and efficient movement of ML models into production.Simplified and reduced time to production, transitioning to GCP through a consistent user experience, tools, and technologies.Efficient orchestration of machine-learning model lifecycle through Airflow.Automated tasks end-to-end with Qubole APIs.Improved customer support and added zero-downtime upgrades and roll-back capabilities.AgilOne also uses Google Cloud Storage for its real-time data store of its customers’ transaction and event data. This repository of cleansed, deduped, and enriched data serves as the master customer record for all reporting, analyses, machine learning models, and advanced segmentation.Limiting bottlenecks, simplifying cluster managementUsing Qubole and GCP, AgilOne’s data science team can make cluster management and cluster provisioning more self-service, smarter, and less dependent on operations teams. They’re now able to make delivery of ML models more agile. AgilOne data teams now rely less on the operations team, since infrastructure is provisioned automatically through Qubole. Qubole on GCP means that it’s now easier to provision new and larger clusters with different sets of permissions, install dependencies on VMs, maintain stable prototyping environments, and upgrade software. The data science team’s variable infrastructure needs are now addressed with intelligent automation—spinning up and releasing clusters and different types of nodes as needed. In Qubole’s managed Zeppelin environement, AgilOne can prototype its Python/Pyspark/Scala applications. The comprehensive quality assurance and support, zero-downtime software upgrades, and rollback capabilities help to add stability for AgilOne’s ML operations. Eliminating bottlenecks has let the company build and test new models at lightning speed. This translates to a much faster go-to-market and onboarding of new clients.Finding improved executionAgilOne Cortex requires a powerful orchestration system to run and monitor dozens of models for all clients, and to run each model across all users every day. Since Qubole and GCP bring open source options, AgilOne’s data science team can use configuration-as-code workflow engine Airflow. This has allowed AgilOne to better manage the lifecycle of its ML workflows by providing easy maintenance, versioning, and testing. Qubole also provides customers like AgilOne a comprehensive set of APIs critical for end-to-end automation. This includes automating such tasks as starting and stopping clusters, submitting a Spark job or changing the Spark configuration, generating reports, increasing the timeout, and more.Looking ahead with cloudAs its business continues to rapidly expand, the need for more data insights and more models increases. AgilOne will look to use Qubole and GCP for running ad-hoc queries for data discovery, exploration, and analyses. From a cluster-management perspective, AgilOne wants to further use Qubole’s intelligent management of Google’s Preemptible VMs and heterogeneous cluster management capabilities to lower its ML processing costs without compromising reliability. Learn more about AgilOne on Qubole and GCP and about AgilOne’s technology.
Quelle: Google Cloud Platform

Exploring container security: Bringing Shielded VMs to GKE with Shielded GKE Nodes

Where workloads go, attackers follow. As more organizations adopt containers and deploy sensitive workloads with Kubernetes, there are new container-specific surface areas that need to be hardened. Today, we are announcing Shielded GKE Nodes in beta, which provides strong, verifiable node identity and integrity to increase the protection of your Google Kubernetes Engine (GKE) nodes. A compromised Kubernetes node gives malicious actors a wide range of opportunities for attack. For example, one potential attack on a Kubernetes node can give adversaries the opportunity to gain (persistent) access to valuable user code, compute and/or data. This isn’t just a theoretical risk—a security researcher exploited it last year. In this case, by exploiting how credentials are bootstrapped for a worker node, the researcher got full access to the cluster. Shielded GKE Nodes protects against a variety of attacks by hardening the underlying GKE node against rootkits and bootkits. More specifically, Shielded GKE Nodes provides:Node OS provenance check: A cryptographically verifiable check to make sure the node OS is running on a virtual machine in a Google data centerEnhanced rootkit and bootkit protection: Protection against advanced rootkits and bootkits in the node by leveraging advanced platform security capabilities such as secure and measured boot, virtual trusted platform module (vTPM), UEFI firmware, and integrity monitoringStandards-based security: Built on the Trusted Computing Group’s (TCG) Trusted Platform Module (TPM), Shielded GKE Nodes uses a standardized specification for trusted computing, such as verifying the boot integrity of the node and enhancing the node bootstrapping processShopify offers an ecommerce platform that allows merchants to process payments online, in person, or through social media apps, and is a strong proponent of Shielded GKE Nodes. With  50 GKE clusters in multiple regions running 10,000 Kubernetes services, Shielded GKE Nodes gives them extra security, with less overhead. “Shopify’s thousands of nodes must each run a proxy to prevent metadata servers from divulging kubelet bootstrap credentials, which are required for a node to join a cluster but shouldn’t be needed after that. We’re excited to migrate to Shielded GKE Nodes, which can only use those credentials in conjunction with a secure vTPM-based method to establish trust with the cluster,” said Shane Lawrence, Security Infrastructure Engineer at Shopify. “The change allows us to turn off the proxies to save resources, and limiting the capabilities of the bootstrap credentials eliminates an attack vector, so our platform is even more secure.”Image and region availabilityShielded GKE Nodes is built on top of Google Compute Engine Shielded VM, which provides verifiable integrity and data exfiltration protection for virtual machines (VMs). Just like Shielded VM, GKE customers can use Shielded GKE Nodes at no extra charge. Shielded GKE Nodes is available in all regions, for both Ubuntu and Container Optimized OS (COS) node images running GKE v1.13.6 and later versions. Getting startedTo use Shielded GKE Nodes, when creating the new cluster, specify the –enable-shielded-nodes flag:To use Shielded GKE Nodes, you need a minimum cluster version of 1.13.6-gke.0, which can be specified via –cluster-version or –release-channel flags. Alternatively, you can specify –cluster-version=latest. To migrate an existing cluster, upgrade your cluster to at least the minimum version, and specify the –enable-shielded-nodes flag on a cluster update command:For further details, see the [documentation].Start running Shielded GKE NodesIf you run production applications, you want as much protection as possible. Shielded GKE Nodes provides you with the benefits of UEFI firmware, secure boot, and vTPM in a hardened Kubernetes environment. Improve your security posture— try Shielded GKE Nodes today.
Quelle: Google Cloud Platform