Postponing Google Cloud Next ’20: Digital Connect

Google Cloud has decided to postpone Google Cloud Next ‘20: Digital Connect out of concern for the health and safety of our customers, partners, employees and local communities, and based on recent decisions made by the federal and local governments regarding the coronavirus (COVID-19). Right now, the most important thing we can do is focus our attention on supporting our customers, partners, and each other.Please know that we are fully committed to bringing Google Cloud Next ‘20: Digital Connect to life, but will hold the event when the timing is right. We will share the new date when we have a better sense of the evolving situation. At Google, leading with innovation and helpfulness is core to our mission. We’ll continue to do everything we can to help our communities stay safe, informed, and connected.
Quelle: Google Cloud Platform

Finding a problem at the bottom of the Google stack

At Google, our teams follow site reliability engineering (SRE) practices to help keep systems healthy and users productive. There is a phrase we often use on our SRE teams: “At Google scale, million-to-one chances happen all the time.” This illustrates the massive complexity of the system that powers Google Search, Gmail, Ads, Cloud, Android, Maps, and many more. That type of scale creates complex, emergent modes of failure that aren’t seen elsewhere. Thus, SREs within Google have become adept at developing systems to track failures deep into the many layers of our infrastructure. Not every failure can be automatically detected, so investigative tools, techniques, and most importantly, attitude are essential. Rare, unexpected chains of events happen often. Some have visible impact, but most don’t.At Google scale, million-to-one chances happen all the time.This was illustrated in a recent incident that Google users would likely not have noticed. We consider these types of failures “within error budget” events. They are expected, accepted, and engineered into the design criteria of our systems. However, they still get tracked down to make sure they aren’t forgotten and accumulated into technical debt—we use them to prevent this class of failures across a range of systems, not just the one that had the problem. This incident serves as a good example of tracking down a problem once initial symptoms were mitigated, finding underlying causes and preventing it from happening again—without users noticing. This level of rigor and responsibility is what underlies the SRE approach to running systems in production. Digging deep for a problem’s rootsIn this event, an SRE on the traffic and load balancing team was alerted that some GFEs (Google front ends) in Google’s edge network, which statelessly cache frequently accessed content, were producing an abnormally high number of errors. The on-call SRE was paged. He immediately removed (“drained”) the machines from serving, thus eliminating the errors that might result in a degraded state for customers. This ability to rapidly mitigate an incident in this way is a core competency within Google SRE. Because we have confidence in our capacity models, we know that we have redundant resources to allow for this mitigation at any time.At this point, our SRE had mitigated the issue with the drain, but he wasn’t done yet. Based on previous similar issues, he knew this type of error is often caused by a transient network issue. After finding evidence of packet loss, isolated to a single rack of machines, our SRE got in touch with the edge networking team, which identified correlated BGP flapping on the router in the affected rack. However, the nature of the flaps hinted at a problem with the machines rather than the router. This indicated that the problem revolved around a particular machine or set of machines.Further investigation uncovered kernel messages in the GFE machines’ base system log. These errors indicated CPU throttling:MMM DD HH:mm:ss xxxxxxx kernel: [3220998.149713] CPU16: Package temperature above threshold, cpu clock throttled (total events = 1596886)The process on the machine responsible for BGP announcements showed higher-than-usual CPU usage, which perfectly correlated with both the onset of the errors and the CPU throttling. This confirmed the theory that the throttling was significant enough to be impactful and measurable by Google’s monitoring system:The SRE then checked on adjacent machines to find if there were any other similarly failing systems. Notably, the only machines that were affected were on a single rack. Machines on adjacent racks were not affected!Why would a single rack be overheating to the point of CPU throttling when its neighbors were totally unaffected?? What is it about the physical support for machines that would cause kernel errors? It didn’t add up.The SRE then sent the machine to repairs, which means that he filed a bug in our company-wide issue tracking system. In this case, the bug was sent to the on-site hardware operations and management team.This bug was clear and to the point:Please repair the following:Machines in XXXXXX are seeing thermal events in syslog:MMM DD HH:mm:ss xxxxxxx kernel: [3220998.149713] CPU16: Package temperature above threshold, cpu clock throttled (total events = 1596886)This throttling is ultimately causing user harm, so I’ve drained user traffic.This bug, or ticket, clearly specified the machine(s) that were affected and described the symptoms and actions taken up to that point. At this point, the hardware team took over the investigation and determined the physical issue that resulted in this chain of events in the software. Google’s 24×7 team is composed of many teams, working together to ensure problems are well-understood at all levels of the stack.Finding the cause of a chain of eventsSo what was the problem?Hello, we have inspected the rack. The casters on the rear wheels have failed and the machines are overheating as a consequence of being tilted.Problem solved? Not quite. This looks alarmingly like a refrigerator about to tip over.The wheels (casters) supporting the rack had been crushed under the weight of the fully loaded rack. The rack then had physically tilted forward, disrupting the flow of liquid coolant and resulting in some CPUs heating up to the point of being throttled.The caster got fixed and the rack was returned to proper alignment. But the greater issues of “How did this happen?” and “How can we prevent it?” needed to be addressed.The hardware teams discussed potential options, ranging from distributing wheel repair kits to all locations to improving the rack-moving procedures to avoid damaging the wheels, and even considered improving the method of transporting new racks to data centers during initial build-out.The team also considered how many existing racks risk similar failures. This then resulted in a systematic replacement of all racks with the same issue, while avoiding any customer impact.Talk about deep analysis! The SRE tracked the problem all the way from an external, front-end system down to the hardware that holds up the machines. This type of deep troubleshooting happens within Google’s production teams due to clear communication, shared goals, and a common expectation to not only fix problems, but prevent all future occurrences.  Another phrase we commonly use here on SRE teams is “All incidents should be novel”—they should never occur more than once. In this case, the SREs and hardware operation teams worked together to ensure that this class of failure would never happen again.All incidents should be novel.This level of rigorous analysis and persistence is a great example of incident response using deep and broad monitoring and the culture of responsibility that keeps Google running 24×7. Google Cloud customers often ask how SRE can work in a hybrid, on-prem, or multi-cloud environment. SRE practices can be used to work across teams within an organization, across multiple environments. SRE helps teams work together during incidents like this, from traffic management to data center hardware operations.  Find out more about the SRE approach to running systems and how your team can adopt SRE best practices.
Quelle: Google Cloud Platform

How EBSCO delivers dynamic research services with Apigee

Editor’s note: Today we hear from Adam Ray, platform product manager at EBSCO Information Services, a leading provider of research databases, e-journals, magazines, and eBooks. Learn how the company is working with Apigee to connect with customers through APIs.For more than 70 years, EBSCO has supported research at private and public institutions, including libraries, universities, hospitals, and government organizations. One of the reasons that customers have continued to rely upon us over the decades is because we actively innovate and adapt new technologies to give customers access to the growing pool of digital resources in the information age.Today we offer many product lines, including research databases, e-journals, magazines, eBooks, and other resources, to connect organizations with the right services for their research needs. Product teams typically created different API solutions upon request to improve customers’ experiences. For instance, customers might request APIs to help customize user interfaces or to deliver multiple EBSCO resources and assets to their users in a unified way.As the number of solutions using APIs at EBSCO grew, it started getting harder to control traffic and performance in our data center. We didn’t have a good way to regulate API calls, so heavy usage could cause dramatic spikes in traffic and degrade performance. As we expect the number of APIs and calls to grow in the future, we needed to find a better way to manage, secure, and even monetize APIs to maintain a high level of performance for customers.Working with a market leaderAlthough we have a lot of technical skill in-house, we wanted to get out of the business of building things for ourselves so that we could focus our resources on polishing and expanding core services. That’s why we decided to look at API management solutions that had all of the capabilities we wanted built in, such as a developer portal, monetization features, diverse policies, and analytics that would help us better understand our customers and how they’re using our APIs.We started by looking at the Gartner Magic Quadrant for Full Life Cycle API Management to learn more about API market leaders. We talked to all of the top vendors, read literature, and explored how the top solutions worked. The Apigee API Management Platform stood out for both its functionality and flexibility. While many competitors wanted to define the service hosting platform for us, we already have a strong digital ecosystem built around service meshes. Apigee was the only option flexible enough to work alongside our existing systems and architecture.As we worked more with Apigee, we also discovered that the team there has extensive experience with APIs, and they were eager to share their knowledge. They held workshops and even had “office hours” where they would sit down and answer all of our questions. If we weren’t sure about the best way to solve an issue, the Apigee team was always ready with best practices and insights to help us make the best choice.Advanced functionality out of the boxWe are already impressed by how easy it is to get started with the Apigee platform. Turnkey policies and built-in security standards help us evaluate traffic and minimize spikes that could overload our systems. Apigee has a wide range of features that work straight out of the box, so we don’t have to spend time building a developer portal, enforcing policies, or figuring out how to integrate all of the different components. Instead, internal teams can focus on adding APIs and planning new features for our customers.The developer portal is currently open to just a few existing customers, but we expect it to be an essential component of expanding our API program. The developer portal will give partners, vendors, customers, and other developers a single location to find a comprehensive list of API-related documentation. They can easily learn what APIs are available and how to use them to integrate services, adjust interfaces, or support other needed processes.A solid foundation for growthEach of our lines of business plans to expose two to four APIs for a total of 15 APIs on our roadmap. Once we have released the APIs and opened up our developer portal, we can start looking at opportunities for adding revenue streams through monetization. Because our central business model involves subscriptions and billing, we have payment infrastructure in place. But the Apigee monetization capabilities will enable us to set up payment for developers who aren’t currently EBSCO customers. We can create a system for developers to sign up through the developer portal and start paying for any API package that they want to use.Technology changes rapidly, and our customers constantly adopt new devices and platforms. With Apigee helping us to create and manage more APIs, we have a fast, easy way to connect with all sorts of customer touchpoints and provide excellent support now and in the future.
Quelle: Google Cloud Platform

Local SSDs + VMs = love at first (tera)byte

Data storage is the foundation for all kinds of enterprises and their workloads. For most of those, our Google Cloud standard object, block, and file storage products offer the necessary performance. But for companies doing compute-intensive work like analytics for ecommerce websites, or gaming and visual effects rendering, compute performance can have a big impact on the bottom line. A slow website experience, or slow processing causing missed deadlines, just can’t happen. To make sure your workloads are set up for performance and latency, the first place to start is your storage. For the fastest storage available, that’s local solid state drives, or Local SSDs. With that in mind, we’re announcing that you can now attach 6TB and 9TB Local SSDs to your Compute Engine virtual machines. The throughput and IOPS (per VM) of these new offerings will be up to 3.5 times our current 3TB offering. This means fewer instances will be needed to meet your performance goals, which frequently leads to reduced costs. If you’re already using Local SSDs, you can access these larger sizes with the same APIs you use today. How Local SSDs workLocal SSDs are high-performance devices that are physically attached to the server that hosts your VM instances. This physical coupling translates to the lowest latency and highest throughput to the VM. These local disks are always encrypted, not replicated, and used as temporary block storage. Local SSDs are typically used as high-performance scratch disks, cache, or the high I/O hot tier in distributed data stores and analytics stacks. A common use case for local SSDs is in flash-optimized databases that have distribution and replication built into the layers above storage. For apps like real-time fraud detection or ad exchanges, only local SSDs can bring the necessary sub-millisecond latencies combined with very high input/output operations per second (IOPS).Another common use for Local SSDs is as a hot storage tier (typically for caching and indexing) as part of tiered storage in performance-sensitive analytics stacks. For example, Google Cloud customer Mixpanel caches hundreds of terabytes of data on local SSDs onCompute Engine to maintain sub-second query speeds for their data analytics platform.When using larger, faster Local SSDs, performance is the goal. The new SSDs we’re announcing combine enhanced performance with unique attach-flexibility, translating to a highly compelling price per IOPS and price per throughput for locally attached storage. These new SSDs bring you new capabilities and can help reduce the total cost of ownership (TCO) for distributed workloads. For example, a SaaS provider doing real-time analytics on a flash-optimized database cluster can now see better performance and TCO benefits. And highly transactional, performance-sensitive workloads like analytics or media rendering can now transact millions of IOPS on a wide variety of VMs.Here’s a look at how to attach a 9TB Local SSD with a Compute Engine instance.We hear that users like the flexibility of Local SSDs, like the ability to attach them with a wide range of custom VM shapes (rather than being tied to specific VM shape per SSD size), and this extends to the new 6TB and 9TB Local SSDs as well. Both the 6TB and 9TB instances will retain the current per-GB pricing. Visit our pricing page to see the specific pricing in your region. 6TB and 9TB Local SSDs can be attached on N1 VMs (now in beta). This capability will be available on N2 VMs shortly. For more details, check out our documentation for Local SSDs. If you have questions or feedback, check out the Getting Help page.
Quelle: Google Cloud Platform

Modern analytics made easy with new Redshift, S3 migration tools

Editor’s note: This blog takes a closer look at some of the recently announced BigQuery product innovations and deepened partnerships that are helping enterprises fast-track their migration to BigQuery.In the past 40 years, the data warehouse has gone through many transformations, driven by business needs and fueled by technological advancements. Data warehouses have transformed from operational reporting and ad-hoc reporting to today’s real-time, predictive analytics. But growing advanced analytics needs, and the need for reduced operational expenses, mean these legacy data warehouses are no longer a long-term solution. We hear from customers around the globe that they’re migrating to Google Cloud to overcome their IT hurdles and quickly modernize their analytics strategy.Organizations are unlocking faster, actionable insights by migrating to BigQuery, Google’s cloud-native, enterprise data warehouse. We’re also streamlining customer migrations to BigQuery with the recently announced general availability of our Redshift and S3 migration tools.Financial services company KeyBank is taking advantage of these tools. “We are modernizing our data analytics strategy by migrating from an on-premises data warehouse to Google’s cloud-native data warehouse, BigQuery,” says Michael Onders, chief data officer at KeyBank. “This transformation will help us scale our compute and storage needs seamlessly and lower our overall total cost of ownership. Google Cloud’s smart analytics platform will give us access to a broad ecosystem of data transformation tools and advanced machine learning tools so that we can easily generate predictive insights and unlock new findings from our data.” With the recently announced general availability of the Redshift to BigQuery and S3 to BigQuery migration services, you can now easily move data from these legacy environments right into BigQuery. Redshift and S3 migration services join the Teradata service that’s already available. VPC support is included in the Redshift migration service. In addition, general availability of the DTS-based S3 Loader allows you to move data from S3 seamlessly to Google Cloud.  Better together with partnersAt Google Cloud, we are also collaborating with tech partners to expedite data warehouse migrations. Our tech partners can help you migrate without having to rewrite queries. You can find the partner that’s right for your migration and decide whether to convert incoming requests into BigQuery dialect on the fly or just once. In addition to these tech partners, we have partnered with system integrators that have supported many customers in their migration journeys. Close ties and deep investments in our partner ecosystem have helped us deliver the foundational support needed for organizations to fast-track their migration journeys. Wipro, Infosys, Accenture, and other system integrators have built end-to-end migration programs. We’ve built three main pillars in our system integrator partnerships:  Strategic alignment: Our systems integrators have dedicated teams committed to define and execute against a joint business plan with Google Cloud. Expertise: Global system integrators (GSIs) have built dedicated Google Cloud practices with Centers of Excellence around data and analytics with certified Google Cloud resources, and expertise in building accelerators for Google Cloud-native solution architectures across many use cases. Examples include the Accenture Data Studio for Google Cloud, Infosys Migration Workbench (MWB), Wipro’s GCP Data and Insights Migration Studio, and other accelerators across our GSI ecosystem. Each of them brings unique strengths and capabilities and the ability to deliver globally.Delivery: GSI partner solutions are validated for alignment with our solution plays and technology partners we recommend. We’ve heard from one of our key systems integrators, Wipro Limited, about their clients’ use of Google Cloud to simplify data warehouse migrations and get started easily with advanced analytics and other features.“Wipro partners with its clients to transform them into intelligent enterprises,” says Jayant Prabhu, Vice President and Global Head, Data, Analytics and AI. “BigQuery enables our customers to jump-start their modern analytics journey while lowering their total cost of ownership (TCO). BigQuery’s ability to scale seamlessly and simplify machine learning allows us to implement new intelligent analytics solutions for smarter decision making. Furthermore, these benefits come with zero operational overhead, thus helping us focus on making enterprises intelligent.”Our continued investment in capabilities that help streamline data warehouse migrations to BigQuery is helping enterprises quickly unlock IT innovation. Get started on your modernization journey with our data warehouse migration offer to get funding support along with expert design guidance, tools, and partner solutions to expedite your cloud migration. Learn more about Redshift to BigQuery migration service Learn more about DTS-based S3 LoaderLearn more about Teradata to BigQuery Migration service
Quelle: Google Cloud Platform

Use SRE principles to monitor pipelines with Cloud Monitoring dashboards

Data pipelines provide the ability to operate on streams of real-time data and process large data volumes. Monitoring data pipelines can present a challenge because many of the important metrics are unique. For example, with data pipelines, you need to understand the throughput of the pipeline, how long it takes data to flow through it and whether your data pipeline is resource-constrained. These considerations are essential to keeping your cloud infrastructure up and running—and staying ahead of business needs.Monitoring complex systems that include real-time data is an important part of smooth operations management. There are some tips and tricks you can use to measure your systems and spot potential problems. Luckily, we have excellent guidance from the Google site reliability engineering (SRE) team via Chapter 6 of the Monitoring Distributed Systems book. You’ll find details about the Four Golden Signals, recommended as you’re planning how and what to monitor in your system. The Four Golden Signals are:Latency—The time it takes for your service to fulfill a requestTraffic—How much demand is directed at your serviceErrors—The rate at which your service failsSaturation—A measure of how close to fully utilized the service’s resources areYou can use these monitoring categories when considering what to monitor in your system or in a specific data processing pipeline. Cloud Monitoring (previously known as Stackdriver) provides an integrated set of metrics that are automatically collected for Google Cloud services. Using Cloud Monitoring, you can build dashboards to visualize the metrics for your data pipelines. Additionally, some services, including Dataflow, Kubernetes Engine and Compute Engine, have metrics that are surfaced directly in their respective UIs as well as in the Monitoring UI. Here, we’ll describe the metrics needed to build a Cloud Monitoring dashboard for a sample data pipeline.Choosing metrics to monitor a data processing pipelineConsider this sample event-driven data pipeline based on Pub/Sub events, a Dataflow pipeline, and BigQuery as the final destination for the data.You can generalize this pipeline to the following steps:Send metric data to a Pub/Sub topicReceive data from a Pub/Sub subscription in a Dataflow streaming jobWrite the results to BigQuery for analytics and Cloud Storage for archivalCloud Monitoring provides powerful logging and diagnostics for Dataflow jobs in two places: in the Job Details page of Dataflow, and in the Cloud Monitoring UI itself. Dataflow integration with Cloud Monitoring lets you access Dataflow job metrics such as job status, element counts, system lag (for streaming jobs), and user counters directly in the Job Details page of Dataflow (we call this integration observability-in-context, because metrics are displayed and observed in the context of the job that generates them).If your task is to monitor a Dataflow job, the metrics surfaced in the Job Details page of Dataflow itself should provide great coverage. If you need to monitor other components in the architecture, you can combine the Dataflow metrics with metrics from the other services such as BigQuery and Pub/Sub on a dashboard within Cloud Monitoring. Since Monitoring also surfaces the same Dataflow metrics in the Cloud Monitoring UI, you can use the metrics to build dashboards for the data pipeline by applying the “Four Golden Signals” monitoring framework. For the purposes of monitoring, you can treat the entire pipeline as the “service” to be monitored. Here, we’ll look at each of the Golden Signals:LatencyLatency represents how long it takes to service a request over a given time. A common way to measure latency is time required to service a request in seconds. In the sample architecture we’re using, the metric that may be useful to understand latency is how long data takes to go through Dataflow or the individual steps in the Dataflow pipeline. System lag chartUsing the metrics related to processing time and lag area is a reasonable choice, since they represent the amount of time that it takes to service requests. The job/data_watermark_age, which represents the age (time since event timestamp) of the most recent item of data that has been fully processed by the pipeline and the job/system_lag, which represents the current maximum duration that an item of data has been awaiting processing, in seconds, align well with measuring the time taken to be processed through the Dataflow pipeline, as shown here:TrafficGenerally, traffic represents how many user requests are being received over a given time. A common way to measure traffic is requests/second. In the sample data pipeline, there are three main services that can provide insight into the traffic being received. In this example, you’ll see we built three different charts for the three technologies in the data processing pipeline architecture (Pub/Sub, Dataflow, and BigQuery) to make it easier to read, because the Y axis scales are orders of magnitude different for each metric. You can include them on a single chart for simplicity.Dataflow traffic chartCloud Monitoring provides many different metrics for Cloud Dataflow, which you can find in the metrics documentation. The metrics are categorized into overall Dataflow job metrics like job/status or job/total_vcpu_time and processing metrics like job/element_count and job/estimated_byte_count.In order to monitor the traffic through Dataflow, the job/element_count, which represents the number of elements added to the pcollection so far, aligns well with measuring the amount of traffic. Importantly, the metric will increase with an increase in the volume of traffic. So it’s a reasonable metric to use to understand the traffic coming into a pipeline.Pub/Sub traffic chartCloud Monitoring metrics for Pub/Sub are categorized into topic, subscription, and snapshot metrics. Using the metrics for the inbound topics that receive the data is a reasonable choice, since the metrics represent the amount of incoming traffic. The topic/send_request_count, which represents the cumulative count of publish requests, grouped by result, aligns well with measuring the amount of traffic, as shown here:BigQuery traffic chartCloud Monitoring metrics for BigQuery are categorized into bigquery_project, bigquery_dataset, and query metrics. The metrics related to uploaded data are a reasonable choice, since the metrics represent the amount of incoming traffic. The storage/uploaded_bytes aligns well with measuring incoming traffic to BigQuery, like this:ErrorsErrors represent application errors, infrastructure errors, or failure rates. You may want to monitor for an increased error rate to understand whether errors reported in the logs for the pipeline may be related to saturation or other error conditions.Data processing pipeline errors chartCloud Monitoring provides metrics that report the errors that are reported in the logs for the services. You can filter the metrics to limit them to the specific services that you are using. Specifically, you can monitor the number of errors and the error rate. The log_entry_count, which represents the number of log entries for each of the three services, aligns well with measuring the increases in the number of errors, as shown in this chart:SaturationSaturation represents how utilized the resources are that run your service. You want to monitor saturation to know when the system may become resource-constrained. In this sample pipeline, the metrics that may be useful to understand saturation are the oldest unacknowledged messages (if processing slows down, then the messages will remain in Pub/Sub longer); and in Dataflow, the watermark age of the data (if processing slows down, then messages will take longer to get through the pipeline).Saturation chartIf a system becomes saturated, the time to process a given message will decrease as the system approaches fully utilizing its resources. The metrics job/data_watermark_age, which we used above, and the topic/oldest_unacked_message_age_by_region, which represents age (in seconds) of the oldest unacknowledged message in a topic, align well with measuring the increases in Dataflow processing time and time for the pipeline to receive/acknowledge input messages from Pub/Sub, like so:Building the dashboardPutting all these different charts together in a single dashboard provides a single view for the data processing pipeline metrics, like this:You can easily build this dashboard with these six charts by hand in the Dashboards section of the Cloud Monitoring console using the metrics described above. Building the dashboards for multiple different Workspaces such as DEV, QA, and PROD means a lot of repeated manual work, which the SRE team calls toil. A better approach is to use a dashboard template and create the dashboard programmatically. You can also try the Stackdriver Cloud Monitoring Dashboards APIto deploy the sample dashboard from a template. Learn more about SRE and CREFor more about SRE, learn about the fundamentals or explore the full SRE book. Read about real-world experiences from our Customer Reliability Engineers (CRE) by reading our CRE Life Lessons blog series.
Quelle: Google Cloud Platform

Introducing Cloud AI Platform Pipelines

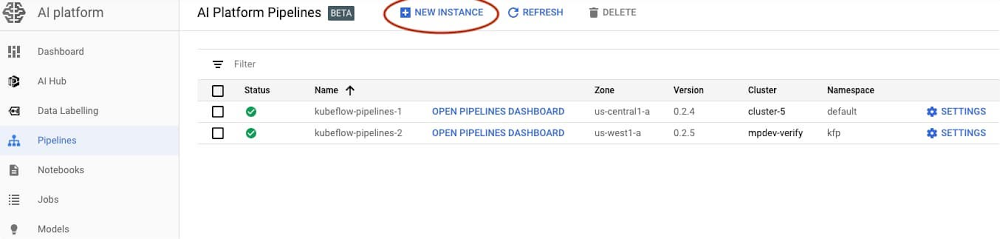
When you’re just prototyping a machine learning (ML) model in a notebook, it can seem fairly straightforward. But when you need to start paying attention to the other pieces required to make a ML workflow sustainable and scalable, things become more complex. A machine learning workflow can involve many steps with dependencies on each other, from data preparation and analysis, to training, to evaluation, to deployment, and more. It’s hard to compose and track these processes in an ad-hoc manner—for example, in a set of notebooks or scripts—and things like auditing and reproducibility become increasingly problematic.Today, we’re announcing the beta launch of Cloud AI Platform Pipelines. Cloud AI Platform Pipelines provides a way to deploy robust, repeatable machine learning pipelines along with monitoring, auditing, version tracking, and reproducibility, and delivers an enterprise-ready, easy to install, secure execution environment for your ML workflows.AI Platform Pipelines gives you:Push-button installation via the Google Cloud ConsoleEnterprise features for running ML workloads, including pipeline versioning, automatic metadata tracking of artifacts and executions, Cloud Logging, visualization tools, and more Seamless integration with Google Cloud managed services like BigQuery, Dataflow, AI Platform Training and Serving, Cloud Functions, and many others Many prebuilt pipeline components (pipeline steps) for ML workflows, with easy construction of your own custom componentsAI Platform Pipelines has two major parts—the enterprise-ready infrastructure for deploying and running structured ML workflows that are integrated with GCP services; and the pipeline tools for building, debugging, and sharing pipelines and components. In this post, we’ll highlight the features and benefits of using AI Platform Pipelines to host your ML workflows, show its tech stack, and then describe some of its new features. Benefits of using AI Platform PipelinesEasy installation and managementYou access AI Platform Pipelines by visiting the AI Platform panel in the Cloud Console.The installation process is lightweight and push-button, and the hosted model simplifies management and use. AI Platform Pipelines runs on a Google Kubernetes Engine (GKE) cluster. A cluster is automatically created for you as part of the installation process, but you can use an existing GKE cluster if you like. The Cloud AI Platform UI lets you view and manage all your clusters. You can also delete the Pipelines installation from a cluster and then reinstall, retaining the persisted state from the previous installation while updating the Pipelines version.Easy authenticated accessAI Platform Pipelines gives you secure and authenticated access to the Pipelines UI via the Cloud AI Platform UI, with no need to set up port-forwarding. You can also give access to other members of your team.It is similarly straightforward to programmatically access a Pipelines cluster via its REST API service. This makes it easy to use the Pipelines SDK from Cloud AI Platform notebooks, for example, to perform tasks like defining pipelines or scheduling pipeline run jobs. The AI Platform Pipelines tech stackWith AI Platform Pipelines, you specify a pipeline using the Kubeflow Pipelines (KFP) SDK, or by customizing the TensorFlow Extended (TFX) Pipeline template with the TFX SDK. The SDK compiles the pipeline and submits it to the Pipelines REST API. The AI Pipelines REST API server stores and schedules the pipeline for execution. AI Pipelines uses the Argo workflow engine to run the pipeline and has additional microservices to record metadata, handle components IO, and schedule pipeline runs. Pipeline steps are executed as individual isolated pods in a GKE cluster, enabling the Kubernetes-native experience for the pipeline components. The components can leverage Google CLoud services such as Dataflow, AI Platform Training and Prediction, BigQuery, and others, for handling scalable computation and data processing. The pipelines can also contain steps that perform sizeable GPU and TPU computation in the cluster, directly leveraging GKE autoscaling and node autoprovisioning.Let’s look at parts of this stack in more detail.SDKs Cloud AI Platform pipelines supports two SDKs to author ML pipelines: the Kubeflow Pipelines SDK—part of the Kubeflow OSS project—and the TFX SDK. Over time, these two SDK experiences will merge. The TFX SDK will support framework-agnostic operations available in the KFP SDK. And we will provide transition paths that make it easy for existing KFP SDK users to upgrade to the merged SDK.Why have two different SDKs?The Kubeflow Pipelines SDK is a lower-level SDK that’s ML-framework-neutral, and enables direct Kubernetes resource control and simple sharing of containerized components (pipeline steps). The TFX SDK is currently in preview mode and is designed for ML workloads. It provides a higher-level abstraction with prescriptive, but customizable components with predefined ML types that represent Google best practices for durable and scalable ML pipelines. It also comes with a collection of customizable TensorFlow-optimized templates developed and used internally at Google, consisting of component archetypes, for production ML. You can configure the pipeline templates to build, train, and deploy your model with your own data; automatically perform schema inference, data validation, model evaluation, and model analysis; and automatically deploy your trained model to the AI Platform Prediction service.When choosing the SDK to run your ML pipelines with the AI Platform Pipelines beta, we recommend:TFX SDK and its templates for E2E ML Pipelines based on TensorFlow, with customizable data pre-processing and training code. Kubeflow Pipelines SDK for fully custom pipelines, or pipelines that use prebuilt KFP components, which support access to a wide range of GCP services.The metadata store and MLMD AI Platform Pipeline runs include automatic metadata tracking, using ML Metadata (MLMD), which is a library for recording and retrieving metadata associated with ML developer and data scientist workflows. It’s part of TensorFlow Extended (TFX), but it’s designed to also be used independently.The automatic metadata tracking logs the artifacts used in each pipeline step, pipeline parameters, and the linkage across the input/output artifacts, as well as the pipeline steps that created and consumed them.New Pipelines featuresThe beta launch of AI Platform Pipelines includes a number of new features, including support for template-based pipeline construction, versioning, and automatic artifact and lineage tracking.Build your own ML pipeline with TFX templates To make it easier for developers to get started with ML pipeline code, the TFX SDK provides templates, or scaffolds, with step-by-step guidance on building a production ML pipeline for your own data. With a TFX template, you can incrementally add different components to the pipeline and iterate on them. TFX templates can be accessed from the AI Platform Pipelines Getting Started page in the Cloud Console. The TFX SDK currently provides a template for classification problem types and is optimized for TensorFlow, with more templates on the way for different use cases and problem types. A TFX pipeline typically consists of multiple pre-made components for every step of the ML workflow. For example, you can use ExampleGen for data ingestion, StatisticsGen to generate and visualize statistics of your data, ExampleValidator and SchemaGen to validate data, Transform for data preprocessing, Trainer to train a TensorFlow model, and so on. The AI Platform Pipelines UI lets you visualize the state of various components in the pipeline, dataset statistics, and more, as shown below.Visualize the state of various components of a TFX pipeline run, and artifacts like data statistics.Pipelines versioningAI Platform Pipelines supports pipeline versioning. It lets you upload multiple versions of the same pipeline and group them in the UI so you manage semantically-related workflows together.AI Platform Pipelines lets you group and manage multiple versions of a pipeline.Artifact and lineage tracking AI Platform Pipelines supports automatic artifact and lineage tracking powered by ML Metadata, and rendered in the UI. Artifact Tracking: ML workflows typically involve creating and tracking multiple types of artifacts—things like models, data statistics, model evaluation metrics, and many more. With AI Platform Pipelines UI, it’s easy to keep track of artifacts for a ML pipeline.Artifacts for a run of the “TFX Taxi Trip” example pipeline. For each artifact, you can view details and get the artifact URL—in this case, for the model.Lineage tracking: Just like you wouldn’t code without version control, you shouldn’t train models without lineage tracking. Lineage Tracking shows the history and versions of your models, data, and more. You can think of it like an ML stack trace. Lineage tracking can answer questions like: What data was this model trained on? What models were trained off of this dataset? What are the statistics of the data that this model trained on?For a given run, the Pipelines Lineage Explorer lets you view the history and versions of your models, data, and more.Other improvementsThe recent releases of the Kubeflow Pipelines SDK include many other improvements. A couple worth noting are improved support for building Pipeline components from Python functions, and easy specification of component inputs and outputs, including the ability to easily share large datasets between pipeline steps.Getting startedTo get started, visit the Google Cloud Console, navigate to AI Platform > Pipelines, and click on NEW INSTANCE. You can choose whether you want to use an existing GKE cluster or have a new one created for you as part of the installation process. If you create a new cluster, you can check a box to allow access to any Cloud Platform service from your pipelines. (If you don’t, you can specify finer-grained access with an additional step. Note that demo pipelines and TFX templates require access to Dataflow, AI Platform, and Cloud Storage.)See the instructions for more detail. If you prefer to deploy Kubeflow Pipelines to a GKE cluster via the command line, those deployments are also accessible under AI Platform > Pipelines in the Cloud Console.Once your AI Platform Pipelines cluster is up and running, click its OPEN PIPELINES DASHBOARD link. From there, you can explore the Getting Started page, or click on Pipelines in the left navigation bar to run one of the examples. The <add name> pipeline shows an example built using the ML pipeline templates described above. You can also build, upload, and run one of your own pipelines.When you click on one of the example pipelines, you can view its static DAG, get information about its steps, and run it.The static graph for a pipeline. (The Templates section above shows an image of a pipeline’s runtime graph, including visualizations it has generated).Once a pipeline is running—or after it has finished—you can view its runtime graph, logs, output visualizations, artifacts, execution information, and more. See the documentation for more details. What’s next?We have some new Pipelines features coming soon, including support for: Multi-user isolation, so that each person accessing the Pipelines cluster can control who can access their pipelines and other resourcesWorkload identity, to support transparent access to GCP servicesEasy, UI-based setup of off-cluster storage of backend data—including metadata, server data, job history, and metrics—for larger scale deployments and so that it can persist after cluster shutdownEasy cluster upgrades More templates for authoring ML workflows To get started with AI Platform Pipelines, try some of the example pipelines included in the installation, or check out the “Getting Started” landing page of the Pipelines Dashboard. These notebooks also provide more examples of pipelines written using the KFP SDK.
Quelle: Google Cloud Platform

Get the Flink Operator for Kubernetes in Anthos on Marketplace

At Google Cloud, our Dataproc team has been working to improve the integration of open source processing engines with Kubernetes. Dataproc is our managed service for running many of these open source engines, including Apache Spark and Apache Hadoop. Our goal is to make the underlying infrastructure for data processing engines more reliable and secure, so your company can trust open source to run your business, no matter where the data lives. With this in mind, we’re announcing the availability of the open source Apache Flink for Kubernetes operator in the Google Cloud Marketplace. With this offering, Google’s experience and best practices for running Apache Flink are captured and automated in a Kubernetes Operator, and made easily deployable in your own cluster within minutes. Anthos customers can also deploy this new operator in their on-prem environments by following these prerequisites.This follows up on several releases designed to make it easier to run open source data processing on Kubernetes. This means you can reduce stack dependencies and have your jobs run across multi-cloud and hybrid environments. We started by releasing an open source Kubernetes operator for Apache Spark and followed up by integrating the Spark operator with the Dataproc Jobs API. This gives you a single place to securely manage containerized Spark workloads across various types of deployments, all with the support and SLAs that Dataproc provides. Make open source easier with Google CloudOpen source has always been a core pillar of Google Cloud’s data and analytics strategy. Starting with the MapReduce paper in 2004, to more recent open source releases of Tensorflow for ML, Apache Beam for data processing, and even Kubernetes itself, we’ve built communities around open source technology and across company boundaries. To accompany these popular open source technologies, Google Cloud offers managed versions of the most popular open source software applications. Dataproc is one, and Anthos is an open hybrid and multi-cloud application platform that enables you to modernize your existing applications, build new ones, and run them anywhere in a secure manner. Anthos is also built on open source technologies pioneered by Google, including Kubernetes, Istio, and Knative.  Why should you run Apache Flink on Kubernetes? Recently, our Dataproc team has been exploring how customers use open source data processing technologies like Apache Flink, and we’ve heard several pain points related to library and version dependencies that break systems, and balancing that with having to isolate environments and have resources that sit idle. These are challenges that Kubernetes and Anthos are well-positioned to address. Kubernetes can improve the reliability of your infrastructure. This is very important for Apache Flink, since many Apache Flink jobs are streaming applications that need to stay up 24/7 and be resistant to failure. By combining the features of Kubernetes with Apache Flink, operators have much more control over their architecture and can keep streaming jobs up and running while still performing updates, patches, and upgrades of their system. By using containerization, you can even have different Flink jobs with conflicting versions and different dependencies all sharing the same Kubernetes cluster. The Apache Flink Runner for Apache Beam also makes Beam pipelines portable to nearly any public or private cloud environment. We hear that developers and data engineers love Google Cloud’s Dataflow for streaming pipelines because it offers a way to run Apache Beam data processing pipelines in the cloud with fully automated provisioning and management of resources. However, many companies have either technical or compliance constraints on what data can be taken to the cloud. Using the Kubernetes operator for Apache Flink makes it easy to deploy Flink jobs, including ones authored with the Beam SDK that target the Flink runner. This enables Flink users to run Beam pipelines in the cloud using a service like GKE, while still making it easy to run jobs on-prem in Anthos.Apache Beam fills an important gap for Flink users who prefer a mature Python API. For example, if you are a machine learning engineer using TFX on-prem for your end-to-end machine learning lifecycle, you can author your pipeline using the Beam and TFX libraries, then run them on the Flink runner.You can get started with the Flink Operator in Kubernetes by deploying it from the Google Cloud Marketplace today. For those interested in contributing to the project, find us on GitHub. Learn more in this video about the Flink on Kubernetes operator and take a look at the operations it provides.
Quelle: Google Cloud Platform

How the Chicago DOT keeps Chicagoans connected with Google Cloud

Google Cloud, at its core, is about helping organizations drive efficiencies that enable innovation and broad digital transformation. Such is the case with the Chicago Department of Transportation (CDOT), a longtime customer, partnered with SADA to develop dotMaps application. The application uses Google Cloud in coordination with Google Maps to ingest multiple data sources to power CDOT’s newChiStreetWork website. This public website helps inform Chicagoans on everything from when and where special events are taking place, to how road repairs and construction projects are impacting traffic patterns for their daily commutes.Chicago has become one of the most densely populated areas in the United States, with almost a quarter of Illinois residents living within its city limits. The DOT’s job is to manage traffic in and around the construction on thousands of miles of alleys and street surfaces. Adding to the street congestion are annual festivals like Lollapalooza and the St. Patrick’s Day Parade, Chicago’s famous block parties, and many more events.The CDOT needed a solution that would put all of its transportation data at the fingertips of Chicago’s residents, while at the same time increasing the accountability and transparency of the city’s public-facing work across all of its departments. The solution is ChiStreetWork, a future-looking forecast website that predicts traffic patterns and disruptions in the same way a customized weather model predicts hailstorms and big temperature shifts.ChiStreetWorks integrates upcoming road and infrastructure projects, along with other street closure information, so citizens can find event dates and locations and pinpoint CDOT permit details—including lane closures and work hours. The site also provides bus routes, potential parking impacts, modified bike routes, viaduct heights, and red light camera locations.Using a familiar Google Maps interface, residents and visitors can subscribe to a targeted area, like their neighborhoods or workplaces, and define what public works and event information they’d like to receive (and at what frequency). This gives residents a new level of transparency on street work happening in their neighborhoods.With ChiStreetWork, the CDOT has been able to cut down on calls made to the office, freeing up resources and, at the same time, providing much greater transparency to its citizens.“I would listen to the calls coming into the office, and citizens just weren’t aware of what was going on. Someone would have a block party and then water management would arrive to dig up the street,” said CDOT Deputy Commissioner Michael Simon. “ChiSreetWork is more user-friendly and coordinates all events and work projects. The new subscription feature makes it easy for residents to get the information they need, and it provides an unprecedented level of visibility.”The website was revamped in collaboration with Google Cloud, Collins Engineers, Inc., and longtime partner SADA. As one of Google Cloud’s longest-standing partners, SADA’s expertise is built on years of experience in building customer solutions that are tailored for their unique needs. “We evaluated different companies, and what we liked best was the flexibility, scalability, and speed of Google Cloud,” said Simon. “Working for a city can be very bureaucratic sometimes. Working with Google Cloud, however, allowed us to implement new tools and processes quickly, helping us to get citizens the right information in real-time. With Google Cloud, we’ve been able to move forward with an eye on future technologies, including AI.”In working with agencies like the CDOT, Google Cloud is thrilled to help public sector organizations transform their departments to better serve citizens. We look forward to continuing to partner with state and local customers to identify ways our technologies can positively impact communities and give residents access to critical information. Learn more about our work with the public sector here.
Quelle: Google Cloud Platform

Compute Engine instance creation made easy with machine images

Today, we’re pleased to introduce machine images, a new type of Compute Engine resource that contains all the information you need to create, backup or restore a virtual machine, reducing the amount of time you spend managing your environment.If you administer applications that run on Compute Engine, you probably spend a lot of time creating images that you can use to create new instances. But even though Compute Engine features like custom images capture necessary information like disk data, you still need to manually capture instance configuration and metadata to create a new virtual machine. Machine images eliminates these extra steps and streamlines your operations. How are machine images different from images?Custom images capture the contents of a single disk, for example, a boot disk, which can be used to create new instances that are preconfigured with the apps that you need, so that you don’t have to configure public images from scratch. Machine images are a more comprehensive resource that can contain multiple disks, as well as all of the information required to capture and create a new instance, including:Instance properties (machine type, labels, volume mapping, network tags)Data of all attached disks (one or multiple)Instance metadataPermissions, including the service account used to create the instanceTogether, the additional information contained in a machine image not only simplifies image creation, but it also lays the foundation for a number of advanced capabilities.  A better backup solutionBacking up an instance requires more than just disk data. To recreate an instance you need instance properties like the machine type, network tags, labels, and more. Capturing this information is easier with machine images. When you create a machine image from an instance, it stores the instance information and disk data into a single resource. When it comes time to restore the instance, all you need to do is provide the machine image and a new instance name. Machine images can be created whether the source instance is running or stopped. In addition to storing complete instance properties and data, machine images use the same differential disk backup technology that powers incremental snapshots, giving you fast, reliable and cost-effective instance backups. On top of existing incremental snapshots, machine images guarantee crash-consistency across all the attached disks at a given point in time. Compute Engine lets specify the storage location for your machine image disk data.This may help you meet availability or compliance goals. For example, choosing a multi-region such as ‘US’ ensures that the data is safe in multiple copies across multiple zones. Similarly, you can choose a single region to restrict the disk data to a particular region.Machine image as golden imageImagine that you’ve created and configured an instance as part of your web application, and you want to use it as the basis of other instances. With machine images, you can capture your web application exactly as you want it and save it as a golden machine image. You can then use that machine image to launch as many instances as you need, configured in the exact same way as your source instance. You can also share the machine image with other projects. If you need to change the properties of your new VMs, you can define new instance properties using machine images’ override functionality.For replication use cases, we recommend creating a machine image from a stopped instance, which guarantees system integrity and performs OS generalization (i.e., Windows Sysprep). To learn more about best practices for creating machine images for replication purposes, including Windows VMs, visit the documentation.Getting started with machine imagesYou can start using machine images via the Cloud Console, gcloud or the API. Let’s look at how to create a machine image from an instance from the console. First, visit the new ‘Machine images’ option from the left navigation bar in the Compute Engine console. Then select “Create a machine image” from the menu. In this case, we’re creating a machine image of an application server.To create an instance from a machine image, you can either create it directly from the Machine images page, or from the instance creation page by selecting the “New VM instance from machine image” option from the left menu.Get started with machine images today by visiting Compute Engine Cloud Console. The new machine images make it easy to create new instances at the heart of your scalability, backup and disaster recovery strategy. To learn more about machine images, including pricing information, visit the documentation.
Quelle: Google Cloud Platform