Rapid cloud foundation buildout and workload deployment using Terraform

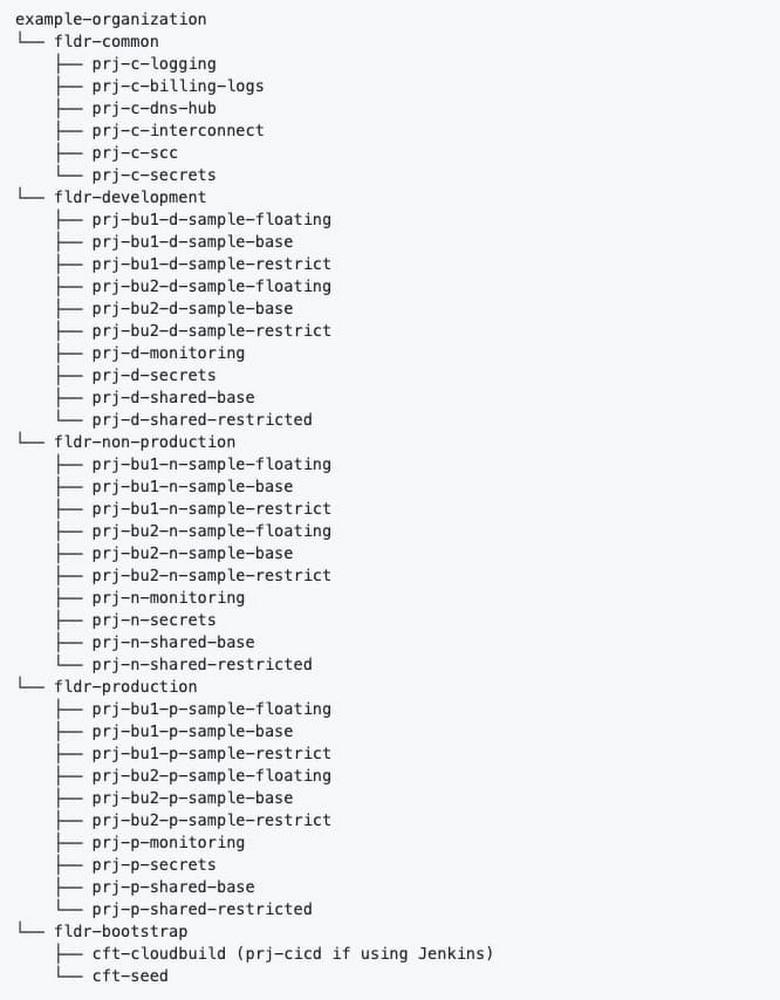
Last year, we released the Cloud Foundation Toolkit, open source templates that help you quickly build a strong cloud foundation according to best practices. These modules are available for both the Terraform infrastructure-as-code framework, as well as our own Cloud Deployment Manager.This blog post will detail building a secure cloud foundation using the Cloud Foundation Toolkit Terraform example foundation. From there, we will explore how to deploy a microservices demo application onto the foundation using Terraform. After reading this content, we hope you learn how to accomplish the following: Reduce the time required to build out an enterprise cloud foundation to less than one day following Google best practicesUse your cloud foundation by deploying a demo Google Kubernetes Engine (GKE) workload onto the foundation using TerraformDeploy a GKE cluster at the highest level of security based on Google expert recommendations (IAP with TCP forwarding bastion host)Getting startedTo get started with using the Cloud Foundation Toolkit, first you need to understand Terraform and Linux command line basics. Then, you will need to make sure you have the following prerequisites.Prerequisites:A GCP OrganizationA GCP Billing AccountAbility to create Cloud Identity / G Suite groupsLinux command line access with the following installed and configured:Google Cloud SDKTerraformGitBuilding out a cloud foundationFirst, you will need to clone the Terraform example foundation repository.Git clonehttps://github.com/terraform-google-modules/terraform-example-foundation.gitThis repo contains several distinct Terraform projects each within their own directory that must be applied separately, but in sequence. Each of these Terraform projects are to be layered on top of each other, running in the following order. 0-bootstrap: The purpose of this step is to bootstrap a GCP organization, creating all the required resources & permissions to start using the Cloud Foundation Toolkit (CFT). This step also configures Cloud Build & Cloud Source Repositories for foundations code in subsequent stages.1-org: The purpose of this step is to set up top level shared folders, monitoring & networking projects, organization-level logging, and set baseline security settings through organizational policy.2-environments: The purpose of this step is to set up environments, such as development (“dev”) and production (“prod”) environments, within the GCP organization.3-networks: The purpose of this step is to set up shared VPCs with default DNS, NAT, Private Service networking, and baseline firewall rules. 4-projects: The purpose of this step is to set up folder structure and projects for applications, which are connected as service projects to the shared VPC created in the previous stage. You will need to follow the instructions on the Terraform example foundation repository’s README.md files in order to apply each directory in sequence. The successful completion of each step is required before you can move on to the next step in the sequence.After you have successfully completed all of the foundational steps in sequence, your organization’s structure should look similar to the diagram below:You can validate that your organization structure was created correctly by visiting the Manage Project & Folders page within GCPDeploy first workload: Microservices demo applicationNow that you have a solid cloud foundation, you can deploy your first workload. This blog post will provide instructions on how to deploy the Online Boutique microservices demo application on a GKE private cluster. The demo application is a web-based e-commerce app. This diagram shows the service architecture of the Online Boutique e-commerce application (Image source)Creating the private cluster (safer access with IAP Bastion Host) via TerraformFor restricted access to the control plane of your GKE cluster, it is highly recommended to use IAP with TCP forwarding to access a Bastion host (GCE Virtual Machine) within a private, authorized IP range. The instructions to do so have been copied here for your convenience, referencing the Safer Cluster Access with IAP Bastion Host repository— additional context and minor adjustments have been made in preparation for installing a microservices demo, outlined in the next section. Please follow these steps to automate the creation of a hardened Private Cluster through a bastion host utilizing IAP without an external IP address:Choose a project that was created in the foundation (or create your own project using one of the 4-projects modules) to contain your GKE cluster. For this step, we recommend that you keep Terraform files in a new folder and configure a new, separate Terraform backend. See this article for more information about managing Terraform state. You will be using the network set up in step 3-networks above.Enable optional firewall rules in your shared VPC by modifying your 3-networks/envs/dev/main.tf and adding the following: optional_fw_rules_enabled = truenat_enabled = trueEnsure that you have enabled the following APIs enabled in your project, by adding activate_apis = [“container.googleapis.com”, “iap.googleapis.com”]Take note of the network project id in this step (for example in order to attach the cluster to `dev` environment base Shared VPC, `terraform output dev_base_host_project_id`).Clone the terraform-google-kubernetes-engine repo by running git clone https://github.com/bharathkkb/example-foundations-safer-clusterCreate a terraform.tfvars to provide values for project_id, network_project_id, bastion_members. Optionally override any variables if necessary (if attaching to a different SVPC other than the `dev` environment base Shared VPC, parameters like network_name, subnet_name, ip_range_pods_name, ip_range_services_name may need to be overridden).Run terraform init to get the plugins, then terraform apply to apply the build. By default, global access isn’t enabled for the control plane’s private endpoint upon creation of a private cluster. It is important to make the cluster private, preventing nodes from being exposed to the Internet— in this example, we select a private endpoint for the control plane while providing a CIDR block of the bastion host subnet. This way, the control plane is reachable only by whitelisted CIDRs, by nodes within your cluster’s VPC, and by Google’s internal production jobs that manage your control plane.  Now that you have deployed a private, safer GKE cluster with no client access to the public endpoint while creating a bastion host GCE VM in the same network (which you will use to access the cluster’s control plane), please continue to the next section to deploy a microservices application. Deploy the Online Boutique onto your GKE clusterOnline Boutique consists of a 10-tier microservices application. The following instructions utilize pre-built container images in order to quickly deploy the release manifest directly to an existing cluster. Please follow these steps in continuation from the initial Safer Cluster steps: 1. SSH to the Bastion Host while port forwarding to the bastion host through an IAP tunnel. The command with the right parameters will be displayed by running terraform output bastion_ssh_command.gcloud beta compute ssh $BASTION_VM_NAME –tunnel-through-iap –project $PROJECT_ID –zone $ZONE — -L8888:127.0.0.1:8888Note: Make sure this is running in the background for the following steps. You can now run kubectl commands through the proxy. An example command will be displayed as the Terraform output bastion_kubectl_command2. Clone the microservices-demo repo by running git clone https://github.com/GoogleCloudPlatform/microservices-demo.gitChange your directory to /microservices-demo/release/3. Generate a kubeconfig file with the appropriate credentials and endpoint information to access the cluster. The command with the right parameters will be displayed by running terraform output get_credentials_command  gcloud container clusters get-credentials –project $PROJECT_ID –region $REGION –internal-ip safer-cluster-iap-bastion4. Deploy the app. A number of services shown within the “kubernetes-manifests” folder will be created automatically: HTTPS_PROXY=localhost:8888 kubectl apply -f ./release/kubernetes-manifests.yaml5. Make sure that the pods are in a ready state, which means that each pod has RUNNING status and 1/1 readiness for each service.HTTPS_PROXY=localhost:8888 kubectl get pods6. Find the IP address of your application, then visit the application to confirm installation.HTTPS_PROXY=localhost:8888 kubectl get service/frontend-external7. If the setup worked correctly, you should be able to navigate to the external IP address and view your demo Online Boutique application. It looks like this:Congrats, you have deployed a microservices demo app using Terraform!Next stepsNow that you know how to deploy a workload onto your secure Google Cloud foundation, you can continue to leverage Terraform, or your preferred method, to deploy your own workloads. Be sure to watch/star your favorite Cloud Foundation Toolkit repos and provide feedback by raising issues in their respective repositories.
Quelle: Google Cloud Platform

Helping media companies navigate the new streaming normal

Editor’s note: An earlier version of this feature originally appeared on Next TVand TV Technology.From the explosion of new programming to the launch of high-profile streaming services, 2020 was on track to be a transformational year in media and entertainment. But at the same time, the industry fully expected many of its foundational elements—windowing strategies, live events, production standards—to stay the same.All that changed with COVID-19. Suddenly, the future came early to the industry, with many facing difficult challenges like accelerating and evolving direct-to-consumer business models while at the same time keeping workers and productions physically distanced.As media companies transition from short-term response to long-term planning, many are contemplating how different the industry might look in the months and years to come.All this is the topic of our new guide,Accelerated Media Evolution In The Time Of COVID, and the focus of ourMedia OnAir events, where we’ll share insights from our work with leading media companies. For these organizations and others, we recommend keeping new audience behaviors top of mind and focusing on driving three key changes.1. Scale new monetization channels and engage audiences through data As audiences were stuck at home during the early stages of the pandemic, linear viewing saw a temporary increase in consumption—driven by specific formats such as news. But that consumption returned to pre-lockdown levels as restrictions were lifted in certain regions.By contrast, many streaming subscription services saw consistent increased adoption. Nine percent of U.S. households took up a new SVOD service in Q2 2020.1 The surge in streaming consumption seems to be more resilient than its linear counterpart, as U.S. time spent with streaming services in June 2020 was roughly 50 percent above its 2019 level.2In contrast to the Pay TV bundle, today’s streaming audiences have access to much more choice and freedom in their entertainment options. These viewers have shown both a preference to stack multiple services and a higher propensity to churn. As the pandemic affects discretionary spending across the world, audiences will look to save on entertainment costs, making SVOD services more attractive than traditional Pay TV bundles, as well as driving an increased adoption of AVOD services. As a result, media organizations need to reassess how to streamline existing broadcast operations and costs. They must invest in building technology platforms that can handle unpredictable streaming demand seamlessly, while also deriving deeper audience insights from their data in order to drive audience engagement, retention, and monetization. For example, leading British broadcaster ITV  built a video analytics solution on Google Cloud so they could better monitor events on their VOD service, ITV Hub.2. Produce new content remotely and maximize the value of library contentWhile distribution channels may change, content still remains the industry’s crown jewel. Content breadth, exclusivity, and original content are the top three reasons that audiences adopt streaming services, and maximizing the value of both library and new content has never been more critical.Content production has also been disrupted by the pandemic. Physical productions have paused across the world, only slowly starting to resume once again. And for content that has made it through the complex post-production process, the global shuttering of theatrical exhibition has forced many blockbuster titles to debut on streaming services—radically altering windowing strategies and the economic models that come with it. Media companies have resorted to boundless creative strategies to keep content production lines open. Formats that can be created remotely such as animation are experiencing a boom, and live events such as news and sports have established new remote working processes in record time.Content production has been on the rise for years, but the temporary halt in production has been a silver lining for media companies; this pause has presented an opportunity to step back and implement more digital, collaborative, streamlined, and global production and management processes, supported by the cloud. Media companies like ViacomCBS have also accelerated the digitization and enrichment of their extensive back catalogs and archives, to help fill the content gap. 3. Reimagine the workplace for the future of productivityFinally, the biggest challenge many companies and industries face has been the shift to remote work. Innovative companies like Yahoo Finance, for example, utilized our video conferencing solution to keep their broadcast team’s content flowing and audiences engaged. 150 of Yahoo Finance’s editors, reporters, and anchors used Google Meet to deliver news and video streams on air from locations across the U.S. and London to tens of millions of viewers live, transitioning to a 100 percent remote broadcast model overnight. As the industry navigates a new working norm, many media company offices will require thoughtful consideration of which tasks can be automated or done remotely, and exactly how much real estate is required to maintain operations. Decisions are likely to be different by functions. Post-production staff, visual effects artists, and video editors can utilize virtual workstations and editing applications to complete their work remotely, while central teams such as finance, sales, and marketing can utilize video conferencing services like Meet to stay connected no matter where they are. But some essential personnel—lightweight studio production teams and on- prem playout teams—will need to still come into the office.Continued innovation in the face of unprecedented changeMany media and entertainment companies are choosing Google Cloud operations modernization—all to thrive and remain relevant within this new era. For example, Major League Baseball adopted Anthos as the vehicle to run their applications anywhere, utilized BigQuery to upgrade their Statcast platform, and launched new fan friendly initiatives like Film Room using our machine learning technologies—all in the service of becoming more agile and delivering more innovative fan experiences in a competitive media ecosystem. This year has been one of unexpected and accelerated change for all, but the ingenuity, innovation, and determination of media companies to continue delivering critical news, information, and entertainment to audiences across the world has been extraordinary. Google Cloud is committed to bringing forward technologies that the media industry needs and to partner with our customers to help them continue to innovate in the face of unprecedented challenges. To learn more, read our guide,Accelerated Media Evolution In The Time Of COVID, or join us at one of ourMedia OnAir events.Sources:1. Kantar, Amazon tops Disney, Netflix with surge in video service (August 2020)2. Nielsen; The Hollywood Reporter, The Quarantine TV Ratings Spike Is Over (June 2020)
Quelle: Google Cloud Platform

What’s new with Google Cloud

Want to know the latest from Google Cloud? Find it here in one handy location. Check back regularly for our newest updates, announcements, resources, events, learning opportunities, and more. Week of Oct 5-9 2020Introducing the Google Cloud Healthcare Consent Management API—This API gives healthcare application developers and clinical researchers a simple way to manage individuals’ consent of their health data, particularly important given the new and emerging virtual care and research scenarios related to COVID-19. Read the blog.Announcing Google Cloud buildpacks—Based on the CNCF buildpacks v3 specification, these buildpacks produce container images that follow best practices and are suitable for running on all of our container platforms: Cloud Run (fully managed), Anthos, and Google Kubernetes Engine (GKE). Read the blog.Providing open access to the Genome Aggregation Database (gnomAD)—Our collaboration with Broad Institute of MIT and Harvard provides free access to one of the world’s most comprehensive public genomic datasets. Read the blog.Introducing HTTP/gRPC server streaming for Cloud Run—Server-side HTTP streaming for your serverless applications running on Cloud Run (fully managed) is now available. This means your Cloud Run services can serve larger responses or stream partial responses to clients during the span of a single request, enabling quicker server response times for your applications. Read the blog.New security and privacy features in Google Workspace—Alongside the announcement of Google Workspace we also shared more information on new security features that help facilitate safe communication and give admins increased visibility and control for their organizations. Read the blog.Introducing Google Workspace—Google Workspace includes all of the productivity apps you know and use at home, at work, or in the classroom—Gmail, Calendar, Drive, Docs, Sheets, Slides, Meet, Chat and more—now more thoughtfully connected. Read the blog.New in Cloud Functions: languages, availability, portability, and more—We extended Cloud Functions—our scalable pay-as-you-go Functions-as-a-Service (FaaS) platform that runs your code with zero server management—so you can now use it to build end-to-end solutions for several key use cases. Read the blog.Announcing the Google Cloud Public Sector Summit, Dec 8-9—Our upcoming two-day virtual event will offer thought-provoking panels, keynotes, customer stories and more on the future of digital service in the public sector. Register today at no cost.
Quelle: Google Cloud Platform

Providing open access to the Genome Aggregation Database (gnomAD) on Google Cloud

Today, we are excited to announce a collaboration between Google Cloud Healthcare & Life Sciences and the Broad Institute of MIT and Harvard to provide free access to one of the world’s most comprehensive public genomic datasets, the Genome Aggregation Database (gnomAD). gnomAD brings together data from numerous large-scale sequencing projects, including population and disease-specific genetic studies. With more than 241 million unique short human genetic variants and 335,000 structural variants observed in more than 141,000 healthy adult individuals across a diverse range of genetic ancestry groups, this dataset is a near-ubiquitous resource for human genetics research and clinical variant interpretation. It is used in clinical genetic diagnostic pipelines worldwide.gnomAD data is hosted in several formats to address a broad range of biomedical and healthcare use cases. This data is available in Hail-formatted tables and Variant Call Format (VCF) files in Google Cloud Storage. This data is also made available in BigQuery as part of the Public Datasets Program. Users receive 1TB of free BigQuery processing every month, which can be used to run queries on this public dataset. Google Cloud users can securely access this data in any of these formats across all Google Cloud regions through their bioinformatics pipelines on Google Cloud without paying egress charges.To make gnomAD available in BigQuery, the Google Cloud team used Variant Transforms to ingest VCF files. Once ingested, the variants were sharded to split the output tables by chromosome. In addition, we utilized integer range partitioning and clustering to reduce the cost of queries. This work enables researchers to explore gnomAD quickly and efficiently, without needing to request or pay for dedicated cloud compute resources. By querying a smaller targeted genomic region, query costs are expected to be reduced significantly compared to querying the whole dataset. This application of Variant Transforms has been leveraged by partners and customers like the Mayo Clinic and Color Genomics to accelerate their genomics research. More information on using gnomAD in BigQuery is available in this tutorial.The data in the Google Cloud Storage bucket also includes standard truth sets used to assess and validate variant calls, data from the Broad Institute’s papers in Nature, interval lists, and other annotation resources.To access gnomAD on Google Cloud, explore the documentation here. Files can also be browsed and downloaded using the Cloud Console or the command line tool gsutil. After installing gsutil, start browsing with $ gsutil ls gs://gcp-public-data–gnomad.Explore additional Healthcare and Life Sciences dataset offerings on Google Cloud here.Related ArticleGenomics analysis with Hail, BigQuery, and DataprocTry data analytics for genomics research in the cloud using BigQuery, Dataproc and Hail for fast large-scale research.Read Article
Quelle: Google Cloud Platform

Announcing Google Cloud buildpacks—container images made easy

As a developer building a new application, you want to focus on writing code, not containerizing it. And if you already use containers, you know that creating a good, secure container image can be complicated and time-consuming. Today we’re launching broad support across Google Cloud for buildpacks—an open-source technology that makes it fast and easy for you to create secure, production-ready container images from source code and without a Dockerfile.At the center of this release are a collection of open-source buildpacks and builders. Based on the CNCF buildpacks v3 specification, these buildpacks produce container images that follow best practices and are suitable for running on all of our container platforms: Cloud Run (fully managed), Anthos, and Google Kubernetes Engine (GKE). These buildpacks are production hardened and tested; they have been used at scale powering most builds for App Engine and Cloud Functions since March. Using buildpacksYou can use buildpacks in several ways: First, if you haven’t already fully adopted containerization, buildpacks are a way to use the latest container runtime and delivery platforms. They’re also useful for quick projects when you don’t have time to properly vet and customize a Dockerfile that you might find in the wild.You can try out the Google Cloud buildpacks right now. To do a complete source-to-deploy with a Go project, Buildpacks, and Cloud Run, just click on the ‘Run on Google Cloud’ button.To try Buildpacks locally with an application, install Docker and the ’pack’ CLI tool then run:(Go, Java, Node, Python, and .Net are supported. They might need additional configuration to build properly.)Or, if you don’t want to install anything, you can run a buildpack based build in Cloud Build, and then easily deploy to Cloud Run:How do buildpacks work?Buildpacks are distributed and executed in OCI images called builders. Each builder can have one or more buildpacks. The builder of the Google Cloud buildpacks that we are releasing today is available gcr.io/buildpacks/builder. Builders have the ability to auto-detect the language of your source code. This is accomplished by a `bin/detect` executable in the buildpack. The detection scripts are invoked in a particular order and stop once an appropriate number of buildpacks have opted in to the build. For example, most Node.js buildpacks look for the presence of a packages.json file. You can also manually specify which buildpack to use, thereby skipping the auto-detection step.Once the buildpack has been selected, its `bin/build` is executed. This script transforms your source code into an executable artifact, typically performing actions such as installing dependencies or compiling code. The output of this build step is then added on top of a “run” OCI base image, creating a final container image which can then be run on the platform of your choice.Google Cloud buildpacksGoogle Cloud’s buildpacks are optimized for security, speed, and reusability. They allow you to build both apps and functions into container images. When building a function, they package it using Google Cloud’s open-source Functions Framework.Google Cloud buildpacks use a managed base Ubuntu 18.04 base image that is regularly scanned for security vulnerabilities; any detected vulnerabilities are automatically patched. This ensures that when you build your source code with buildpacks, it will be as secure as possible.Google Cloud buildpacks can also be customized with additional system packages or to meet your development team’s particular needs. The buildpacks themselves are all written in Go. Rather than create a single buildpack for each language, you can combine smaller, modular buildpacks together. For example, there is an NPM buildpack which (unsurprisingly) installs node packages. This is of course used for Node.js builds, but it can also be used for other languages and frameworks that use NPM packages (Ruby on Rails, for example).Broad support in Google CloudIn addition to the open-source buildpacks, we support buildpacks across a range of our products:Cloud Build now natively supports buildpacks via the gcloud CLI tool: gcloud alpha builds submit –pack image=gcr.io/[project-id]/my-app. (see documentation)Cloud Run – Continuous deployment to Cloud Run (via Cloud Build triggers) can be configured to use buildpacks (see documentation). App Engine – Buildpacks are now the default mechanism for source deployments on most newer App Engine runtimes. Notably, buildpacks enable source-based Java deployments (previously only JAR-based deploys were supported). All newly released runtimes will use buildpacks moving forward. Cloud Functions – Like App Engine, buildpacks are the default mechanism for building deployed functions.Cloud Code – Cloud Code IDEs can build your source code with buildpacks and deploy the resulting containers directly to GKE. Skaffold supports live development with buildpacks. As you edit your source code, buildpacks can continuously re-build your app, allowing you to preview changes in a local instance of your app.Cloud Shell – The pack CLI tool is now installed in Cloud Shell by default. This allows you to execute buildpacks in Cloud Shell without installing any additional packages.Get started todayLearn more about Google Cloud’s buildpacks on the GitHub repository. Then, deploy an app sample using buildpacks in the click of a button.
Quelle: Google Cloud Platform

The Google Cloud Healthcare Consent Management API: protecting emerging data in digital care and research

The ongoing COVID-19 pandemic has accelerated trends across many industries; in health, it has created a need for new solutions to enable virtual care—and even run clinical trials remotely. This has, in turn, created the need for tools that help healthcare application developers and researchers easily manage and secure patient consent for the use of their data for medical care and research. That’s why we’re excited today to launch the Google Cloud Healthcare Consent Management API to Public Preview. The Healthcare Consent Management API gives healthcare application developers and clinical researchers a simple way to manage individuals’ consent of their health data. This is particularly important given the new and emerging virtual care and research scenarios related to COVID-19. For example, in healthcare, patients are using technologies like telemedicine to receive care from home. And, in life sciences, with so many in-person clinical trials put on hold, more researchers are conducting trials digitally to continue making strides in research and drug development. These “at home” clinical scenarios mean that healthcare systems and clinical researchers are increasingly relying on consumer data from new sources, such as wearables, medical devices (like blood pressure and glucose monitors), and other technologies. These new sources of data, while an encouraging step forward for the industry, also present new challenges, as both healthcare providers and researchers struggle with how to manage, protect, and obtain patient consent for their use. The Google Cloud Healthcare Consent Management API helps by making it easier to satisfy the requirements of existing and emerging privacy and consent frameworks while supporting the transparent and responsible incorporation of digital health data into patient care and research.“Responsibly managing health data is crucial to advancing healthcare and research outcomes, particularly as we explore new methods of delivering care and conducting research” said John Wilbanks, Chief Commons Officer at Sage Bionetworks. “For example, many people want to contribute to medical research or take advantage of new virtual care models, but they want assurances about how and by whom their information is accessed. Google Cloud’s Healthcare Consent Management API can simplify this technologically complex process. I look forward to leveraging the API in my own work, and to learning how to use tools like this to empower individuals with more granular control over their data.”  How the Google Cloud Healthcare Consent Management API worksThe Healthcare Consent Management API complements existing privacy frameworks and makes it easier for application developers to provide tools that empower patients to better track, modify, and revoke consent around the use of their data.To use the service, an organization creates their own isolated instance of the Healthcare Consent Management API, which includes that organization’s consent policies, executed consent agreements, and the metadata linking those policies and agreements to any relevant data. The actual user health and wellness data is then stored by the organization in their preferred datastores. As a part of the Google Cloud Healthcare service, the Healthcare Consent Management API supports HIPAA compliance, and data managed through its use is overseen by healthcare providers, application developers, and researchers under agreements between these organizations and their users.We are excited to introduce the Healthcare Consent Management API to complement existing frameworks, making data privacy and consent management easier to implement in emerging healthcare use cases. We invite you to explore the Public Preview today.Related ArticleAdvancing telehealth with AmwellOur new partnership with Amwell helps the healthcare industry transform for a world that is more reliant on telehealth.Read Article
Quelle: Google Cloud Platform

Introducing HTTP/gRPC server streaming for Cloud Run

We are excited to announce the availability of server-side HTTP streaming for your serverless applications running on Cloud Run (fully managed). With this enhanced networking capability,  your Cloud Run services can serve larger responses or stream partial responses to clients during the span of a single request, enabling quicker server response times for your applications.With this addition, Cloud Run can now:Send responses larger than the previous 32 MB limit.Run gRPC services with server-streaming RPCs and send partial responses in a single request—in addition to existing support for unary (non-streaming) RPCs.Respond with server-sent events (SSE), which you can consume from your frontend using the HTML5 EventSource API.Streaming responses help you develop applications that send partial responses to clients as the responses become available, so that your applications and websites can be more responsive. Without streaming support, all the responses must be computed in full before they can be sent to the client; this delays time to first byte (TTFB) performance of your applications. In the diagram below, three partial responses are incrementally sent to the gRPC client.Here are some example use cases for server-side HTTP streaming:Streaming large files (such as videos) from your serverless applicationsLong-running calculations that can report using a progress indicatorBatch jobs that can return intermediate or batched responsesLet’s try it: Serverless gRPC streamingStreaming support in Cloud Run brings significant performance improvements to a certain class of applications, and this is just the beginning—stay tuned as we work hard to enable more features in Cloud Run.We’ve developed a sample gRPC server application that you can deploy to your Google Cloud account in a single click and run a client to stream responses from the Cloud Run-based serverless application.Try out streaming support in Cloud Run and let us know what you think on Stack Overflow or on our issue tracker.
Quelle: Google Cloud Platform

New in Cloud Functions: languages, availability, portability, and more

Google Cloud Functions is a scalable pay-as-you-go Functions-as-a-Service (FaaS) platform that runs your code with zero server management. With its simple and easy-to-use developer experience, we’re excited to extend Cloud Functions so that you can now use it to build end-to-end solutions for several key use cases.Click to enlargeNamely, functions have emerged as a great fit for serverless application backends to integrate with third-party services and APIs, or for mobile or IoT backends. You can also use functions for real-time data processing systems, such as processing files as they are uploaded to Cloud Storage, or to handle real-time streams of events from Pub/Sub. Last, but not least, functions can serve intelligent applications like virtual assistants and chat bots, or perform video, image or sentiment analysis.Here’s an overview of the new Cloud Functions capabilities that you can now take advantage of.  New runtimes: .NET, Java and Ruby join Node.js, Python and GoWhether you use Console.WriteLine, console.log, fmt.Println, print or puts, Cloud Functions has you covered. Cloud Functions now supports six different languages with the following runtimes: Java 11, .NET Core 3.1, Ruby, Node.js (8, 10 and 12), and Python (3.7 and 3.8).New regionsCloud Functions is now available in 11 more regions, including Seoul, São Paulo, Sydney, bringing the total number of regions to 19. This is a significant improvement to the global availability of your Cloud Functions. For more details on available regions, see https://cloud.google.com/functions/docs/locations.Improved local developer experienceThe Cloud Functions team has released the Functions Frameworks: a set of open-source, idiomatic libraries for each of the Cloud Functions-supported languages. Functions Frameworks allow you to run, test and debug your function in your local environment, giving you the same behavior as production without needing to deploy.Function Frameworks also increase the overall portability of your functions. In addition to running locally, the frameworks are also suitable for deploying your function elsewhere as well. For example, using the frameworks with a Dockerfile or Buildpacks allows you to turn a single function into a complete container image that can then be deployed to a service like Cloud Run. This significantly improves the portability of your functions.Improved Cloud Functions UI experienceWe’ve redesigned the Cloud Functions UI at http://console.cloud.google.com/functions, including an improved inline code editor that’s suitable for use with larger screen sizes:Security enhancements with fine-grained controls We work hard to build strong security into all our products, and Cloud Functions is no different. One of the key capabilities Cloud Functions now provides is per-function identities, wherein individual functions within a project have their own identity. In addition, the feature allows for fine-grained control over which resources your function can access.Cost and scaling controlsWhether you want to reduce your overall serverless bill, or simply want to put safeguards in place to prevent cost overruns, here are some key capabilities we offer with Cloud Functions to meet your needs.Set maximum instancesMax instances in Cloud Functions is a feature that allows you to limit the degree to which your function will scale in response to incoming requests. Choosing the right number of maximum instances depends on your traffic and your desired request latency. Cloud Functions provides a Cloud Monitoring metric (cloudfunctions.googleapis.com/function/active_instances) that you can use to estimate the number of instances your function needs under normal circumstances.You can change the max instances value for Cloud Functions via the command line:Learn more about managing instances in Cloud Functions.Set budget alertsBudget alerts can provide an important early-warning signal of unexpected increases in your bill. Setting a budget alert is a straightforward process, and you can configure them to alert you via email or via Cloud Pub/Sub. That, in turn, can trigger a function, so you can handle the alert programmatically.Use labelsLabels allow you to assign a simple text value to a particular resource that you can then use to filter charges on your bill. For example, you may have an application that consists of several functions. By applying a consistent label to these resources, you can see the overall impact of this multi-function application on your bill. This will help identify areas of your Google Cloud usage that contribute the most to your bill and allow you to take targeted action on them. For more details on labels, see “Creating and managing labels”.Customer Use Case: IKEA RetailIKEA has been using serverless and Cloud Functions as a part of their digital transformation to fulfill IKEA’s vision: “To create a better everyday life for the many people.” To learn more about this, please check out this exciting demonstration from Matthew Lawson, Engineering Manager at IKEA Retail, on IKEA’s live-feed inventory management system.Try Cloud FunctionsThe Cloud Functions team is excited to bring all these new capabilities to you. Interested in learning more? Try one of these next steps:Get started with a quickstart and our free trial.Run your function locally with the Function FrameworksTurn your function into a container with the Google Cloud BuildpacksAnd at any time, feel free to give us feedback on your experience. We’re looking forward to seeing what you can build with Cloud Functions!Related ArticleIntroducing Java 11 on Google Cloud FunctionsYou can now write a Cloud Functions function in Java 11Read Article
Quelle: Google Cloud Platform

Toward automated tagging: bringing bulk metadata into Data Catalog

Data Catalog lets you ingest and edit business metadata through an interactive interface. It includes programmatic interfaces that can be used to automate your common tasks. Many enterprises have to define and collect a set of metadata using Data Catalog, so we’ll offer some best practices here on how to declare, create, and maintain this metadata in the long run. In our previous post, we looked at how tag templates can facilitate data discovery, governance, and quality control by describing a vocabulary for categorizing data assets. In this post, we’ll explore how to tag data using tag templates. Tagging refers to creating an instance of a tag template and assigning values to the fields of the template in order to classify a specific data asset. As of this writing, Data Catalog supports three storage back ends: BigQuery, Cloud Storage and Pub/Sub. We’ll focus here on tagging assets that are stored on those back ends, such as tables, columns, files, and message topics. We’ll describe three usage models that are suitable for tagging data within a data lake and data warehouse environment: provisioning of a new data source, processing derived data, and updating tags and templates. For each scenario, you’ll see our suggested approach for tagging data at scale.  1. Provisioning data sourcesProvisioning a data source typically entails several activities: creating tables or files depending on the storage back end, populating them with some initial data, and setting access permissions on those resources. We add one more activity to this list: tagging the newly created resources in Data Catalog. Here’s what that step entails. Tagging a data source requires a domain expert who understands both the meaning of the tag templates to be used and the semantics of the data in the data source. Based on their knowledge, the domain expert chooses which templates to attach as well as what type of tag to create from those templates. It is important for a human to be in the loop, given that many decisions rely on the accuracy of the tags. We’ve observed two types of tags based on our work with clients. One type is referred to as static because the field values are known ahead of time and are expected to change only infrequently. The other type is referred to as dynamic because the field values change on a regular basis based on the contents of the underlying data. An example of a static tag is the collection of data governance fields that include data_domain, data confidentiality, and data_retention. The value of those fields are determined by an organization’s data usage policies. They are typically known by the time the data source is created and they do not change frequently. An example of a dynamic tag is the collection of data quality fields, such as number_values, unique_values, min_value, and max_value. Those field values are expected to change frequently whenever a new load runs or modifications are made to the data source. In addition to these differences, static tags also have a cascade property that indicates how their fields should be propagated from source to derivative data. (We’ll expand on this concept in a later section.) By contrast, dynamic tags have a query expression and a refresh property to indicate the query that should be used to calculate the field values and the frequency by which they should be recalculated. An example of a config for a static tag is shown in the first code snippet, and one for a dynamic tag is shown in the second.YAML-based static tag configYAML-based dynamic tag configAs mentioned earlier, a domain expert provides the inputs to those configs when they are setting up the tagging for the data source. More specifically, they first select the templates to attach to the data source. Secondly, they choose the tag type to use, namely static or dynamic. Thirdly, they input the values of each field and their cascade setting if the type is static, or the query expression and refresh setting if the type is dynamic. These inputs are provided through a UI so that the domain expert doesn’t need to write raw YAML files.  Once the YAML files are generated, a tool parses the configs and creates the actual tags in Data Catalog based on the specifications. The tool also schedules the recalculation of dynamic tags according to the refresh settings. While a domain expert is needed for the initial inputs, the actual tagging tasks can be completely automated. We recommend following this approach so that newly created data sources are not only tagged upon launch, but tags are maintained over time without the need for manual labor. 2. Processing derivative dataIn addition to tagging data sources, it’s important to be able to tag derivative data at scale. We define derivative data in broad terms, as any piece of data that is created from a transformation of one or more data sources. This type of data is particularly prevalent in data lake and warehousing scenarios where data products are routinely derived from various data sources. The tags for derivative data should consist of the origin data sources and the transformation types applied to the data. The origin data sources’ URIs are stored in the tag and one or more transformation types are stored in the tag—namely aggregation, anonymization, normalization, etc. We recommend baking the tag creation logic into the pipeline that generates the derived data. This is doable with Airflow DAGs and Beam pipelines. For example, if a data pipeline is joining two data sources, aggregating the results and storing them into a table, you can create a tag on the result table with references to the two origin data sources and aggregation:true. You can see this code snippet of a Beam pipeline that creates such a tag:Beam pipeline with tagging logicOnce you’ve tagged derivative data with its origin data sources, you can use this information to propagate the static tags that are attached to those origin data sources. This is where the cascade property comes into play, which indicates which fields should be propagated to their derivative data. An example of the cascade property is shown in the first code snippet above, where the data_domain and data_confidentiality fields are both to be propagated, whereas the data_retention field is not. This means that any derived tables in BigQuery will be tagged with data_domain:HR and data_confidentiality:CONFIDENTIAL using the dg_template. 3. Handling updatesThere are several scenarios that require update capabilities for both tags and templates. For example, if a business analyst discovers an error in a tag, one or more values need to be corrected. If a new data usage policy gets adopted, new fields may need to be added to a template and existing fields renamed or removed. We provide configs for tag and template updates, as shown in the figures below. The tag update config specifies the current and new values for each field that is changing. The tool processes the config and updates the values of the fields in the tag based on the specification. If the updated tag is static, the tool also propagates the changes to the same tags on derivative data. The template update config specifies the field name, field type, and any enum value changes. The tool processes the update by first determining the nature of the changes. As of this writing, Data Catalog supports field additions and deletions to templates as well as enum value additions, but field renamings or type changes are not yet supported. As a result, the tool modifies the existing template if a simple addition or deletion is requested. Otherwise, it has to recreate the entire template and all of its dependent tags.YAML-based tag update configYAML-based template update config We’ve started prototyping these approaches to release an open-source tool that automates many tasks involved in creating and maintaining tags in Data Catalog in accordance with our proposed usage model. Keep an eye out for that. In the meantime, learn more about Data Catalog tagging.
Quelle: Google Cloud Platform

Gauge the effectiveness of your DevOps organization running in Google Cloud

Editor’s note: There are many ways to skin the DevOps cat. Google Cloud Developer Programs Engineer Dina Graves Portman recently wrote about how to evaluate your DevOps effectiveness using the open-source Four Keys project. Here, Google Customer Engineer Brian Kaufman shows you how to do the same thing, but for an application that runs entirely on Google Cloud.Many organizations aspire to become true, high-functioning DevOps shops, but it can be hard to know where you stand. According to DevOps Research and Assessment, or DORA, you can prioritize just four metrics to measure the effectiveness of your DevOps organization—two to measure speed, and two to measure stability:Speed1. Lead Time for Changes – Code commit to code in production2. Deployment Frequency – How often you push codeStability3. Change Failure Rate – Rate of deployment failures in production that require immediate remedy. (Rollback or manual change)4. Time to Restore Service (MTTR) – Mean time to recovery. In this post, we present a methodology to collect these four metrics from software delivery pipelines and applications deployed in Google Cloud. You can then use those metrics to rate your overall practice effectiveness, and baseline your organization’s performance against DORA industry benchmarks, and determine whether you’re an Elite, High, Medium or Low performer.Click to enlargeLet’s take a look at how to do this in practice, with a sample architecture running on Google Cloud. Services and reference architectureTo get started, we create a CI/CD pipeline with the following cloud services: Github Code RepoCloud Build, a container-based CI/CD Tool)Container Registry Google Kubernetes Engine (GKE)Cloud Load Balancing, used as an Ingress Controller for GKE)Cloud Uptime Checks, for synthetic application monitoringCloud MonitoringCloud FunctionsPub/Sub, used as a message bus to connect Alerts to Cloud Functions)These are combined into the reference architecture below. Note that all of these Google Cloud services are integrated with Cloud Monitoring. As such, there’s nothing in particular that you need to set up to receive service logs, and many of these services have built-in metrics that we’ll use in this post.Google Cloud Platform CI/CD pipeline and application topologyMeasuring SpeedTo measure our two speed metrics—deployment frequency and lead time to commit—we instrument Cloud Build, which is a continuous integration and continuous delivery tool. As a container-based CI/CD tool, Cloud Build lets you load a series of Google managed orcommunity managed Cloud Buildersto manipulate your code or interact with internal and external services during the build/deployment process. Upon firing a build trigger, Cloud Build reaches into our Git Repository for our source code, creates a container image artifact that it pushes to the container registry, and then deploys the container image to a GKE cluster.You can also import your own cloud builder container in the process and insert it as the final build step, to determine the time from commit to deployment as well as whether this is a rollback deployment. For this example, we’ve created a custom container to be used as the last build step that:Retrieves the payload binding for the commit timestamp accessed by the variable $(push.repository.pushed_at) and compares it against the current timestamp to calculate lead time. The payload binding variable is used when we create the trigger and is referenced by a custom variable, $_MERGE_TIME in cloudbould.yaml. Reaches into the source repo to get the commit ID of the latest commit on the master branch and compares it to the current commit ID of the build to determine if it is a rollback or a match. You can find a reference Cloud Build config yaml here that shows each build step described above. If you’re using a non-built-in variable like ’$_MERGE_TIME’ payload binding in your config file, you need to specify the variable map when you setup the cloud build trigger to the $(push.repository.pushed_at) value.You can find the custom cloud builder container used here. After the build step for this container runs the following is outputted to the Cloud Build logs, which are fed automatically into Cloud Monitoring. Notice the commit ID, Rollback value, and LeadTime values which are written to the logs from our custom cloud builder:Next we can create a log-based metric in Cloud Logging to absorb these custom values. Log-based metrics can be based on filters for specific log entries.Once we have our specific log entries filter, we can use regular expressions assigned to a particular piece of the output logs to capture specific sections of the log entry into metrics. In the screenshots below we created labels for the commit name and rollback value that will attach to the LeadTime value that shows up in the ‘textPayload’ field of our log. We use the following regular expressions:Metric Value:Create log based metric and labelsLead Time for ChangesOnce we have the above metric and labels created from our Cloud Build log we can access it in Cloud Operations Metrics explorer via the metric label ‘logging/user/dorametics’ (‘DoraMetrics’ was the name we gave our log-based metric). The value of the metric will be the LeadTime as extracted from the regular expression above, with Rollbacks filtered out. We use the median or 50th percentile.Deployment FrequencyNow that we have the lead time for each commit, we can determine the frequency of deployments by just counting the number of lead times we recorded in a window!Measuring stability Change Failure CountTo determine the number of software rollbacks that were performed, we can look at our Deployment Frequency and filter for ‘Rollback=True’ metrics. This gives us a count of the total rollbacks performed. If we wanted to determine the Change Failure Rate we would use data collected in this chart and divide it by the Deployment Frequency metric collected above for the same window.Mean-Time-To-Resolution (MTTR)In typical enterprise environments there are incident response systems that allow you to determine when an issue was reported and when it is ultimately resolved. Assuming these times could be queried, MTTR could be determined by the average time between the reported and resolved timestamps of the issues. In this blog we use automation to alert and graph issues, which allows us to gather more accurate service disruption metrics. Our strategy involves the use of Service Level Objectives (SLO), which represents  Service Level Indicators (SLI)  that we’ve determined represent our customers’ happiness with our application and an objective. When we violate an SLO we consider our mean-time-to-restore service is the total time it takes to detect, mitigate, and resolve a problem until we are back in compliance with the SLO.MTTR and customer satisfactionFor the purposes of simplicity we’ve highlighted one metric we feel represents our customer satisfaction: overall HTTP response code errors from our website. The ratio of this metric against the total response codes sent over a given time window constitutes our Service Level Indicator (SLI). For total errors we monitor response codes returned from our front-end load balancer, which is set up as an ingress controller in our GKE cluster.Metric Used: loadbalancing.googleapis.com/https/request_count Group by response_codeUsing this metric above we can build our SLI and wrap it into an SLO that represents the customer satisfaction observed over a longer time window. Using the SLO API, we create custom SLOs that represent the level of customer satisfaction we want to monitor, where being in violation of that SLO indicates an issue. There’s a great tutorial on how to create custom SLOs and services here. In this example, we’ve created a custom service to represent our application and an SLO for HTTP LB response codes (code). It assumes a quality of service level in which 98% of responses from the load balancer should not be errors in a given day. Doing this automatically creates an error budget of 2% over 24 hours. Now, when it comes to monitoring for MTTR, we have a metric (SLI) that’s attached to a service level SLO that represents quality of service over a given window of time. The failure of the SLO is simulated in the screenshot below:Next, we set up an alert policy that fires when we are in danger of violating this SLO. This also starts a timer to calculate the time-to-resolution. What we’re measuring here is referred to as ‘burn rate’—how much of our error budget (2% of errors over 24 hours) we are eating up with the current SLI metic. The window we measure for our alert is much smaller than our entire SLO so when the SLI has moved back within compliance of a threshold, another alert fires, indicating the incident has cleared. For more information on setting up alerting policies please visit this page. You can also send out alerts through a variety of channels, allowing you to integrate into existing ticketing or messaging systems to record the MTTR in a way that makes sense for your organization. For our purposes we integrate with the Pub/Sub message bus channel, sending the alerts to a cloud function that performs the necessary charting calculators.In the message from the clearing alert we see the JSON payload has the started_at and ended_at timestamps. We use these timestamps in our cloud function to calculate the time to resolve the issue and then output it to the logs.Here is the entire Pub/Sub message sent to Cloud Functions:Here is the cloud function connected to the same Pub/Sub topic as the Alert:The results in the following messages sent to Cloud Functions logs:The final step is to create another log-based metric to pick up the ‘Time to Resolve’ value that we print to our cloud functions log. We do so with this regex expression Resolve:s([0-9]+);Now the metric is available in Cloud Operations.ConclusionWe’ve shown above how you can create custom cloud builders in Cloud Build to generate metrics relating to deployment frequency, mean-time-to-deployment and rollback that will appear in Cloud Operations logs. We’ve also shown you how to use SLOs and SLIs to generate and push alerts to your Cloud Functions logs. We’ve used log-based metrics to pull our metrics out of the logs and chart them. These metrics can be used to evaluate the effectiveness of your organization’s software development and delivery pipelines over time as well as help you evaluate your performance amongst the greater DevOps community. Where does your organization land? For more inspiration, here is some further reference material to help you measure the effectiveness of your own DevOps organization:Google Cloud Application Modernization Program(blog)Setting SLOs: a step-by-step guide (blog)Setting SLOs: observability using custom metrics (blog)Concepts in Service Monitoring(documentation)Working with the SLO API (documentation)How to create SLOs in the GCP Console (video)How to create SLOs at scale with the SLO API (video)How to create SLOs using custom metrics (video)GitHub SLO API Code used for BlogDORA Quick CheckThe 4 Keys Project for DORA Metric Ingression into BigQuery21 new ways we’re improving observability with Cloud Ops (blog)Related ArticleAre you an Elite DevOps performer? Find out with the Four Keys ProjectLearn how the Four Keys open source project lets you gauge your DevOps performance according to DORA metrics.Read Article
Quelle: Google Cloud Platform