Opening up Google's Windows management tools

Managing a global fleet of Windows desktops, laptops, and servers for Google’s internal teams can be tricky, with a constant stream of new tools, high expectations, and stringent organizational needs for secure, code-based, scalable administration. Add in a globally distributed business and extended work-from-home requirements, and you have a recipe for potential trouble.Today we’d like to walk you through some of the tools that the Windows Operations (WinOps) team uses at Google, and why we made (and open-sourced) them. Our team is constantly working to improve the process we use to manage our client fleet of laptops and desktops, and we’ve spent the past several years building open source, infrastructure-as-code tools to do just that. Now that we’re all working from home, these choices have enabled us to keep operating at scale remotely. Let’s dig into a few common Windows administrative challenges and how our open tools can help.Challenges with scaleWhen you manage Windows in a large, globally distributed business environment, problems of scalability are front and center. Many popular administrative tools are GUI-based, which makes them easy to learn but difficult to scale and integrate. An administrator is often limited to the functionality built into the product by its vendor. Many times, core management suites lack qualities that we would consider critical in a reliable production environment, including the ability to: Peer review edits and to roll changes backward and forward on demand Implement platform testing, with support for automation pipelines Integrate seamlessly with tooling that also manages our other major platforms Because they rely on explicit network-level access, many of these products also depend heavily on a well defined corporate network, with clear distinctions between inside and outside .At Google, we’ve been rethinking the way we manage Windows to address these limitations. We have built several tools that have helped us scale our environment globally and enabled us to consistently support Google employees, even when major unexpected events happen.Open source products are increasingly a key to our success. With the right knowledge and investment, open source tools can be extended and tailored to our environment in ways other applications simply can’t. Our designs also focus heavily on configuration as code, rather than user interfaces: Code-based infrastructure provides optimal integration with other internal systems, and enables us to manage our fleet in ways that are audited, peer reviewed, and thoroughly tested. Finally, the principles of the BeyondCorp model dictate that our management layer operates from anywhere in the world, rather than only inside the company’s private network.Let’s dig into some of these tools, organized by what they help us get done.Prepping Windows devicesGlazier, a tool for imaging, marked our team’s first foray into open source. This Python-based tool is at the core of our Windows device preparation process. It focuses on text-based configuration, which we can manage using a version control system. Much like code, we can use the flexible format to write automated tests for our configuration files, and trivially roll our deployments back and forward. File distribution is based around HTTPS, making it globally scalable and easy to proxy. Glazier supports modular actions (such as installing host certificates or gathering installation metrics), making it simple to extend with new capabilities over time as our environment changes.Secure, modular imaging with Glazier helps prepare devicesTraditional imaging tends to rely heavily on network trust and presence inside a secure perimeter. Systems like PXE, Active Directory, Group Policy, and System Center Configuration Manager require you to either set up a device on a trusted network segment or have sensitive infrastructure exposed to the open internet. The Fresnel project addressed these limitations by making it possible to deliver boot media securely to our employees, anywhere in the world. We then integrated it with Glazier, enabling our imaging process to obtain critical files required to bootstrap an image from any network. The result was an imaging process that could be started and completed securely from anywhere, on any network, which aligns with our broader BeyondCorp security model. Fresnel enables imaging from any network in the worldThe remote imaging and provisioning process included several other network trust dependencies that we had to resolve. Puppet provides the basis of our configuration management stack, while software delivery now leverages GooGet, an open source repository platform for Windows. GooGet’s open package format lends itself well to automation, while its simple, APT-like distribution mechanism is able to scale our package deployments globally. For both Puppet and GooGet the underlying use of HTTPS provides security and accessibility from any network. We also utilize OSQuery as a means of collecting distributed host state and inventory.GooGet helps us automate package distribution and deploymentOur infrastructure still has dependencies on classic Active Directory (AD), and the domain join process was a particularly unique challenge for hosts that do not bootstrap from a trusted network. This led to the Splice project, which uses the Windows offline domain join API and Google Cloud services to enable domain joining from any network. Splice enables us to apply flexible business logic to the traditionally rigid domain join process. With the ability to implement custom authentication and authorization models, host inventory checks, and naming rules not typically available in AD environments, this project has given us the flexibility to extend our domain well beyond the classic network perimeter.Splice helps us join new devices onto our Active Directory domain from anywhereMaintaining our fleetDeployment is only the beginning of the device lifecycle; we also need to be able to manage our active fleet and keep it secure.The Windows internal update mechanism is generally sufficient to keep the operating system patched, but we also wanted to be able to exercise some control over updates hitting our fleet. Specifically, we need the ability to rapidly deploy a critical update, or to postpone installing a problematic one. Enter Cabbie, a Windows service that builds upon Windows APIs to provide an additional management layer for patching. Cabbie gives us centralized control over the update agent on each machine in our fleet using our existing configuration management stack.Centralized patch control using configuration managementWe also have Windows servers to manage, and these hosts present unique challenges, distinct from those we face with our client fleet. One such challenge is how to schedule routine maintenance in a way that’s easily configurable, automated, and can be integrated with our various agents like Cabbie. This led to Aukera, a simple yet flexible service for defining recurring maintenance windows, establishing periods where a device can safely perform one or more automated activities that might otherwise be disruptive.Building for the futureOur team was fortunate to have started  many of these projects well before the Spring of 2020, when many of us had to abruptly leave our offices behind. This was due, in part, to embracing the idea of building a Windows fleet for the future: one where every network is part of our company network. Whether our users are working at a business office, from home, or on a virtual machine in a Cloud data center, our tools must be flexible, scalable, reliable, and manageable to meet their needs.Most of the challenges we’ve discussed here are not unique to Google. Companies of all shapes and sizes can benefit from increasing security, scalability, and flexibility in their networks. Our goal in opening up these projects, and sharing the principles behind them, is to assist our peers in the Windows community to build stronger solutions for their own businesses.To learn more about our wider fleet management strategy and operations, read our “Fleet Management at Scale” white paper.
Quelle: Google Cloud Platform

Bare Metal Solution: new regions, new servers, and new certifications

Not a lot of things are certain in 2021, but one thing you can count on is Google Cloud’s commitment to our customers and to being a leader in open cloud. Supporting multiple workloads and meeting customers where they are is part of that open cloud commitment—and so is Bare Metal Solution, our solution to run Oracle database workloads on Google Cloud. As we continue developing Bare Metal Solution to meet your needs and meet you where you are, we’re announcing three Bare Metal Solution enhancements: Availability in Montreal, our 10th region;A new, smaller 8-core server; Support for PCI DSS and HIPAA. In 2021, we’ll continue to build on the momentum of Google Cloud’s Bare Metal Solution, which enables businesses to run Oracle databases close to Google Cloud with extremely low latency. See how StubHub is using Bare Metal Solution to reduce their dependency on Oracle, lower overall costs, and improve performance.Related ArticleBare Metal Solution: Coming to a Google Cloud data center near youWith Bare Metal Solution, now you can run specialized databases in five new Google Cloud regions.Read ArticleNew regions, to meet you where you areLast year, we launched Bare Metal Solution in five regions and added four more throughout the year. With the launch of Bare Metal Solution in Montreal today, we’re kicking off this year by bringing Bare Metal Solution to Canada to provide our customers with local availability. We’ll launch Bare Metal Solution in a slew of other new regions in 2021 (and even some dual region availability). We recognize the need for local options for our customers, so please reach out to your sales rep if you’re interested in Bare Metal Solution, and we can work to get you on our roadmap. Below, in green, are our 10 GA regions:A smaller server, to help you save on licensing and hardware costsIn order to help you right-size your workloads and reduce costs, we’ve added a new, smaller 8-core server to our lineup in all of our regions. This new 8-core server, which leverages our state-of-the-art compute, storage, and networking, means a migration to Bare Metal Solution can help shrink your hardware footprint and thus potentially reduce Oracle licensing costs, which are often dependent on core count. Here’s our full lineup of Bare Metal Servers, available in all of our regions:PCI DSS and HIPAA, to support your enterprise workloadLast, but not least, Bare Metal Solution can now help support customer compliance with PCI DSS and HIPAA. Support for PCI DSS will allow our retail partners to bring their customers’ credit card data and run their workloads according to the Payment Card Industry Data Security Standards (PCI DSS). Support for HIPAA similarly means our healthcare partners can bring their customers’ healthcare data and run their workloads according to the requirements of the Health Insurance Portability and Accountability Act (HIPAA). As we expand to new regions and work to better enable specific industries, you can expect future announcements of both regional and industry-related certifications.
Quelle: Google Cloud Platform

How leading enterprises use API analytics to make effective decisions

Our “State of the API Economy 2021” report indicates that despite the many financial pressures and disruptions wrought by COVID-19, 75% of companies continued focusing on their digital transformation initiatives, and almost two-thirds of those companies actually increased their investments and efforts.Because APIs are how software talks to software and how developers leverage data and functionality in different systems, they are at the center of these digital transformation initiatives. As organizations across the world have shifted how they do business, IT organizations have scrambled to meet demands for new applications—and to do more with APIs.  API analytics usage is seeing an explosive growthLeading businesses use API analytics to not only inform new strategies but also align leadership goals and outcomes. Because executive sponsors tend to support initiatives that produce tangible results, teams can use API metrics to unite leaders around digital strategies and justify continued platform-level funding for the API program. This demand is responsible for surging API analytics usage. Among Apigee customers, API analytics adoption increased by 75% from 2019 to 2020—growth that reflects organizations’ broader need to holistically assess the business and digital transformation impacts of API programs.API analytics point to opportunities To remain competitive in today’s hyper-connected world, one key question needs to be answered: “How do we drive impact with our digital initiatives while also making sure we’re putting our limited resources to the best use?“ API analytics support API providers in this endeavor by helping them to determine which digital assets are key drivers of business value and to create a strategic view of digital interactions. By tracking which APIs are being consumed by certain communities of developers, which APIs are powering the most popular apps, and how performant APIs are, organizations can understand which digital assets need optimization or iteration, which digital assets are being leveraged for new uses or by new communities, which digital assets are driving revenue, and more. Beyond helping enterprises answer questions they’ve already identified, API analytics also surface patterns that may be unexpected—and that help both IT and business leaders refine the KPIs they use analytics to generate. If an API becomes popular with developers in a new vertical for example, that may persuade the enterprise to focus on KPIs like adoption among these specific developers, rather than on overall adoption.  Best Practices for defining effective API metricsWhen our survey respondents were asked how API usage at their company is currently measured, top responses included metrics focused on API performance (35%), on traditional IT-centric numbers (22%), and on consumption of APIs (21%). But when asked about preference for API measurement, business impact topped the list (43%). The data suggests that API effectiveness metrics vary across geography and industry, with measurement by business impact or API performance serving as a collective north star.Establishing a framework to connect digital investments directly to metrics and key performance indicators (KPIs) is among the most important areas of strategic alignment for ensuring a successful API strategy. Successful programs clearly define and measure a combination of business metrics, such as direct or indirect revenue, and API consumption metrics, such as API traffic, the number of apps built atop given APIs, and the number of active developers leveraging APIs. Good KPIs are a cornerstone of an effective API analytics effort, but they can be difficult to define. Here are some effective KPIs to help position an API program for success.Operational KPIsAverage and max call latency: P1 latency, or elapsed time, is an important metric that impacts customer experiences. Breaking down this KPI into detailed metrics (e.g., networking times, server process and upload and download speeds) can help provide additional insights for measuring the performance of APIs–and thus of the apps that rely on them.Total pass and error rates: Measuring success rates in terms of the number of API calls that trigger non-200 status codes can help organizations to track how buggy or error-prone an API is. In order to track total pass and error rates, it’s important to understand what type of errors are surfacing during API usage.API SLA: While one of the most basic metrics, API Service Level Agreements (SLA) is the gold standard for measuring the availability of a service. Many enterprise SLAs leave software providers little-to-no room for error. Providing this level of service means a provider’s upstream APIs need to be running–and that requires API monitoring and analytics to maintain performance and quickly troubleshoot any problems.  Adoption KPIsDevelopers: This target is commonly intended to improve API adoption. Enterprises should consider using this metric in combination with other metrics that confirm a given API’s business utility.Onboarding: The portal that application developers use to access APIs should ideally feature an automated approval process, including self-service onboarding capabilities that let users register their apps, obtain keys, access dashboards, discover APIs, and so on. The ease and speed with which developers can navigate this process can significantly impact the adoption of an enterprise’s API program. Just as consumers are unlikely to adopt a service if too much friction is involved, developers are less likely to adopt APIs that cannot be easily and securely accessed. API traffic: This target can help API programs develop a strong DevOps culture by continuously monitoring, improving, and driving value through APIs. Enterprises should consider coupling this target with related metrics up and down the value chain, including reliability and scalability of back-ends.API product adoption: Retention and churn can identify key patterns in API adoption. A product with high retention is closer to finding its market fit than a product with a churn issue, for example. Unlike subscription retention, product retention tracks the actual usage of a product such as an API. Business Impact KPIsDirect and indirect revenue: These targets track the different ways APIs contribute to revenue. Some APIs provide access to particularly rare and valuable datasets or particularly useful and hard-to-replicate functionality—and in these cases, enterprises sometimes directly monetize APIs, offering them to partners and external developers as paid services/products. Often, however, an API can generate more value if enterprises focus on adoption rather than upfront revenue. A retailer won’t make much money charging partners for access to a store locator API, for example, but if they make the API freely available, partners are more likely to use it to add functionality to their apps and the retailer is more likely to benefit because its business is exposed to more people through more digital experiences. It is important to be able to track both direct revenue from monetized APIs and forms of indirect value, such as how adoption of an API among certain developers supports those developers’ revenue-generating apps. Likewise, it is important to be able to adjust pricing models to find the right blend; analytics can reveal, for example, whether an API is most valuable if offered for free, if offered for a flat subscription rate, or if offered in a “freemium” model with free base access and paid tiers. Partners: This target can be used to accelerate partner outreach, drive adoption, and demonstrate success to existing business units.Cost: Enterprises can reduce costs by reusing APIs rather than initiating new custom integration efforts for each new project. When internal developers use standardized APIs to connect to existing data and services, the APIs become digital assets that can be leveraged again and again for new use cases, typically with little if any overhead costs. By tracking API usage, enterprises can identify instances in which expense that otherwise would have gone to new integration projects has been eliminated thanks to reusable APIs. Likewise, because APIs automate and accelerate many processes, enterprises can identify how specific APIs contribute to faster development cycles and faster completion of business processes–and how many resources are saved in the process.  API analytics is at the core of successful API programsComprehensive monitoring and robust analytics efforts for API programs are among the most important ways to make data-driven business decisions. For an enterprise unsure how to scale its API program or uncertain about which next steps to take, analytics may literally be the difference-maker, providing insights that illuminate previously hidden opportunities, remove ambiguity, drive consensus, and help the business grow.Citrix is among the Google Cloud customers using Apigee’s monitoring and analytics solutions to proactively monitor the performance, availability, and security health of their APIs. “Apigee has a lot of built-in analytics that run automatically on every API, and Citrix can track any custom metric it wants. We’re gaining real-time visibility into our APIs, and that is helping us grow a strong API program for both internal and external developers.” says Adam Brancato, senior manager of customer apps at Citrix. When monitoring and analytics tools are integrated directly, rather than bolted on, the platform managing APIs is the same platform capturing data—which means the data can be acted on more easily and in near-real time. A full lifecycle API management solution such as Apigee provides near real-time monitoring and analytics insights that enable API teams to measure the health, usage, and adoption of their API, while also offering the ability to diagnose and resolve problems faster. The solution also enables teams to keep abreast of all essential aspects of their API-powered digital business.Want to learn more? The “State of API Economy 2021*” report describes how digital transformation initiatives evolved throughout 2020, as well as where they’re headed in the years to come. Read the full report*This report is based on Google Cloud’s Apigee API Management Platform usage data, Apigee customer case studies, and analysis of several third-party surveys conducted with technology leaders from enterprises with 1,500 or more employees, across the United States, United Kingdom, Germany, France, South Korea, Indonesia, Australia, and New Zealand.Related ArticleTop 5 trends for API-powered digital transformation in 2021Google Cloud’s State of APIs report investigates digital transformation in 2020 and where trends point in 2021 and beyond.Read Article
Quelle: Google Cloud Platform

How Cloud Storage delivers 11 nines of durability—and how you can help

One of the most fundamental aspects of any storage solution is durability—how well is your data protected from loss or corruption? And that can feel especially important for a cloud environment. Cloud Storage has been designed for at least 99.999999999% annual durability, or 11 nines. That means that even with one billion objects, you would likely go a hundred years without losing a single one! We take achieving our durability targets very seriously. In this post, we’ll explore the top ways we protect Cloud Storage data. At the same time, data protection is ultimately a shared responsibility (the most common cause of data loss is accidental deletion by a user or storage administrator), so we’ll provide best practices to help protect your data against risks like natural disasters and user errors.Physical durabilityMost people think about durability in the context of protecting against network, server, and storage hardware failures.At Google, our philosophy is that software is ultimately the best way to protect against hardware failures. This allows us to attain higher reliability at an attractive cost, instead of depending on exotic hardware solutions. We assume hardware will fail all the time—because it does! But that doesn’t mean durability has to suffer.To store an object in Cloud Storage, we break it up into a number of ‘data chunks’, which we place on different servers with different power sources. We also create a number of ‘code chunks’ for redundancy. In the event of a hardware failure (e.g., server, disk), we use data and code chunks to reconstruct the entire object. This technique is called erasure coding. In addition, we store several copies of the metadata needed to find and read the object, so that if one or more metadata servers fails, we can continue to access the object.The key requirement here is that we always store data redundantly across multiple availability zones before a write is acknowledged as successful. The encodings we use provide sufficient redundancy to support a target of more than 11 nines of durability against a hardware failure. Once stored, we regularly verify checksums to guard data at rest from certain types of data errors. In the case of a checksum mismatch, data is automatically repaired using the redundancy present in our encodings.Best practice: use dual-region or multi-region locationsThese layers of protection against physical durability risks are well and good, but they may not protect against substantial physical destruction of a region—think acts of war, an asteroid hit, or other large-scale disasters.Cloud Storage’s 11 nines durability target applies to a single region. To go further and protect against natural disasters that could wipe out an entire region, consider storing your most important data in dual-region or multi-region buckets. These buckets automatically ensure redundancy of your data across geographic regions. Using these buckets requires no additional configuration or API changes to your applications, while providing added durability against very rare, but potentially catastrophic, events. As an added benefit, these location types also come with significantly higher availability SLAs, because we can transparently serve your objects from more than one location if a region is temporarily inaccessible.Durability in transitAnother class of durability risks concerns corruption to data in transit. This could be data transferred across networks within the Cloud Storage service itself or when uploading or downloading objects to/from Cloud Storage.To protect against this source of corruption, data in transit within Cloud Storage is designed to be always checksum-protected, without exception. In the case of a checksum-validation error, the request is automatically retried, or an error is returned, depending on the circumstances.Best practice: use checksums for uploads and downloadsWhile Google Cloud checksums all Cloud Storage objects that travel within our service, to achieve end-to-end protection, we recommend that you provide checksums when you upload your data to Cloud Storage, and validate these checksums on the client when you download an object.Human-induced durability risksArguably the biggest risk of data loss is due to human error—not only errors made by us as developers and operators of the service, but also errors made by Cloud Storage users!Software bugs are potentially the single biggest risk to data durability. To avoid durability loss from software bugs, we take steps to avoid introducing data-corrupting or data-erasing bugs in the first place. We then maintain safeguards to detect these types of bugs quickly, with the aim of catching them before durability degradation turns into durability loss.To catch bugs up front, we only release a new version of Cloud Storage to production after it passes a large set of integration tests. These include exercising a variety of edge-case failure scenarios such as an availability zone going down, and comparing the behaviors of data encoding and placement APIs to previous versions to screen for regressions.Once a new software release is approved, we roll out upgrades in stages by availability zone, starting with a very limited initial area of impact and slowly ramping up until it is in widespread use. This allows us to catch issues before they have a large impact and while there are still additional copies of data (or a sufficient number of erasure code chunks) from which to recover, if needed. These software rollouts are monitored closely with plans in place for quick rollbacks, if necessary.There’s a lot you can do, too, to protect your data from being lost.Best practice: turn on object versioningOne of the most common sources of data loss is accidental deletion of data by a storage administrator or end-user. When you turn on object versioning, Cloud Storage preserves deleted objects in case you need to restore them at a later time. By configuring Object Lifecycle Management policies, you can limit how long you keep versioned objects before they are permanently deleted in order to better control your storage costs.Best practice: back up your dataCloud Storage’s 11-nines durability target does not obviate the need to back up your data. For example, consider what a malicious hacker might do if they obtained access to your Cloud Storage account. Depending on your goals, a backup may be a second data copy in another region or cloud, on-premises, or even physically isolated with an air gap on tape or disk.Best practice: use data access retention policies and audit logsFor long-term data retention, use the Cloud Storage bucket lock feature to set data retention policies and ensure data is locked for specific periods of time. Doing so prevents accidental modification/deletion, and when combined with data access audit logging, can satisfyregulatory and compliance requirements such as FINRA, SEC, and CFTC and certain health care industry retention regulationsBest practice: use role-based access control policiesYou can limit the blast radius of malicious hackers and accidental deletions by ensuring that IAM data access control policies follow the principles of separation of duties and least privilege. For example, separate those with the ability to create buckets from those who can delete projects.Encryption keys and durabilityAll Cloud Storage data is designed to always be encrypted at rest and in transit within the cloud. Because objects are unreadable without their encryption keys, the loss of encryption keys is a significant risk to durability—after all, what use is highly durable data if you can’t read it? With Cloud Storage, you have three choices for key management: 1) trust Google to manage the encryption keys for you, 2) use Customer Managed Encryption Keys (CMEK) with Cloud KMS, or 3) use Customer Supplied Encryption Keys (CSEK) with an external key server.Google takes similar steps as described earlier (including erasure coding and consistency checking) to protect the durability of the encryption keys under its control.Best practice: safeguard your encryption keysBy choosing either CMEK or CSEK to manage your keys, you take direct control of managing your own keys. It is vital in these cases that you also protect your keys in a manner that also provides at least 11 nines of durability. For CSEK, this means maintaining off-site backups of your keys so that you have a path to recovery even if your keys are lost or corrupted in some way. If such precautions are not taken, the durability of the encryption keys will determine the durability of the data.Going beyond 11 ninesGoogle Cloud takes the responsibility of protecting your data extremely seriously. In practice, the numerous techniques outlined here have allowed Cloud Storage to exceed 11 nines of annual durability to date. Add to that the best practices we shared in this guide, and you’ll help to ensure that your data is here when you need it—whether that be later today or decades in the future. To get started, check out this comprehensive collection of Cloud Storage how-to guides.Thanks to Dean Hildebrand, Technical Director, Office of the CTO, who is a coauthor of the document on which this post is based.
Quelle: Google Cloud Platform

Introducing Sqlcommenter: An open source ORM auto-instrumentation library

Object-relational mapping(ORM) helps developers to write queries using an object-oriented paradigm, which integrates naturally with application code in their preferred programming language. Many full-stack developers rely on ORM tools to write database code in their applications,  but since the SQL statements are generated by the ORM libraries, it can be harder for application developers to understand the application code resulting in slow query. The following example shows a snippet of code where 2 lines of Django application code are translated by an ORM library to a single SQL statement.Introducing SqlcommenterToday, we are introducing Sqlcommenter, an open source library that addresses the gap between the ORM libraries and understanding database performance. Sqlcommenter gives application developers visibility into which application code is generating slow queries and maps application traces to database query plans.Sqlcommenter is an open source library that enables ORMs to augment SQL statements before execution, with comments containing information about the code that caused its execution. This helps in easily correlating slow queries with source code and giving insights into backend database performance. In short, it provides observability into the state of client-side applications and their impact on database performance. Application developers need to do very little application code change to enable Sqlcommenter for their applications using ORMs. Observability information from Sqlcommenter can be used by application developers directly using slow query logs, or it can be integrated into other products or tools, such as Cloud SQL Insights, to provide application-centric monitoring.Getting started with SqlcommenterSqlcommenter is available for Python, Java, Node.js and Ruby languages and supports Django, Sqlalchemy, Hibernate, Knex, Sequelize and Rails ORMs. Let’s go over an example of how to enable Sqlcommenter for Django and look at how it helps to analyze Django application performance. Python InstallationSqlcommenter middleware for Django can be installed using the pip3 command.pip3 install –user google-cloud-sqlcommenterEnabling Sqlcommenter for DjangoTo enable Sqlcommenter in a Django application, you can edit your settings.py file to include google.cloud.sqlcommenter.django.middleware.SqlCommenter in the MIDDLEWARE section:Augment slow query logs with ORM informationSlow query logs provided by databases like PostgreSQL and MySQL help in finding and troubleshooting slow running queries. For example, in PostgreSQL, you can set the log_min_duration_statement database flag, and PostgreSQL will log the queries where the  duration is equal or greater than the value specified in log_min_duration_statement.  By augmenting slow query logs with application tags from the ORM, Sqlcommenter helps developers determine what application code is associated with a slow query. Here is an example of a query log from a PostgreSQL database that is used by a Django application with Sqlcommenter for Django enabled.In the above log, you can see an UPDATE statement being executed. At the end of the SQL statement, SQL style comments have been added in the form of key=value pairs, and we call the keys application tags.This comment is added by Sqlcommenter to the SQL query that was generated by the Django ORM.As you can see from the comments, it provides information about the controller, which in this example is “assign_order.” This is the controller method that sent the query. In the case of Django, the Controller in an MVC pattern maps to the View in a Django application. It also provides information about the Route through which this View in Django was called. Using this information, application developers can immediately relate which View method created this query. Since this query has taken 400 msec, an application developer can reason why this query created by the “assign_order” View method is expensive.Trace ORMs with OpenTelemetry integrationSqlcommenter allows OpenCensus and OpenTelemetry trace context information to be propagated to the database, enabling correlation between application traces and database query plans.The following example shows a query log with SQL comments added by Sqlcommenter for the Sequelize ORM.From the example query log above, you can see traceparent tags as part of the comment. The traceparent application tag is based on W3C Trace Context, which defines the standard for trace context propagation with trace id and span id. The traceparent application tag is created by Sqlcommenter using the context. Using the query log and traces from applications, application developers can relate their traces to a specific query. For more information on Context and Trace propagation, please see the OpenTelemetry specification. Application-centric monitoring with Cloud SQL Insights with the help of SqlcommenterLet us look at how the recently launched Cloud SQL Insights integrated with Sqlcommenter to help developers quickly understand and resolve query performance issues on Cloud SQL. Cloud SQL Insights helps you detect and diagnose query performance problems for Cloud SQL databases. It provides self-service, intuitive monitoring, and diagnostic information that goes beyond detection to help you to identify the root cause of performance problems. You can monitor performance at an application level and trace the source of problematic queries across the application stack by model, view, controller, route, user, and host. Cloud SQL Insights uses the information sent by Sqlcommenter to identify the top application tags (controller, route, etc.) that are sent by the application. The following example is an Insights dashboard for the Cloud SQL instance connected to the Django application we saw earlier. As you can see from the table in the screenshot below, top controller and route application tags are provided along with the other metrics for the application tags. These application tags are generated by the Sqlcommenter enabled in the Django application and Cloud SQL PostgreSQL uses these tags to identify the top application tags. This information is shown in the Cloud SQL Insights dashboard and also exported to Cloud Monitoring.The “assign_order” controller, which we saw earlier, is shown along with the route “demo/assign_order” as one of the top tags that is contributing to the database load.  For more details on you can use Insights, see the Cloud SQL Insights documentation.Using end-to-end traces in Cloud SQL InsightsOne issue with using query logs with traceparent is that it’s hard to visualize the query plan and application traces. With Cloud SQL Insights, query plans are generated as Cloud Traces with the traceparent context information from the SQL comments. Since the trace id is created by the application, and the parent span id is sent to the database as SQL comments, end-to-end tracing from application to database is now possible. You can visualize the end-to-end trace with a query plan as spans in the Cloud Trace dashboard. The example below shows application trace spans from OpenTelemetry along with query plan trace spans from the NodeJS Express Sqlcommenter library .Using this information, application developers can not only know the queries created by their application code, they can relate the query plan with application traces to diagnose their application performance issues.You can access these traces in Cloud SQL Insights by selecting an item in the Top Tags table. SummarySqlcommenter provides application developers using ORM tools the ability to diagnose performance issues in their application code impacting databases. With Cloud SQL Insights’ integration with Sqlcommenter, application developers can visualize the top application tags contributing to database load as well as trace end to end application performance problems. For more information on languages and ORM support for Sqlcommenter, or if you would like to contribute to the project, please visit the Sqlcommenter github repo.
Quelle: Google Cloud Platform

Spoiled for choice: Deploying to 3 serverless platforms

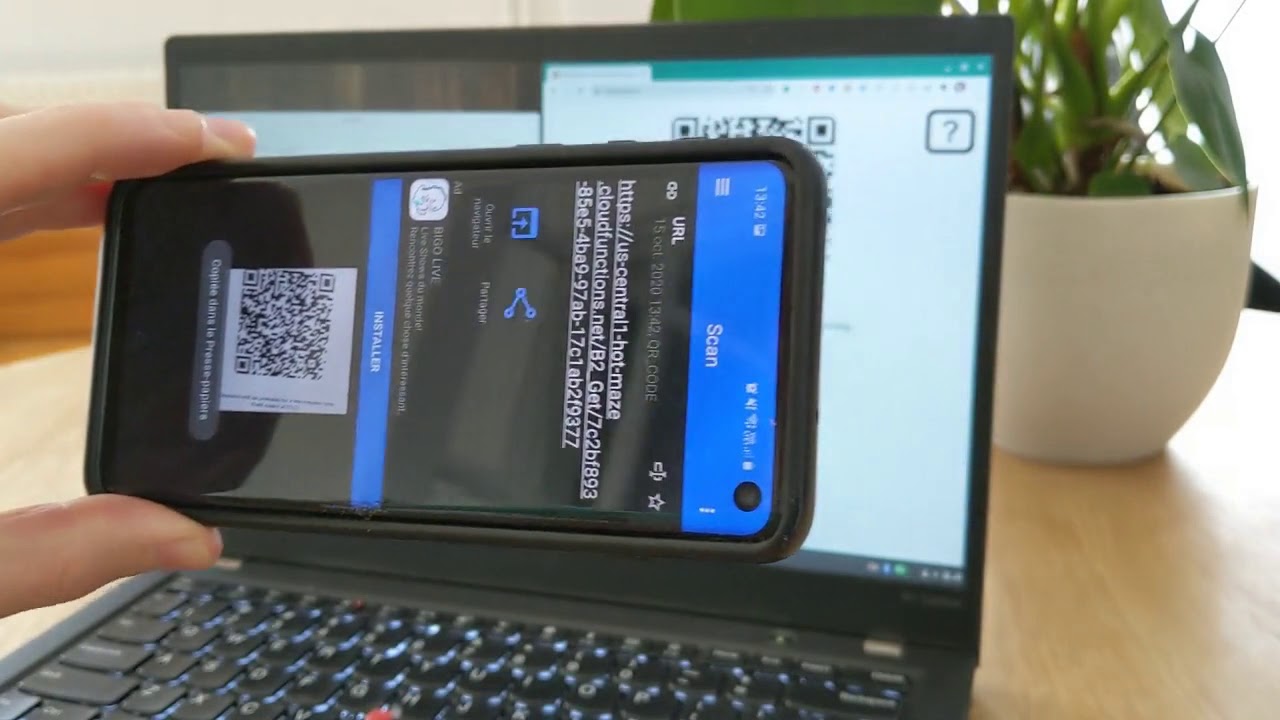
I made a webapp called Hot Maze and tried to deploy it to App Engine, to Cloud Functions, and to Cloud Run. This is what I learned in the process.What is Hot MazeHot Maze is a web page that lets you share a photo or a document from your computer to your phone, using a QR code.It’s a fast, frictionless and secure way to transfer a resource, which doesn’t require any account creation or any password.Let’s see it in action. Here, sending a blue gopher:Conceptually, this is what happens within seconds when you drop a file (e.g. a kangaroo) to the Hot Maze web page:Your browser uploads it to a Cloud locationThe web page displays a QR code containing a URL to the Cloud locationYour phone scans and decodes the QR code, and downloads the resource.The exact request sequence would depend on the Cloud components we choose to orchestrate the file transfer. Here is a first sensible workflow using Google Cloud:You drop a file FThe web page asks the Cloud server for 2 unique one-time use URLs: one URL U to upload a file to a temporary location L in Cloud Storage, and another URL D to download the file from L.The web page now uses Uto uploadF to L.The web page encodes D into a QR codeQ and displays it.You scan Qwith a QR code scanner mobile app.The mobile decodes D.The mobile uses D to download Ffrom L.A few minutes later, F is permanently deleted from L.In this scenario, the mobile phone uses a standard QR code reader app (many choices available in the Play store and in the App Store) and then lets its default browser download the file without any extra logic on the phone side.This scenario is secure because no one else knows the secret URLs U and D, thus no one can see your file F or tamper with it. U and D use the HTTPS protocol. The Cloud location L is not publicly accessible.This article shows how to design the application Hot Maze and deploy it to different serverless products of Google Cloud. We’ll explore 3 alternatives: App Engine, Cloud Functions, and Cloud Run.A word about ServerlessThe three design choices discussed below have something in common: they are stateless. This means that the specific server instance that processes a given request does not hold data and is not regarded as a source of truth. This is a fundamental property of autoscaled serverless architectures. The user data (if any) lives in distinct stateful components: a database, a file storage, or a distributed memory cache.Design for App EngineApp Engine Standard is great if your stateless application meets these criteria:Handles HTTP(S) requestsIs statelessIs written in Go, Java, Python, Node.js, PHP, or RubyDoes not need to use the local filesystem or to install binary dependenciesCommunicates with other Google Cloud componentsHot Maze fits this description very well. It is written in Go, and we use Google Cloud Storage (GCS) as a temporary repository of user files. Hot Maze consists of 2 components:The Frontend (static assets): HTML, JS, CSS, images;The Backend: handlers that process the upload and download logic.The source code is available on GitHub. In the repo, this implementation (App Engine + Cloud Storage) is calledB1.Project structureGood news, it is simple and idiomatic to have the Go webapp serve both the Frontend and the Backend.The webapp code is not adherent to App Engine (GAE), it is a standard Go app that can be developed and tested locally. Only app.yaml is specific to App Engine: It specifies which App Engine runtime to use, and how to route the incoming requests.The webapp does not need to worry about HTTPS. The HTTPS termination happens upstream in the “Google Front End Service” (GFE), so the Go code doesn’t need to deal with certificates and encryption.It is a good practice to code the server logic in its own package at the root of the Go module, and have a “main” package executable program inside “cmd” that instantiates the server and listens to a specific port. For example, in my first App Engine implementation of Hot Maze, “github.com/Deleplace/hot-maze/B1″ is both the name of the module and the path of the server package.StorageI chose Cloud Storage to take care of temporary data storage, so I have a dependency to the GCS library cloud.google.com/go/storage. For security reasons (privacy), I don’t grant read and write access to a GCS bucket to anonymous internet users. Instead I’ll have my server generate Signed URLs to let an anonymous user upload and download a given file.FlowWhen a computer user drops a file to the Hot Maze web page, the first request is asking the backend to generate and return 2 URLs: one to let the browser upload the user file to GCS, and one to let the mobile phone download the file from GCS.This is all the information needed to proceed:Upload the file F to the “secure upload URL” UThen encode and display the secure download URL D in a QR codeThe download URL is sufficient to retrieve the file directly from GCS. Ideally, the mobile phone (with a QR code scanner app) would not need to communicate with the App Engine backend at all. See the section Shorter URLs below to discover why we will in fact have the mobile device hit the App Engine service.Serving static assetsThe Frontend part of the app consists of an HTML file, a JS file, a CSS file, and a few images. It may be served by the same server instances as the Backend part, or by different servers, possibly under a different domain name.Go serverThe straightforward path is to have our Go server handle all the requests to the (static) Frontend and to the (dynamic) Backend. This is how we serve all of the contents of a given folder:This approach works exactly the same in local development and in production. Each incoming request to a static file is handled by the Go code of the server instance.Static file handlers in app.yamlIt is also possible to declare the static assets in app.yaml.This has some advantages:The requests for static assets will be handled by a CDN-like file server, not from your App Engine instances;The static assets may be served slightly faster;The static assets don’t experience cold starts. They are fast even when zero instances are running.The request logs still show up in the Cloud Logging console.This may decrease the pressure on my App Engine instances, improve their throughput of dynamic requests, and decrease the total number of occurrences of cold starts (loading latency) for scaling up.  If you use this optimization, I suggest that you keep the Go handler for static files (with http.FileServer), which continues to work for local development. This is now a component that works differently in development and in production, so you will have to keep this fact in mind during QA testing, and be careful not to introduce discrepancies between the app.yaml and the Go code (e.g. the exact set of files and folders, the cache response headers, etc.).The built-in CDN is such a nice and useful feature of App Engine that we should keep it in mind when considering the serverless options for a new project.Shorter URLsThere’s a gotcha: Signed URLs have lengthy crypto parameters, thus are pretty long: 500+ characters.Long URLs are fine for computers, however they’re not great for humans (if one ever needs to type it) and for QR codes. The full-length Signed URL above technically can fit in a standard QR code, but the resulting picture is so complex and full of tiny patterns that your mobile QR code scanner app will have troubles to properly read it.The Upload URL U is used as-is in its full-length form: your browser receives it inside a JSON response, and uses it immediately in JS to upload your resource.However, the Download URL D in full-length is not really appropriate to encode in a QR code. To fix this, we create an extra indirection: a Shortened Download URL containing only the UUID of the resource file. When the mobile device scans the QR code and extracts the short URL, it asks App Engine for the matching full-length URL to the resource in Cloud Storage.This URL shortening process adds a small delay of 1 roundtrip to the App Engine service. It also adds some (moderate) server logic, as the service needs to somehow remember the mapping between the Short D URL and the Long Signed D URL. It has the great benefit of leveraging a QR code that’s actually usable in practice.CleanupWe don’t need and don’t want to keep the user data more than a few minutes in the Cloud servers.Let’s schedule its automatic deletion after 9mn with Cloud Tasks. This is done in three parts:Creation of a new task queue$ gcloud tasks queues create b1-file-expiryA /forget handler that deletes a resource immediately: sourceA Task object that will hit /forget?uuid=<id> 9mn after the signed URLs generation: sourceA request header check ensures that the file deletion is not a public-facing service: It may only be triggered by the task queue.The Signed URLs themselves are short-lived, so the clients may upload and download only for 5mn after URL generation. The cleanup serves other purposes:Reduce storage costs, by deleting obsolete data;Foster privacy by making sure the cloud service doesn’t hold any copy of the user data longer than necessary.PrivacyThe service doesn’t require any account creation, authentication, or password.It is secure because user data can’t be intercepted by third parties:Transport encryption: upload and download use HTTPS,Data encryption at rest in Cloud Storage,Use of a nonce UUID to identify a resource, generated by the package github.com/google/uuid, which uses crypto/rand.Generation of secure Signed URLs that can’t be forged,Signed URLs expire after 5 minutes,User data is deleted after 9 minutes.However, this is different from what we call “end-to-end encryption” (E2EE). The Hot Maze service owner (me) could access the GCS bucket and see the user files before they are deleted. Implementing E2EE would be an interesting project… maybe the material for a future article.Cloud Storage bucket configurationEven with proper Signed URLs, the web browser must still be allowed to access the specific Cloud Storage bucket. If not configured, the browser may refuse and throwAccess to XMLHttpRequest from origin has been blocked by CORS policy: Response to preflight request doesn’t pass access control check: No ‘Access-Control-Allow-Origin’ header is present on the requested resource.I need to explicitly configure CORS to allow all domain names that may need legit write access (PUT) to the bucket. For this I create a bucket_cors.json file:Then I apply it with:$ gsutil cors set bucket_cors.json gs://hot-maze.appspot.com “hot-maze.appspot.com” looks like a domain name but here it is the name of the bucket that I use to store the temporary files.Cloud Storage access for local development environmentNote that the JSON above includes a localhost domain. This is necessary for the development phase. It is fine to keep this configuration even after the app has been deployed to production. It does not constitute an extra security risk.Service AccountsIt turns out that generating a GCS Signed URL with the Go client library requires a service account private key, having proper permissions. So I visited IAM, created an account ephemeral-storage@hot-maze.iam.gserviceaccount.com and gave it the role “Storage Admin”.Now I can download and use its private key, but there’s no way I’d check in such a sensitive secret in my code repo! Instead I stored the private key in Secret Manager. Then I made sure to grant the role “Secret Manager Secret Accessor” to the App Engine default service account. That’s quite a lot of indirections! The rationale is:To perform a sensitive operation, the backend must be authenticated somehow, but it is not sufficient;Additionally it requires a private key, which is a secret;It is then able to generate an upload URL to be used by an anonymous user of the service;The App Engine backend is automatically authenticated in production;Now the local development environment needs to deal with an explicit service account, in order to read the secret from Secret Manager.Local developmentFrom folder B1:$ export GOOGLE_APPLICATION_CREDENTIALS=/local/path/to/sa.json$ go run github.com/Deleplace/hot-maze/B1/cmd/backendNote that even if the main program is in cmd/backend, we run it from the root directory of the Go module, so that it correctly finds the static folder.The service account key sa.json was downloaded from the IAM web console and stored somewhere in my local file system. It is not intended to be checked in with the source code.DeploymentPrerequisite: I’m already authenticated in the command line tool gcloud, and my active project is hot-maze. From folder B1:$ gcloud app deployThis takes 2 minutes to complete. A new version is deployed as we can see in the web console. It is now accessible at two equivalent URLs:https://hot-maze.uc.r.appspot.comhttps://b1-dot-hot-maze.uc.r.appspot.comIt’s live!Design for Cloud FunctionsUsing Cloud Functions (GCF) to process the incoming events is a lightweight option with fine granularity. GCF is appropriate to process events asynchronously or synchronously. See the source code of the B2 implementation using GCF, GCS and Firebase Hosting.Frontend structure (static assets)The main difference with the first option is that Cloud Functions is not a “web backend” designed to serve HTML pages and resources. For this, we’ll use Firebase Hosting. Let’s:run firebase init in a frontend project folder, and follow the instructions.store index.html and the static folders inside the new firebase public folder.deploy the Frontend with$ firebase deployNote: by default the assets served by Firebase have a header cache-control: max-age=3600 (one hour).Firebase Hosting serves requests from a global CDN.Backend structureAnother difference is that Cloud Functions written in Go are not “standard” Go web servers. To develop and test them locally, we need the Functions framework.In the case of my app:It is still a good idea to have my server business logic in its “hotmaze” package at the root of the Go moduleWe don’t register handlers with http.HandleFunc anymoreFor local dev, we have a main package that calls funcframework.RegisterHTTPFunctionContext for each exposed Function.Note that some configuration values are now provided inside the package “hotmaze” instead of the package “main”. That’s because the executable cmd/backend/main.go will not be used in production. We don’t deploy executables or full servers to GCF. Instead, we deploy each Function separately:$ gcloud functions deploy B2_SecureURLs   –runtime go113 –trigger-http –allow-unauthenticated$ gcloud functions deploy B2_Get   –runtime go113 –trigger-http –allow-unauthenticated$ gcloud functions deploy B2_Forget   –runtime go113 –trigger-http –allow-unauthenticatedThere are 3 deploy commands, because we have 3 dynamic handlers in the backend: one to generate secure URLs, one to redirect from a Short URL to a full-length GCS Signed URL, and one to delete a resource from GCS.The total number of commands to deploy the full application is 4. It is possible to redeploy the Frontend only, or to redeploy only a single Function.It’s live!Local developmentThe Frontend and the Backend are running at a different port.Let’s be explicit in firebase.json and host the Fronted at port 8081:Then, in a first terminal:$ cd B2/frontend$ firebase emulators:startFinally, I run the Backend in the default port 8080 in a second terminal:$ cd B2/backend$ go run cmd/backend/main.goCloud Functions for FirebaseFirebase has a nice built-in integration with Cloud Functions for Javascript functions.My backend is written in Go, which is why I’m using the “traditional” Cloud Functions.Design for Cloud RunCloud Run lets me package the Frontend and the Backend in a Docker image, and deploy this image to production. In the source repo, this implementation (Cloud Run + Cloud Storage) is called B3.With Cloud Run come all the benefits of working with containers, and a few more:I can code in any language I want,using arbitrary binary dependencies (that can work in Linux),same container for local dev, QA, and production,one single container to host the static assets and the dynamic handlers,autoscaling from zero up to many,fast cold starts,and no complex cluster to manage (this is done by the cloud vendor).Project structureThe idiomatic Go webapp serves both the Frontend and the Backend. The structure is similar to the B1 (App Engine)implementation.Using a DockerfileTo package the server (Frontend + Backend) into a Docker image, we first compile the server for the target platform linux amd64. $ go build -o server github.com/Deleplace/hot-maze/B3/cmd/backendThen we ship the executable binary, as well as the folder of static assets. We don’t need to ship the Go source code. The Quickstart sample helps us write a Dockerfile to produce an image with proper CA certificates:Note:Go 1.16 will make it possible to bundle all resources inside the server executable file, thus not copy the static folder in the Dockerfile.Service accountsA deployed Cloud Run service comes with a default Service account enabled.I had to take a minute in IAM to grant it the role “Secret Manager Secret Accessor”As explained in the B1 section, accessing secrets lets us retrieve the service account ephemeral-storage@hot-maze.iam.gserviceaccount.com, which is allowed to generate Signed URLs to our GCS bucket.Local developmentWhen we “just start” our Docker container locally though, there’s no Service account automagically injected. And I would certainly not recommend copying a Service account private key in the Dockerfile, at the risk of checking it in the source repo of container registry.Following the Cloud Run documentation for local testing, I pass my service account JSON key file as arguments to the docker run command:$ export GOOGLE_APPLICATION_CREDENTIALS=/local/path/to/sa.json$ docker build -t hotmaze-b3 . $ docker run -p 8080:8080    -e GOOGLE_APPLICATION_CREDENTIALS=/tmp/keys/sa.json -v    $GOOGLE_APPLICATION_CREDENTIALS:/tmp/keys/sa.json:ro    hotmaze-b3The server is started and available at http://localhost:8080 .The service account key sa.json was downloaded from the IAM web console and stored somewhere in my local file system. It is not intended to be checked in with the source code.DeploymentThese commands compile the Go web server, build an Docker image, push it to Container Registry, and deploy it to Cloud Run:$ go build -o server github.com/Deleplace/hot-maze/B3/cmd/backend$ docker build -t hotmaze-b3 .$ gcloud builds submit –tag gcr.io/hot-maze/hot-maze-b3$ gcloud run deploy hot-maze    –image gcr.io/hot-maze/hot-maze-b3    –platform managed –allow-unauthenticatedThis overwrites the tag latest every time I deploy. For proper versioning, I may want to use more specific tag names such as release-1.0.0.Caveat:if the –allow-unauthenticated flag fails for some reason (“Setting IAM policy failed…”), then one may have to run an extra gcloud command provided in the error message, or in the web console go to Cloud Run > Service > Permissions > Add member “allUsers” and grant it the role “Cloud Run Invoker”.It’s live!Using BuildpacksWriting a correct Dockerfile and deploying a container is more complex than “just deploying the code” to e.g. App Engine.However, Buildpacks are a Cloud Native way to seamlessly containerize and deploy an app from its source code. The main difference with the previous section is that I don’t need a Dockerfile.Following these instructions, here is how I can deploy Hot Maze to Cloud Run:$ pack set-default-builder gcr.io/buildpacks/builder:v1$ pack build –publish gcr.io/hot-maze/hot-maze$ gcloud run deploy –image gcr.io/hot-maze/hot-maze –platform managed –allow-unauthenticatedIts live as well!Static filesFor aforementioned strategic reasons, one may want to have a CDN serve the static assets, e.g. Google Cloud CDN. This part is optional and most useful when the app serves a lot of traffic.Further workWe’ve already seen two performance optimizations:Using a CDN for static assets,Reducing the complexity of the QR code, with URL shortening.I can think of a lot more possible improvements of UX, simplicity and performance. I keep those for potential future articles!ConclusionIn this article we’ve seen how we can structure an app of moderate complexity in order to deploy it to three different serverless platforms in Google Cloud.All of them are valid choices: App Engine + Cloud StorageCloud Functions + Firebase hosting + Cloud StorageCloud Run + Cloud Storage.You may choose the one that best fits your needs depending on the details of your own workflow, or on unique features of one of them. For example if your app is already packaged as a Docker container, then Cloud Run is the best choice.If you wish to learn more about the services mentioned above, please check out these resources:App Engine Standard Environment for GoCloud Functions for GoCloud RunFirebase HostingCloud StorageCloud Storage Signed URLsServing Static Files with App EngineService accountsSecret ManagerCloud LoggingContainer RegistryBuildpacksCloud CDNFree things in Google Cloud90-day $300 Free Trial of Google Cloud
Quelle: Google Cloud Platform

New Cloud DNS response policies simplify access to Google APIs

Organizations building applications on top of Google Cloud make heavy use of Google APIs, allowing developers to build feature-rich and scalable services on Google Cloud infrastructure. But accessing those APIs can be tough if an organization uses VPC Service Controls to isolate resources and mitigate data exfiltration risks. Today, we’re introducing Cloud DNS response policies. This new feature allows a network administrator to modify the behavior of the DNS resolver according to organizational policies, making it easier to set up private connectivity to Google APIs from within a VPC Service Controls perimeter. To date, this has been a challenge for customers, especially for services whose APIs are not available within restricted.googleapis.com and aren’t accessible within the VPC SC perimeter. In addition, configuring access to restricted.googleapis.com is not straightforward: you have to create a new private DNS zone just to access Google services in addition to any existing private DNS zones and add records corresponding to the APIs in use. The simple approach of creating a wildcard *.googleapis.com DNS zone and pointing it to the restricted VIP will break services that are not available on the restricted VIP. Using Cloud DNS response policies helps simplify the user experience. Based on a subset of the Internet Draft for response policy zones (or RPZ), they allow you to modify how the resolver behaves according to a set of rules. As such, you can create a single response policy per network that allows for:Alteration of results for selected query names (including wildcards) by providing specific resource records ORTriggering passthru behavior that exempts names from matching the response policy. Specifically, a name can be excluded from a wildcard match, allowing normal private DNS matching (or internet resolution) to proceed as if it never encountered the wildcard.You can use this to set up private connectivity to Google APIs from within a VPC Service Controls perimeter. It works by creating a response policy (instead of a DNS zone) bound to the network, then adds a localdata rule for *.googleapis.com containing the CNAME. You can then exempt unsupported names (like www.googleapis.com by creating a passthru rule. Queries then receive the restricted answer, unless they are for the unsupported name, in which case they receive the normal internet result.The following snippet illustrates how to achieve this:There are some caveats to using Cloud DNS response policies though—passthru configurations cannot generate NXDOMAINS so they are not a replacement for an actual DNS Zone. Response policies can also be used in a couple of other ways as described here. A DNS zone with a name like example.com becomes responsible for the entire hierarchy beneath it. Response policy rules do not require a DNS zone to be created to modify the behavior of specific DNS names. Matching the response policy also happens before other processing, allowing other private DNS resources to be overridden. For instance if a dev network environment imports (via DNS Peering) a production DNS private zone, specific names can be “patched” to refer to dev endpoints without affecting the rest of the DNS zone. For instance:In the snippet above, set up the response policy and attach it to your DNS Zone. Then create the rule that serves up the development server IP for names that end in dev.example.com. A second example here allows you to block dangerous names on the Internet by redirecting them to an informational IP, without the overhead of managing potentially thousands of “stub” private DNS zones.For instance:The snippet above first creates a response policy called ‘blocklist-response-policy’ that’s attached to your existing network/zone. It then creates a new rule that redirects all DNS requests for bad.actor.com to an informational webserver. Services without sacrificing securityBuilding rich applications cannot come at the cost of sacrificing security, especially in complex, multi-tenant environments. Cloud DNS response policies offer a new and flexible way to configure access to Google APIs. Learn more and try out this new feature by reading the documentation.Related ArticleUnderstanding forwarding, peering, and private zones in Cloud DNSCloud DNS private zones, peering, and logging and auditing enhance security and manageability of your private GCP DNS environment.Read Article
Quelle: Google Cloud Platform

Retailers find flexible demand forecasting models in BigQuery ML

Retail businesses understand the value of demand forecasting—using their intuition, product and market experience, and seasonal patterns and cycles to plan for future demand. Beyond the need for forecasts that are as accurate as possible, modern retailers also face the  challenge of being able to perform demand planning at scale. Product assortments that span tens of thousands of items across hundreds of individual selling locations or designated marketing areas lead to a number of time series that cannot be managed without the help of big data platforms, and time series modeling solutions that scale accordingly. So far, there have been two ways to address this challenge: Purchase a full end-to-end demand forecasting solution, which takes significant time and resources to implement and maintain. Or leverage an all-purpose machine learning platform to run your own time series models, which requires deep experience in both modeling and data engineering. To help retailers with an easier, more flexible solution for demand planning, we’ve published a Smart Analytics reference pattern for performing time series forecasting with BigQuery ML using autoregressive integrated moving average (ARIMA) as a basis. This ARIMA model follows the BigQuery ML low-code design principle, allowing for accurate forecasts without advanced knowledge of time series models. Moreover, the BigQuery ML ARIMA model provides several innovations over the original ARIMA models that many are familiar with, including the ability to capture multiple seasonal patterns, automated model selection, a no-hassle preprocessing pipeline, and most of all, the ability to effortlessly generate thousands of forecasts at scale with nothing but a few lines of SQL.In this blog, we’ll take a look at the two most common ways demand forecasting teams have been organized, and how BigQuery ML fills a gap between the two, plus discuss how BigQuery ML can help your demand planning recover from unforeseen events like COVID-19. To see the end-to-end process to implement the demand forecasting design pattern, check out this video:Two types of demand forecasting teamsHistorically, large organizations have had two types of demand forecasting teams. We’ll call them the Business Forecasting team and the Science Forecasting team. The Business Forecasting team typically uses full enterprise resource planning (ERP) or software as a service (SaaS) forecasting solutions (or occasionally a homegrown solution) that don’t require an advanced level of data science skill to use. These ERPs produce entirely automated forecasts. Team members often come from the business side of the organization, and instead of deep technical skills, bring extensive domain and business knowledge to their role. Many large brick-and-mortar organizations often use this approach. These types of solutions may scale well, but they require significant time and resources, both to implement and to support. This typically includes large implementation and DevOps teams, multiple dedicated compute and data storage instances, and fixed-schedule hours-long batch cycles to refresh the forecasts.The Science Forecasting team typically features PhD or MSc-level practitioners working within a data science or a tech organization, who are fluent in Python or R. They work with a Cloud AI platform and perform all of the end-to-end forecasting themselves: choosing, building, training, and evaluating a model. Then they deploy the model to production and communicate results to business stakeholders and leadership. This type of team is often found in digital-native organizations.A new type of forecasting teamRecently, a new hybrid type of forecasting team has emerged. Often these are in businesses looking to become more data and model driven, but don’t have the resources to invest in an expensive ERP or hire a PhD-level data scientist. They may have a decent knowledge of forecasting and demand planning, but not enough experience or organizational resources to deploy custom models at scale. Still, this type of team, given the right tools, has the potential to merge the best of both worlds: the advanced modeling of the Science Forecaster and the deep domain knowledge of Business Forecaster.Responding to the unforeseen As nearly every business experienced firsthand in 2020, certain events like the COVID-19 pandemic throw a wrench into demand forecasting signals, making existing models questionable.With an ERP forecasting solution, even a small change to the supply chain and store network configuration will result in a change in demand patterns that requires extensive reconfiguration of the demand planning solution, and the help of a large support team. BigQuery ML reduces the complexity of making such adjustments due to both expected and unexpected events, and because it’s serverless, it autoscales and saves costs in DevOps time and efforts. Regenerating forecasts to adapt to a change in the supply chain network configuration is now a matter of hours, not weeks. Getting started with a BigQuery ML reference patternTo make it easier to get up and running with Google Cloud tools like BigQuery ML, we recently introduced Smart Analytics reference patterns—technical reference guides with sample code for common analytics use cases. We’ve heard that you want easy ways to put analytics tools into practice, and previous reference patterns cover use cases like predicting customer lifetime value, propensity to purchase, product recommendation systems, and more. Our newest reference pattern on Github will help you get a head start on generating time series forecasts at scale. The pattern will show you how to use historical sales data to train a demand forecasting model using BigQuery ML, and then visualize the forecasts in a dashboard. For more details and to walk you through this process, using historical transactional data for Iowa liquor sales data to forecast the next 30 days, check out our technical explainer. In the blog, you’ll learn how to:Pre-process data into the correct format needed to create a demand forecasting model using BigQuery MLFit multiple BQ ARIMA time-series models in BigQuery MLEvaluate the models, and generate forward-looking forecasts for the desired forecast horizonCreate a dashboard to visualize the projected demand using Data StudioSet up scheduled queries to automatically re-fit the models on a regular basisClick to enlargeLet’s do a deeper dive into the concepts we just introduced you to.BigQuery ML bridges the gap between the Businesses Forecaster and the Science ForecasterGiven the features we just described, we see how BQML helps fill the gap between the two current approaches to forecasting at scale, allowing you to build your own demand forecasting platform without the need for highly specialized time series data scientists. It’s an ideal solution for hybrid forecasters, featuring tools you can use to generate forecasts at scale on the fly. Since BigQuery ML lets you train and deploy ML models using SQL, it democratizes your data modeling challenges, opening up your demand forecasting tools and business insights to a larger pool of your organizational talent. For example, the BigQuery ML ARIMA model helps retailers recover from unexpected events with the ability to generate thousands of forecasts with fresh data over a shorter amount of time. You can recalibrate demand forecasts more cost effectively, detect changes in trends, and perform multiple iterations that capture new patterns as they emerge, without mobilizing an entire DevOps team in order to do so. Using BigQuery ML as your forecast engine allows you to bridge the gap between your business or hybrid forecasting teams and advanced data science teams. For example, your forecast analysts will own the task of generating baseline statistical forecasts with BigQuery and reviewing them, but they will loop in a senior data scientist to perform a more advanced causal impact analysis on some of their demand data as needed, or to measure the effect of COVID-19 on shifting demand patterns. Think of it as “DemandOps” instead of “DevOps.” This is also possible if you already have ERP demand planning tools as well, by simply exporting your forecasts and sales actuals into BigQuery whenever they are refreshed, or as needed. Chances are, a retail organization actually has multiple time series forecasts being run by separate business functions. Your merchandising team will be running tactical and operational demand forecasts, finance is performing top-line revenue forecasts, while supply chain are running their own forecasts for capacity planning at the data center level, each using their own specific tool set. These forecasts are being generated in isolation, but reconciling them would improve accuracy and provide the organization with valuable holistic insights into their business that siloed forecasts and analysis can’t provide. For example, based on market and product signals, merchandising may forecast an increase in demand for a certain product. Separately, supply chain will be aware of various manufacturing and logistics stressors that project a decrease in the product shipments. Typically this discrepancy won’t be caught for several weeks, and will then be resolved via emails and meetings. By then it’s too late, since conflicting planning decisions were already made by the separate teams, and the proverbial damage is done. Using BigQuery as a centralized forecast analysis platform would allow a retailer to detect such discrepancy in a matter of hours or days, and react accordingly, instead of having to roll back planning decisions several weeks after the fact. BigQuery and BigQuery ML provide the perfect platform for collaboration between disparate and diverse forecasting teams, beyond just the powerful modeling capabilities of BQARIMA. Google Cloud offers several solutions to help you enhance your demand forecasting capabilities and optimize inventory levels amidst changing times. Besides the BigQuery ML tools described in this blog, there are also: Building your own time series models, either statistical or ML-based, using your preferred open source frameworks on Cloud AI Platform Jupyterlab instancesUse AutoML Forecast to automatically select and train cutting edge deep learning time series models Use our upcoming fully managed forecasting solution, Demand AI (currently in experimental status)Work with a partner like o9 to implement their retail planning platform with forecasting capabilities on Google CloudFor more examples of data analytics reference patterns, check out the predictive forecasting section in our catalog. Ready to get started with BigQuery ML? Read more in our product introduction.Want to dig deeper into BigQuery ML capabilities? Sign up here for free training on how to train, evaluate and forecast inventory demand on retail sales data with BigQuery ML.Related ArticleMost popular public datasets to enrich your BigQuery analysesCheck out free public datasets from Google Cloud, available to help you get started easily with big data analytics in BigQuery and Cloud …Read Article
Quelle: Google Cloud Platform

The evolution of data architecture at The New York Times

Like virtually every business across the globe, The New York Times had to quickly adapt to the challenges of the coronavirus pandemic last year. Fortunately, our data system with Google Cloud positioned us to perform quickly and efficiently in the new normal. How we use dataWe have an end-to-end type of data platform; on one side we work very closely with our product teams to collect the right level of data that they’re interested in, such as which articles people are reading, and how long they’re staying onsite. We frequently measure our audience to understand our user segments, and how they come onsite or use our apps. We then provide that data to analysts for end-to-end analytics. On the other side, the newsroom is also focused on audience, and we build tools to help them understand how Google Search or different social promotions play a role in a person’s decision to read The New York Times, and also to get a better sense of their behavior on our pages. With this data, the newsroom can make decisions about information that should be displayed on our homepage or in push notifications. Ultimately, we’re interested in behavioral analytics—how people engage with our site and our apps. We want to understand different behavioral patterns, and which factors or features will encourage users to register and subscribe with us. We also use data to create or curate preferences around personalization, to ensure we’re delivering to our users fresh content, or content that they may not have normally read. Likewise, our data also gets used in our targeting system, so that we can send out the right messaging about our various subscription packages to the right users.Choosing to migrate to Google CloudWhen I came to The New York Times over five years ago, our data architecture was not working for us. Our infrastructure was gathering data that proved harder for analysts to crunch on a daily basis. We were also hitting hang ups with how that data was streaming into our system and environment. Back then we’d run a query and then go grab some coffee, hoping that the query would finish or give us the right data by the time we came back to our desks. Sometimes it would, sometimes it wouldn’t.We realized that Hadoop was definitely not going to be the on-premises solution for us, and that’s when we started talking with the Google Cloud team. We began our digital transformation with a migration to BigQuery, their fully managed, serverless database warehouse. We were under a pretty aggressive migration timeline, focusing first on moving over analytics. We made sure our analysts got a top-of-the-line system that treated them the way that they themselves would want to treat the data. One significant prominent requirement in our data architecture choice was to enable analysts to be able to work as quickly as they needed to provide high-quality deliverables for their business partners. For our analysts, the transition to BigQuery was night and day. I still remember when my manager ran his very first query on BigQuery and was ready to go grab his coffee, but the query finished by the time he got up from his chair. Our analysts talk about that to this day.While we were doing the BigQuery transition, we did have concerns about our other systems not scaling correctly. Two years ago, we weren’t sure we’d be able to scale up to the audience we expected on that election day. We were able to band-aid a solution back then, but we knew we only had two more years to figure out a real, dependable solution. During that time, we moved our streaming pipeline over to Google Cloud, primarily using App Engine, which has been a flexible environment that enabled quick scaling changes and requirements as needed. Dataflow and Pub/Sub also played significant roles in managing the data. In Q4 of 2020 we had our most significant traffic ever recorded, at 273 million global readers, and four straight days of the highest traffic we’ve had compared to other election weeks. We were proud to see that there was no data loss.A couple of years ago, on our legacy system, I was up until three in the morning one night trying to keep data running for their needs. This year, for election night, I relaxed and ate a pint of ice cream because I was able to more easily manage our data environment, allowing us to set and meet higher expectations for data ingestion, analysis and insight among our partners in the newsroom.How COVID-19 changed our 2020 roadmap The coronavirus pandemic definitely wasn’t on my team’s roadmap for 2020, and it’s important to mention here that The New York Times is not fundamentally a data company. Our job is to get the news out to our users every single day in paper, on apps, and onsite. Our newsroom didn’t expect the need to build out a giant coronavirus database that would enrich the news they share every day. Our newsroom moves quickly, and our engineers have built one of the most comprehensive datasets on COVID-19 in the U.S. With Google, The New York Times decided to make our data publicly available on BigQuery Google’s COVID-19 public dataset. Check out this webinar for more details on our evolution architecture:Flexible approachWe have many different teams that work within Google Cloud, and they’ve been able to pick from the range of available services and tailor project requirements keeping those tools available in mind.One challenge we think about with the data platform at The New York Times is determining the priorities of what we build. Our ability to engage with product teams at Google though the Data Analytics Customer Council allows us to see into the BigQuery roadmap, or the data analytics roadmap, and plays a significant role in determining where we focus our own development. For example, we’ve built tools like our Data Reporting API, which reads data directly from BigQuery, in order to take advantage of tools like BigQuery BI Engine. This approach encourages our analysts to be better managers of their domains around dimensions and metrics, but not have to focus on building caching mechanisms of their data. Getting that kind of clarity helps us plan how to build The New York Times in the new normal and beyond.If you are interested to learn more about the data teams at the New York Times, take a look at our open tech roles here and you’ll find many interesting articles at NYT data blog.Related ArticleThe democratization of data and insights: making real-time analytics ubiquitousWe examine data access, data insights, and machine learning in the context of real-time data analysis, and how Google Cloud is working to…Read Article
Quelle: Google Cloud Platform

How to build demand forecasting models with BigQuery ML

Retail businesses have a “goldilocks” problem when it comes to inventory: don’t stock too much, but don’t stock too little. With potentially millions of products, for a data science and engineering team to create multi-millions of forecasts is one thing, but to procure and manage the infrastructure to handle continuous model training and forecasting, this can quickly become overwhelming, especially for large businesses.With BigQuery ML, you can train and deploy machine learning models using SQL. With the fully managed, scalable infrastructure of BigQuery, this means reducing complexity while accelerating time to production, so you can spend more time using the forecasts to improve your business.So how can you build demand forecasting models at scale with BigQuery ML, for thousands to millions of products like for this liquor product below?In this blogpost, I’ll show you how to build a time series model to forecast the demand of multiple products using BigQuery ML. Using Iowa Liquor Sales data, I’ll use 18 months of historical transactional data to forecast the next 30 days.You’ll learn how to:pre-process data into the correct format needed to create a demand forecasting model using BigQuery MLtrain an ARIMA-based time-series model in BigQuery MLevaluate the modelpredict the future demand of each product over the next n daystake action on the forecasted predictions:create a dashboard to visualize the forecasted demand using Data Studiosetup scheduled queries to automatically re-train the model on a regular basisThe data: Iowa Liquor SalesThe Iowa Liquor Sales data, which is hosted publicly on BigQuery, is a dataset that “contains the spirits purchase information of Iowa Class “E” liquor licensees by product and date of purchase from January 1, 2012 to current” (from the official documentation by the State of Iowa).The raw dataset looks like this:As on any given date, there may be multiple orders of the same product, we need to:Calculate the total # of products sold grouped by the date and the productCleaned training dataIn the cleaned training data, we now have one row per date per item_name, the total amount sold on that day. This can be stored as a table or view. In this example, this is stored as bqmlforecast.training_data using CREATE TABLE.Train the time series model using BigQuery MLTraining the time-series model is straight-forward. How does time-series modeling work in BigQuery ML?When you train a time series model with BigQuery ML, multiple models/components are used in the model creation pipeline. ARIMA, is one of the core algorithms. Other components are also used, as listed roughly in the order the steps they are run:Pre-processing: Automatic cleaning adjustments to the input time series, including missing values, duplicated timestamps, spike anomalies, and accounting for abrupt level changes in the time series history.Holiday effects: Time series modeling in BigQuery ML can also account for holiday effects. By default, holiday effects modeling is disabled. But since this data is from the United States, and the data includes a minimum one year of daily data, you can also specify an optional HOLIDAY_REGION. With holiday effects enabled, spike and dip anomalies that appear during holidays will no longer be treated as anomalies. A full list of the holiday regions can be found in the HOLIDAY_REGION documentation.Seasonal and trend decomposition using the Seasonal and Trend decomposition using Loess (STL) algorithm. Seasonality extrapolation using the double exponential smoothing (ETS) algorithm.Trend modeling using the ARIMA model and the auto.ARIMA algorithm for automatic hyper-parameter tuning. In auto.ARIMA, dozens of candidate models are trained and evaluated in parallel, which include p,d,q and drift. The best model comes with the lowest Akaike information criterion (AIC).Forecasting multiple products in parallel with BigQuery MLYou can train a time series model to forecast a single product, or forecast multiple products at the same time (which is really convenient if you have thousands or millions of products to forecast). To forecast multiple products at the same time, different pipelines are run in parallel. In this example, since you are training the model on multiple products in a single model creation statement, you will need to specify the parameter TIME_SERIES_ID_COL as item_name. Note that if you were only forecasting a single item, then you would not need to specify TIME_SERIES_ID_COL. For more information, see the BigQuery ML time series model creation documentation.Evaluate the time series modelYou can use the ML.EVALUATE function (documentation) to see the evaluation metrics of all the created models (one per item):As you can see, in this example, there were five models trained, one for each of the products in item_name. The first four columns (non_seasonal_{p,d,q} and has_drift) define the ARIMA model. The next three metrics (log_likelihood, AIC, and variance) are relevant to the ARIMA model fitting process. The fitting process determines the best ARIMA model by using the auto.ARIMA algorithm, one for each time series. Of these metrics, AIC is typically the go-to metric to evaluate how well a time series model fits the data while penalizing overly complex models. As a rule-of-thumb, the lower the AIC score, the better. Finally, the seasonal_periods detected for each of the five items happened to be the same: WEEKLY.Make predictions using the modelMake predictions using ML.FORECAST (syntax documentation), which forecasts the next n values, as set in horizon. You can also change the confidence_level, the percentage that the forecasted values fall within the prediction interval.The code below shows a forecast horizon of “30”, which means to make predictions on the next 30 days, since the training data was daily.Since the horizon was set to 30, the result contains rows equal to 30 forecasted value * (number of items).Each forecasted value also shows the upper and lower bound of the prediction_interval, given the confidence_level.As you may notice, the SQL script uses DECLARE and EXECUTE IMMEDIATE to help parameterize the inputs for horizon and confidence_level. As these HORIZON and CONFIDENCE_LEVEL variables make it easier to adjust the values later, this can improve code readability and maintainability. To learn about how this syntax works, you can read the documentation on scripting in Standard SQL.Plot the forecasted predictions You can use your favourite data visualization tool, or use some template code here on Github for matplotlib and Data Studio, as shown below:How do you automatically re-train the model on a regular basis?If you’re like many retail businesses that need to create fresh time-series forecasts based on the most recent data, you can use scheduled queries to automatically re-run your SQL queries, which includes your CREATE MODEL, ML.EVALUATE or ML.FORECAST queries.1. Create a new scheduled query in the BigQuery UIYou may need to first “Enable Scheduled Queries” before you can create your first one.2. Input your requirements (e.g., repeats Weekly) and select “Schedule”3. Monitor your scheduled queries on the BigQuery Scheduled Queries pageExtra tips on using time series with BigQuery MLInspect the ARIMA model coefficientsIf you want to know the exact coefficients for each of your ARIMA models, you can inspect them using ML.ARIMA_COEFFICIENTS (documentation).For each of the models, ar_coefficients shows the model coefficients of the autoregressive (AR) part of the ARIMA model. Similarly, ma_coefficients shows the model coefficients of moving-average (MA) part. They are both arrays, whose lengths are equal to non_seasonal_p and non_seasonal_q, respectively. The intercept_or_drift is the constant term in the ARIMA model.SummaryCongratulations! You now know how to train your time series models using BigQuery ML, evaluate your model, and use the results in production. Code on GithubYou can find the full code in this Jupyter notebook on Github:https://github.com/GoogleCloudPlatform/analytics-componentized-patterns/tree/master/retail/time-series/bqml-demand-forecastingJoin me on February 4 for a live walkthrough of how to train, evaluate and forecast inventory demand on retail sales data with BigQuery ML. I’ll also demonstrate how to schedule model retraining on a regular basis so your forecast models can stay up-to-date. You’ll have a chance to have their questions answered by Google Cloud experts via chat.Want more?I’m Polong Lin, a Developer Advocate for Google Cloud. Follow me on @polonglin or connect with me on Linkedin at linkedin.com/in/polonglin.Please leave me your comments with any suggestions or feedback.Thanks to reviewers: Abhishek Kashyap, Karl WeinmeisterRelated ArticleRetailers find flexible demand forecasting models in BigQuery MLTry BigQuery’s design pattern for demand forecasting to create predictive analytics models for retail use cases.Read Article
Quelle: Google Cloud Platform