Amazon SageMaker Catalog now supports read and write access to Amazon S3

Amazon SageMaker Catalog now supports read and write access to Amazon S3 general purpose buckets. This capability helps data scientists and analysts search for unstructured data, process it alongside structured datasets, and share transformed datasets with other teams. Data publishers gain additional controls to support analytics and generative AI workflows within SageMaker Unified Studio while maintaining security and governance controls over shared data. 
When approving subscription requests or directly sharing S3 data within the SageMaker Catalog, data producers can choose to grant read-only or read and write access. If granted read and write access, data consumers can process datasets in SageMaker and store the results back to the S3 bucket or folder. The data can then be published and automatically discoverable by other teams. This capability is now available in all AWS Regions where Amazon SageMaker Unified Studio is supported. To get started, you can log into SageMaker Unified Studio, or you can use the Amazon DataZone API, SDK, or AWS CLI. To learn more, see the SageMaker Unified Studio guide.
Quelle: aws.amazon.com

Amazon ECS improves Service Availability during Rolling deployments

Amazon Elastic Container Service (Amazon ECS) now includes enhancements that improve service availability during rolling deployments. These enhancements help maintain availability when new application version tasks are failing, when current tasks are unexpectedly terminated, or when scale-out is triggered during deployments.
Previously, when tasks in your currently running version became unhealthy or were terminated during a rolling deployment, ECS would attempt to replace them with the new version to prioritize deployment progress. If the new version could not launch successfully—such as when new tasks fail health checks or fail to start—these replacements would fail and your service availability could drop. ECS now replaces unhealthy or terminated tasks using the same service revision they belong to. Unhealthy tasks in your currently running version are replaced with healthy tasks from that same version, independent of the new version’s status. Additionally, when Application Auto Scaling triggers during a rolling deployment, ECS applies scale-out to both service revisions, ensuring your currently running version can handle increased load even if the new version is failing.
These improvements respect your service’s maximumPercent and minimumHealthyPercent settings. These enhancements are enabled by default for all services using the rolling deployment strategy and are available in all AWS Regions. To learn more about rolling-update deployments, refer Link.
Quelle: aws.amazon.com

Investigating the Great AI Productivity Divide: Why Are Some Developers 5x Faster?

AI-powered developer tools claim to boost your productivity, doing everything from intelligent auto-complete to [fully autonomous feature work](https://openai.com/index/introducing-codex/). 

But the productivity gains users report have been something of a mixed bag. Some groups claim to get 3-5x (or more), productivity boosts, while other devs claim to get no benefit at all—or even losses of up to 19%.

I had to get behind these contradictory reports. 

As a software engineer, producing code is a significant part of my role. If there are tools that can multiply my output that easily, I have a professional responsibility to look into the matter and learn to use them.

I wanted to know where, and more importantly, what separates the high-performing groups from the rest. This article reports on what I found.

The State of AI Developer Tools in 2025

AI dev tooling has achieved significant adoption: 84% of StackOverflow survey respondents in 2025 said they’re using or planning to use AI tools, up from 76% in 2024, and 51% of professional developers use these tools daily.

However, AI dev tooling is a fairly vague category. The space has experienced massive fragmentation. When AI tools first started taking off in the mainstream with the launch of GitHub Copilot in 2021, they were basically confined to enhanced IDE intellisense/autocomplete, and sometimes in-editor chat features. Now, in 2025, the industry is seeing a shift away from IDEs toward CLI-based tools like Claude Code. 

Some AI enthusiasts are even suggesting that IDEs are obsolete altogether, or soon will be.

That seems like a bold claim in the face of the data, though.

While adoption may be up, positive sentiment about AI tools is down to 60% from 70% in 2024. A higher portion of developers also actively distrust the accuracy of AI tools (46%) compared to those who trust them (33%).

These stats paint an interesting picture. Developers seem to be reluctantly (or perhaps enthusiastically at first) adopting these tools—likely in no small part due to aggressive messaging from AI-invested companies—only to find that these tools are perhaps not all they’ve been hyped up to be.

The tools I’ve mentioned so far are primarily those designed for the production and modification of code. Other AI tool categories cover areas like testing, documentation, debugging, and DevOps/deployment practices. In this article, I’m focusing on code production tools as they relate to developer productivity, whether they be in-IDE copilots or CLI-based agents.

What the Data Says about AI Tools’ Impact on Developer Productivity

Individual developer sentiment is one thing, but surely it can be definitively shown whether or not these tools can live up to their claims?

Unfortunately, developer productivity is difficult to measure at the best of times, and things don’t get any easier when you introduce the wildcard of generative AI. 

Research into how AI tools influence developer productivity has been quite lacking so far, likely in large part because productivity is so difficult to quantify. There have been only a few studies with decent sample sizes, and their methodologies have varied significantly, making it difficult to compare the data on a 1:1 basis.

Nevertheless, there are a few datapoints worth examining.

In determining which studies to include, I tried to find two to four studies for each side of the divide that represented a decent spread of developers with varying levels of experience, working in different kinds of codebases, and using different AI tools. This diversity makes it harder to compare the findings, but homogenous studies would not produce meaningful results, as real-world developers and their codebases vary wildly.

Data that Shows AI Increases Developer Productivity

In the “AI makes us faster” corner, studies like this one indicate that “across three experiments and 4,867 developers, [their] analysis reveals a 26.08% increase (SE: 10.3%) in completed tasks among developers using the AI tool. Notably, less experienced developers had higher adoption rates and greater productivity gains.”

This last point—that less experienced devs have greater productivity gains—is worth remembering; we’ll come back to it.

In a controlled study by GitHub, developers who used GitHub Copilot completed tasks 55% faster than those who did not. This study also found that 90% of developers found their job more fulfilling with Copilot, and 95% said they enjoyed coding more when using it. While it may not seem like fulfillment and enjoyment are directly tied to productivity, there is evidence that suggests they’re contributing factors.

I couldn’t help but notice that the most robust studies that find AI improves developer productivity are tied to companies that produce AI developer tools. The first study mentioned above has authors from Microsoft—an investor of OpenAI— and funding from the MIT Generative AI Impact Consortium, whose founding members include OpenAI. The other study was conducted by GitHub, a subsidiary of Microsoft and creator of Copilot, a leading AI developer tool. While it doesn’t invalidate the research or the findings, it is worth noting.

Data that Shows AI Tools Do Not Increase Productivity

On the other side of the house, studies have also found little to no gains from AI tooling. 

Perhaps most infamous among these is the METR study from July 2025. Even though developers who participated in the study predicted that AI tools would make them 24% faster, the tools actually made them 19% slower when completing assigned tasks.

A noteworthy aspect of this study was that the developers were all working in fairly complex codebases that they were highly familiar with.

Another study by Uplevel points in a similar direction. Surveying 800 developers, they found no significant productivity gains in objective measurements, such as cycle time or PR throughput. In fact, they found that developers who use Copilot introduced a 41% increase in bugs, suggesting a negative impact on code quality, even if there wasn’t an impact on throughput.

What’s Going On?

How can it be that the studies found such wildly different results?

I must acknowledge again: productivity is hard to measure, and generative AI is notoriously non-deterministic. What works well for one developer might not work for another developer in a different codebase.

However, I do believe some patterns emerge from these seemingly contradictory findings.

Firstly, AI does deliver short-term productivity and satisfaction gains, particularly for less experienced developers and in well-scoped tasks. However, AI can introduce quality risks and slow teams down when the work is complex, the systems are unfamiliar, or developers become over-reliant on the tool.

Remember the finding that less experienced developers had higher adoption rates and greater productivity gains? While it might seem like a good thing at first, it also holds a potential problem: by relying on AI tools, you run the risk of stunting your own growth. You are also not learning your codebase as fast, which will keep you reliant on AI. We can even take it a step further: do less experienced developers think they are being more productive, but they actually lack enough familiarity with the code to understand the impact of the changes being made?

Will these risks materialize? Who knows. If I were a less experienced developer, I would have wanted to know about them, at least.

My Conclusions

My biggest conclusion from this research is that developers shouldn’t expect anything in the order of 3-5x productivity gains. Even if you manage to produce 3-5x as much code with AI as you would if you were doing it manually, the code might not be up to a reasonable standard, and the only way to know for sure is to review it thoroughly, which takes time.

Research findings suggest a more reasonable expectation is that you can increase your productivity by around 20%.

If you’re a less experienced developer, you’ll likely gain more raw output from AI tools, but this might come at the cost of your growth and independence.

My advice to junior developers in this age of AI tools is probably nothing you haven’t heard before: learn how to make effective use of AI tools, but don’t assume that it makes traditional learning and understanding obsolete. Your ability to get value from these tools depends on knowing the language, the systems, and the context first. AI makes plenty of mistakes, and if you hand it the wheel, it can generate broken code and technical debt faster than you ever could on your own. Use it as a tutor, a guide, and a way to accelerate learning. Let it bridge gaps, but aim to surpass it.

If you’re already an experienced developer, you almost certainly know more about your codebase than the AI does. So while it might type faster than you, you won’t get as much raw output from it, purely because you can probably make changes with more focused intent and specificity than it can. Of course, your mileage may vary, but AI tools will often try to do the first thing they think of, rather than the best or most efficient thing.

That is not to say you shouldn’t use AI. But you shouldn’t see it as a magic wand that will instantly 5x your productivity.

Like any tool, you need to learn how to use AI tools to maximize your efficacy. This involves prompt crafting, reviewing outputs, and refining subsequent inputs, something I’ve written about in another post. Once you get this workflow down, AI tools can save you significant time on code implementation while you focus on understanding exactly what needs to be done.

If AI tooling is truly a paradigm shift, it stands to reason that you would need to change your ways of working to get the most from it. You cannot expect to inject AI into your current workflow and reap the benefits without significant changes to how you operate.

For me, the lesson is clear: productivity gains don’t come from the tools alone; they come from the people who use them and the processes they follow. I’ve seen enough variation across developers and codebases to know this isn’t just theory, and the findings from these studies say the same thing: same tools, different outcomes.

The difference is always the developer.

Quelle: https://blog.docker.com/feed/

Making the Most of Your Docker Hardened Images Trial – Part 1

First steps: Run your first secure, production-ready image

Container base images form the foundation of your application security. When those foundations contain vulnerabilities, every service built on top inherits the same risk. 

Docker Hardened Images addresses this at the source. These are continuously-maintained, minimal base images designed for security: stripped of unnecessary packages, patched proactively, and built with supply chain attestation. Instead of maintaining your own hardened bases or accepting whatever vulnerabilities ship with official images, you get production-ready foundations with near-zero CVEs and compliance metadata baked in.

What to Expect from Your 30-days Trial?

You’ve got 30 days to evaluate whether Docker Hardened Images fits your environment. That’s enough time to answer the crucial question: Would this reduce our security debt without adding operational burden?

It’s important to note that while DHI provides production‑grade images, this trial isn’t about rushing into production. Its primary purpose is educational: to let you experience the benefits of a hardened base image for supply‑chain security by testing it with the actual services in your stack and measuring the results.

By the end of the trial, you should have concrete results: 

CVE counts before and after, 

engineering effort required per image migration, and

whether your team would actually use this. 

Testing with real projects always outshines promises.

The DHI quickstart guide walks through the actions. This post covers what the docs don’t: the confusion points you may hit, what metrics actually matter, and how to evaluate results easily.

Step 1: Understanding the DHI Catalog 

To get started with your Free trial, you must be an organization owner or editor. This means you will get your own Repository where you can mirror images, but we’ll get back to this later.

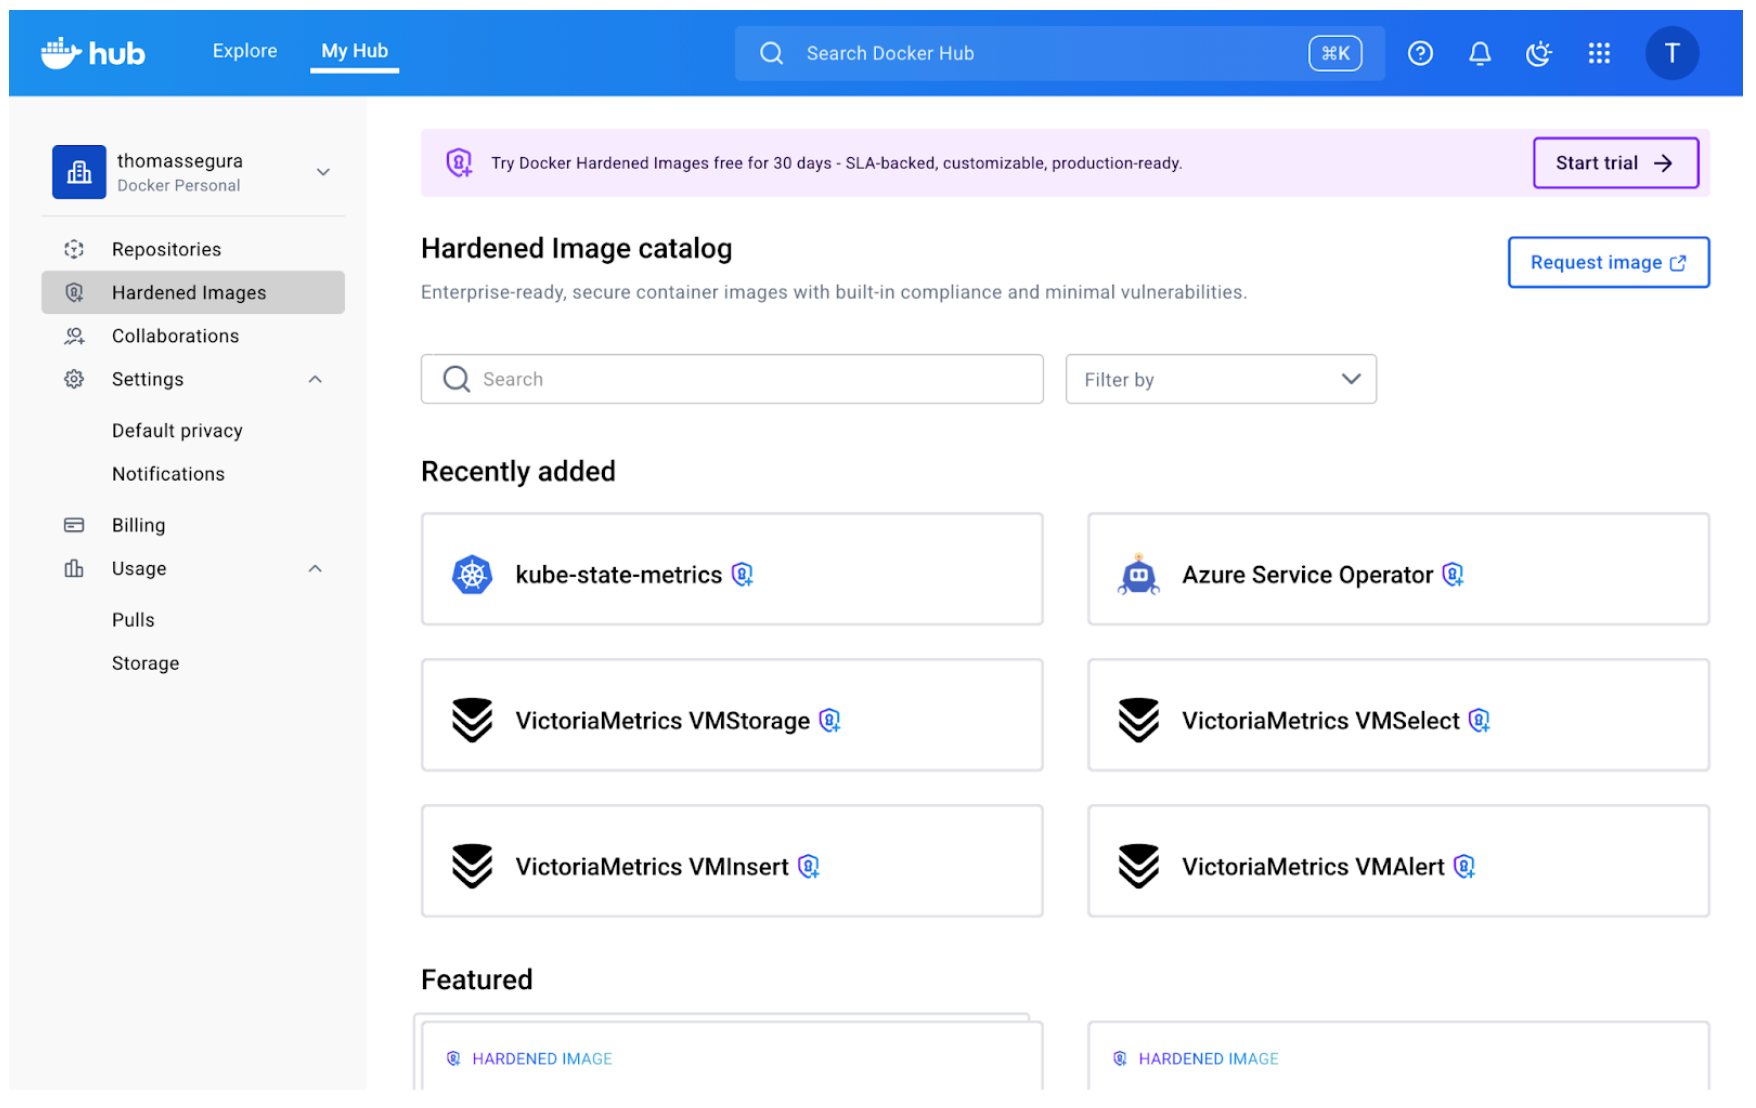
If you are familiar with Docker Hub, the DHI catalog should already look familiar:

The most obvious difference are the little lock icons indicating a Hardened Image. But what exactly does it mean?The core concept behind hardened images is that they present a minimal attack surface, which in practical terms means that only the strict minimum is included (as opposed to “battery-included” distributions like Ubuntu or Debian). Think of it like this: The hardened images maintain compatibility with the distro’s core characteristics (libc, filesystem hierarchy, package names) while removing the convenience layers that increase attack surface (package managers, extra utilities, debugging tools).So the “OS” designation you can see below every DHI means this image is built on top of those  distributions (uses the same base operating system), but with security hardening and package minimization applied.

Sometimes, you need these convenient Linux utilities, for development or testing purposes. This is where variants come into play.

The catalog shows multiple variants for each base image: standard versions, (dev) versions, (fips) versions. The variant choice matters for security posture. If you can run your application without a package manager in the final image (using multi-stage builds, for example), always choose the standard variant. Fewer tools in the container means fewer potential vulnerabilities.Here’s what they mean: Standard variants (e.g., node-base:24-debian13):

Minimal runtime images

No package managers (apk, apt, yum removed)

Production-ready

Smallest attack surface

Fips variants (e.g., node-base:24-debian13-fips):FIPS variants come in both runtime and build-time variants. These variants use cryptographic modules that have been validated under FIPS 140, a U.S. government standard for secure cryptographic operations. They are required for highly-regulated environments

Dev variants (e.g., node-base:24-debian13-dev):

Include package managers for installing additional dependencies

Useful during development or when you need to add packages at build time

Larger attack surface (but still hardened)

Not recommended for production

The catalog includes dozens of base images: language runtimes (Python, Node, Go), distros (Alpine, Ubuntu, Debian), specialized tools (nginx, Redis). Instead of trying to evaluate everything from the start, start narrow by picking one image (that you use frequently (Alpine, Python, Node are common starting points) for the first test.What “Entitlements” and “Mirroring” Actually MeanYou can’t just ‘docker pull’ directly from Docker’s DHI catalog. Instead, you mirror images to your organization’s namespace first. Here’s the workflow:

Your trial grants your organization access to a certain number of DHIs through mirroring: these are called entitlements.

As an organization owner, you first create a copy of the DHI image in your namespace (e.g., yourorg/dhi-node), which means you are mirroring the image and will automatically receive new updates in your repository.

Your team pulls from your org’s namespace, not Docker’s.

Mirroring takes a few minutes and copies all available tags. Once complete, the image appears in your organization’s repositories like any other image.Why this model? Two reasons:

Access control: Your org admins control which hardened images your team can use

Availability: Mirrored images remain available even if your subscription changes

The first time you encounter “mirror this image to your repository,” it feels like unnecessary friction. But once you realize it’s a one-time setup per base image (not per tag), it makes sense. You mirror node-base once and get access to all current and future Node versionsNow that you’ve mirrored a hardened image, it’s time to test it with an actual project. The goal is to discover friction points early, when stakes are low.

Step 2: Your First Real Migration Test

Choose a project that is:

Simple enough to debug quickly if something breaks (fewer moving parts)

Real enough to represent actual workloads

Representative of your stack

Drop-In Replacement

Open your Dockerfile and locate the FROM instruction. The migration is straightforward:

# Before
FROM node:22-bookworm-slim
# After
FROM <your-org-namespace>/dhi-node:22-debian13-fips

Replace your organization’s namespace and choose the appropriate tag. If you were using a generic tag like node:22, switch to a specific version tag from the hardened catalog (like 22-debian13-fips). Pinning to specific versions is a best practice anyway – hardened images just make it more explicit.

For other language runtimes, the pattern is similar:

# Python example
FROM python:3.12-slim
# becomes
FROM <your-org-namespace>/dhi-python-base:3.12-bookworm

# Node example
FROM node:20-alpine
# becomes
FROM <your-org-namespace>/dhi-node-base:20.18-alpine3.20

Build the image with your new base:

docker build . -t my-service-hardened

Watch the build output: if your Dockerfile assumes certain utilities exist (like wget, curl, or package managers), the build may fail. This is expected. Hardened bases strip unnecessary tools to reduce attack surface. Here are some common build failures and fixes:

Missing package manager (apt, yum):

If you’re installing packages in your Dockerfile, you’ll need to use the (dev) variant, and probably switch to a multi-stage build (install dependencies in a builder stage using a dev variant, then copy artifacts to the minimal runtime stage use a fips hardened base image variant)

Missing utilities (wget, curl, bash):

Network tools are removed unless you’re using a debug variant

Solution: same as above, install what you need explicitly in a builder stage, or verify you actually need those tools at runtime

Different default user:

Some hardened images run as non-root by default

If your application expects to write to certain directories, you may need to adjust permissions or use USER directives appropriately

For my Node.js test, the build succeeded without changes. The hardened Node base contained everything the runtime needed – npm dependencies installed normally, and the packages removed were system utilities my application never touched.

Verify It Runs

Build success doesn’t mean runtime success. Start the container and verify it behaves correctly:

docker run –rm -p 3000:3000 my-service-hardened

Test the service:

Does it start without errors?

Do API endpoints respond correctly?

Are logs written as expected?

Can it connect to databases or external services?

Step 3: Comparing What Changed

Before moving to measurement, build the original version alongside the hardened one:

# Switch to your main branch
git checkout main
# Build original version
docker build . -t my-service-original
# Switch back to your test branch with hardened base
git checkout dhi-test
# Build hardened version
docker build . -t my-service-hardened

Now you have two images to compare: one with the official base, one with the hardened base. Now comes the evaluation: what actually improved, and by how much?

Docker Scout

Docker Scout compares images and reports on vulnerabilities, package differences, and size changes. If you haven’t enrolled your organization with Scout yet, you’ll need to do that first (it’s free for the comparison features we’re using).

Run the comparison (here we are comparing Node base images) :

docker scout compare –to <your-org-namespace>/dhi-node:24.11-debian13-fips node:24-bookworm-slim

Scout outputs a detailed breakdown. Here’s what we found when comparing the official Node.js image to the hardened version.

1. Vulnerability Reduction

The Scout output shows CVE counts by severity:

                     Official Node          Hardened DHI
                      24-bookworm-slim       24.11-debian13-fips
Critical              0                      0
High                  0                      0
Medium                1                      0  ← eliminated
Low                   24                     0  ← eliminated
Total                 25                     0

The hardened image achieved complete vulnerability elimination. While the official image already had zero Critical/High CVEs (good baseline), it contained 1 Medium and 24 Low severity issues – all eliminated in the hardened version.Medium and Low severity vulnerabilities matter for compliance frameworks. If you’re pursuing SOC2, ISO 27001, or similar certifications (especially in regulated industries with strict security standards), demonstrating zero CVEs across all severity levels significantly simplifies audits.

2. Package Reduction 

Scout shows a dramatic difference in package count:

                     Official Node          Hardened DHI
Total packages        321                    32
Reduction             —                      289 packages (90%)

The hardened image removed 289 packages including:

apt (package manager)

gcc-12 (entire compiler toolchain)

perl (scripting language)

bash (replaced with minimal shell)

dpkg-dev (Debian package tools)

gnupg2, gzip, bzip2 (compression and crypto utilities)

dozens of libraries and system utilities

These are tools your Node.js application never uses at runtime. Removing them drastically reduces attack surface: 90% fewer packages means 90% fewer potential targets for exploitation.This is important because even if packages have no CVEs today, they represent future risk. Every utility, library, or tool in your image could become a vulnerability tomorrow. The hardened base eliminates that entire category of risk.

3. Size Difference

Scout reports image sizes:

                     Official Node          Hardened DHI
Image size            82 MB                  48 MB
Reduction             —                      34 MB (41.5%)

The hardened image is 41.5% smaller – that’s 34 MB saved per image. For a single service, this might seem minor. But multiply across dozens or hundreds of microservices, and the benefits start to become obvious: faster pulls, lower storage costs, and reduced network transfer.

4. Extracting and Reading the SBOM

One of the most valuable compliance features is the embedded SBOM (Software Bill of Materials). Unlike many images where you’d need to generate the SBOM yourself, hardened images include it automatically.

Extract the SBOM to see every package in the image:

docker scout sbom <your-org-namespace>/dhi-node:24.11-debian13-fips –format list

This outputs a complete package inventory:

Name                  Version          Type
base-files            13.8+deb13u1     deb
ca-certificates       20250419         deb
glibc                 2.41-12          deb
nodejs                24.11.0          dhi
openssl               3.5.4            dhi
openssl-provider-fips 3.1.2            dhi

The Type column shows where packages came from:

deb: Debian system packages

dhi: Docker Hardened Images custom packages (like FIPS-certified OpenSSL)

docker: Docker-managed runtime components

The SBOM includes name, version, license, and package URL (purl) for each component – everything needed for vulnerability tracking and compliance reporting.You can can easily the SBOM in SPDX or CycloneDX format for ingestion by a vulnerability tracking tools:

# SPDX format (widely supported)
docker scout sbom <your-org>/dhi-node:24.11-debian13-fips
  –format spdx
  –output node-sbom.json
# CycloneDX format (OWASP standard)
docker scout sbom <your-org>/dhi-node:24.11-debian13-fips
  –format cyclonedx
  –output node-sbom-cyclonedx.json

Beyond the SBOM, hardened images include 17 different attestations covering SLSA provenance, FIPS compliance, STIG scans, vulnerability scans, and more. We’ll explore how to verify and use these attestations in Part 2 of this blog series.

Trust, But Verify

You’ve now: Eliminated 100% of vulnerabilities (25 CVEs → 0) Reduced attack surface by 90% (321 packages → 32) Shrunk image size by 41.5% (82 MB → 48 MB) Extracted the SBOM for compliance tracking

The results look good on paper, but verification builds confidence for production. But how do you verify these security claims independently? In Part 2, we’ll explore:

Cryptographic signature verification on all attestations

Build provenance traced to public GitHub source repositories

Deep-dive into FIPS, STIG, and CIS compliance evidence

SBOM-driven vulnerability analysis with exploitability context

View related documentation:

Docker Hardened Images: Get Started

Docker Hardened Images catalog

Docker Scout Quickstart

Quelle: https://blog.docker.com/feed/

AWS Network Firewall is now available in the AWS New Zealand (Auckland) region

Starting today, AWS Network Firewall is available in the AWS New Zealand (Auckland) Region, enabling customers to deploy essential network protections for all their Amazon Virtual Private Clouds (VPCs). AWS Network Firewall is a managed firewall service that is easy to deploy. The service automatically scales with network traffic volume to provide high-availability protections without the need to set up and maintain the underlying infrastructure. It is integrated with AWS Firewall Manager to provide you with central visibility and control over your firewall policies across multiple AWS accounts. To see which regions AWS Network Firewall is available in, visit the AWS Region Table. For more information, please see the AWS Network Firewall product page and the service documentation.
Quelle: aws.amazon.com

Amazon EventBridge introduces enhanced visual rule builder

Amazon EventBridge introduces a new intuitive console based visual rule builder with a comprehensive event catalog for discovering and subscribing to events from custom applications, and over 200 AWS services. The new rule builder integrates the EventBridge Schema Registry with an updated event catalog and intuitive drag and drop canvas that simplifies building event-driven applications. With enhanced rule builder, developers can browse and search through events with readily available sample payloads and schemas, eliminating the need to find and reference individual service documentation. The schema-aware visual builder guides developers through creating event filter patterns and rules, reducing syntax errors and development time. The EventBridge enhanced rule builder is available today in all regions where the Schema Registry is launched. Developers can get started through the Amazon EventBridge console at no additional cost beyond standard EventBridge usage charges. For more information, visit the EventBridge documentation.
Quelle: aws.amazon.com

Announcing agreement EventBridge notifications for AWS Marketplace

AWS Marketplace now delivers purchase agreement events via Amazon EventBridge, transitioning from our Amazon Simple Notification Service (SNS) notifications for Software as a Service and Professional Services product types. This enhancement simplifies event-driven workflows for both sellers and buyers by enabling seamless integration of AWS Marketplace Agreements, reducing operational overhead, and improving event monitoring and automation. Marketplace sellers (Independent Software Vendors and Channel Partners) and buyers will receive notifications for all events in the lifecycle of their Marketplace Agreements, including when they are created, terminated, amended, replaced, renewed, cancelled or expired. Additionally, ISVs receive license-specific events to manage customer entitlements. With EventBridge integration, you can route these events to various AWS services such as AWS Lambda, Amazon S3, Amazon CloudWatch, AWS Step Functions, and Amazon SNS, maintaining compatibility with existing SNS-based workflows while gaining advanced routing capabilities. EventBridge notifications are generally available and can be created in AWS US East (N. Virginia) Region. To learn more about AWS Marketplace event notifications, see the AWS Marketplace documentation. You can start using EventBridge notifications today by visiting the Amazon EventBridge console and enabling the ‘aws.agreement-marketplace’ event source.
Quelle: aws.amazon.com

AWS Lambda announces Provisioned Mode for SQS event source mapping (ESM)

AWS Lambda announces Provisioned Mode for SQS event-source-mappings (ESMs) that subscribe to Amazon SQS, a feature that allows you to optimize the throughput of your SQS ESM by provisioning event polling resources that remain ready to handle sudden spikes in traffic. SQS ESM configured with Provisioned Mode scales 3x faster (up to 1000 concurrent executions per minute) and supports 16x higher concurrency (up to 20,000 concurrent executions) than default SQS ESM capability. This allows you to build highly responsive and scalable event-driven applications with stringent performance requirements. Customers use SQS as an event source for Lambda functions to build mission-critical applications using Lambda’s fully-managed SQS ESM, which automatically scales polling resources in response to events. However, for applications that need to handle unpredictable bursts of traffic, lack of control over the throughput of ESM can lead to delays in event processing. Provisioned Mode for SQS ESM allows you to fine tune the throughput of the ESM by provisioning a minimum and maximum number of polling resources called event pollers that are ready to handle sudden spikes in traffic. With this feature, you can process events with lower latency, handle sudden traffic spikes more effectively, and maintain precise control over your event processing resources. This feature is generally available in all AWS Commercial Regions. You can activate Provisioned Mode for SQS ESM by configuring a minimum and maximum number of event pollers in the ESM API, AWS Console, AWS CLI, AWS SDK, AWS CloudFormation, and AWS SAM. You pay for the usage of event pollers, along a billing unit called Event Poller Unit (EPU). To learn more, read Lambda ESM documentation and AWS Lambda pricing. 
Quelle: aws.amazon.com