Announcing MongoDB connector for Apigee Integration

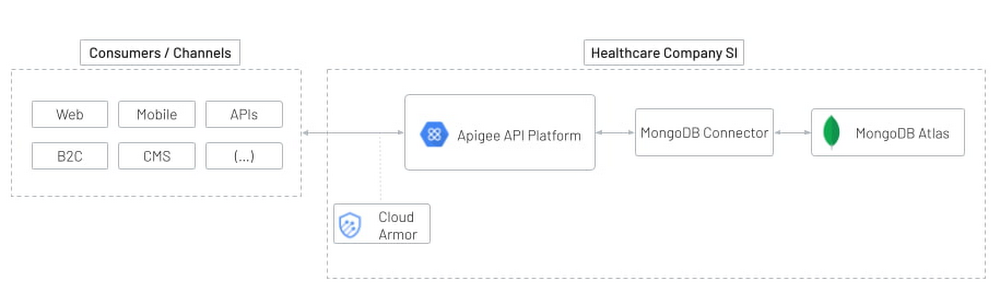
MongoDB is a developer friendly application data platform that makes it easy for developers to access a wide variety of data using a unified language interface, simplifying the data handling process. MongoDB Atlas , MongoDB’s fully managed cloud database, enhances MongoDB’s capabilities even further with full-text search and real-time analytics, as well as event-driven and mobile experiences.Google Cloud’s Apigee is an industry-leading, full lifecycle API management platform that provides businesses control over and visibility into the APIs that connect applications and data across the enterprise and across clouds. MongoDB and Apigee have already partnered to provide a solution to ease and secure access to siloed data for internal developers or partners. Today, we are further simplifying this solution by announcing a new connector between Apigee and MongoDB. How is it simpler?It can be complex to connect data and applications. Developers need to create and maintain custom transactional code between cloud apps to create the connection between the data source and application:This code is often the first one to breakIt is not cost effective as it is not reusable.Last year, Google Cloud announced Apigee Integration, a solution that helps enterprises easily connect their existing data and applications and surface them as accessible APIs that can power new experiences, expand digital ecosystems and protect access to critical assets. Apigee provides a secure facade between the frontend application and data source to speed up the development process using standard interfaces and a simplified developer experience.Apigee Integration now includes an out-of-the-box MongoDB connector. With this connector, developers can perform CRUD operations on a MongoDB database. The need for setting up the programming modules and exposing  them using the RESTful interface is eliminated. The connection to MongoDB Atlas can be set up directly using the Apigee UI with support for advanced MongoDB connection settings.As the connector is part of Apigee Integration it also provides the ability to transform the data using the transformation enginefrom Google Cloud.You can easily design your transformation logic using a drag-and-drop interface, manage variables in different formats (Json, String, Arrays..) and conditional flows. A concrete exampleA Healthcare company needs to share datasets with external partners. They chose MongoDB Atlas as it is fully managed and for its dynamic schema that is ideal for building modern applications. Their partners can only consume the data through an API. For security reasons, they will not be able to access the database directly.Fig.1 shows how simple it is to implement a “plug and play” approach for this scenario, with built in security at the edge of Google Cloud to prevent attacks using Cloud Armor and Apigee as well as providing fine grained governance for the partners.Figure 1: High level architecture that illustrates how to expose MongoDB Atlas through a Apigee platform without codeFig.2 shows how easily the MongoDB connector can be deployed in the Integration designer, without maintaining any infrastructure. The business logic, like sensitive data approval, can be added to the connector, before the data is returned to the partner.  In this example :The flow is triggered by an API call exposed by ApigeeThe MongoDB connector retrieves the data If the DataClass retrieved is A, an approval will be requested on the UI.If the DataClass retrieved is B, only the necessary fields will be sent back to the consumer using the filtering capabilities.Figure 2: Designer example to call MongoDB connector from Apigee Integration and implement an approval workflow and data mappingDevelopers Save Time in a Secure EnvironmentWith this new integration between Apigee and MongoDB Atlas, developers now have a simpler experience for accessing relevant data.Instead of wasting time building transactional code, they can focus on implementing business scenarios in a secure and scalable environment.Next StepsIntroduction to Apigee X.Learn more about MongoDB Atlas.Learn about Apigee connectors.Learn how to set up an Apigee MongoDB connector.Extend your data to new uses with MongoDB and Apigee – blog.We thank the many Google Cloud and MongoDB team members who contributed to this collaboration.
Quelle: Google Cloud Platform

Announcing more Azure VMware Solution enhancements

I’m writing to you today from VMware Explore in Barcelona, where my team and I are presenting to and meeting with customers and partners in person! When we launched Azure VMware Solution two years ago amid a pandemic, IT agility became a top priority as organizations scrambled to enable remote work and ensure business resilience via cloud solutions. In today’s economic climate most organizations want to do more with less. They recognize that by running workloads in the cloud, they can respond more rapidly and reduce IT infrastructure costs.

"I can definitely say that Azure—and in particular Azure VMware Solution—is the right solution for us. It allows us to seamlessly move from on-premises to the cloud, thereby freeing up resources and capital investments that can be used where they are needed more.”—Giorgio Veronesi, Sr. Vice President of ICT Infrastructure, Snam.

Given that TCO is top priority for most companies in the current economic climate, migrating your VMware workloads to Azure is a great way to reduce the cost of maintaining an on-premises VMware environment. Because every customer starts their cloud journey at a different place, we help enable customers to migrate to the cloud on their terms and maintain support for the business platforms and investments they have today.  Azure VMware Solution is an easy way to extend and migrate existing VMware Private Clouds to run them natively on Azure. Azure VMware Solution offers symmetry with on-premises environments, which helps to accelerate datacenter migrations, so customers recognize the benefits of the cloud sooner.

"With help from Microsoft and Mobiz, we were able to deliver a fully qualified landing zone in Azure in one-third the time and at one-third the budget compared to previous cloud efforts."—Sam Chenaur: Vice President and Global Head of Infrastructure, Sanofi.

In keeping with the goal of doing more with less, Microsoft’s unique Azure Hybrid Benefit and Extended Security Updates for Windows Server and SQL Server, Azure VMware Solution is one of the fastest and most cost-effective ways to seamlessly migrate and run VMware in the cloud. If you want to learn more about TCO in your organization read this Forrester paper.

Check out what’s new in Azure VMware Solution

I am excited to share some of the recent updates we’ve made to Azure VMware Solution.

Stretched Clusters for Azure VMware Solution, now in preview, provides 99.99 percent uptime for mission critical applications that require the highest availability. In times of availability zone failure, your virtual machines (VMs) and applications automatically failover to an unaffected availability zone with no application impact. Learn more.
Azure NetApp Files Datastores is now generally available to run your storage intensive workloads on Azure VMware Solution. This integration between Azure VMware Solution and Azure NetApp Files enables you to create datastores via the Azure VMware Solution resource provider with Azure NetApp Files NFS volumes and attach the datastores to your private cloud clusters of choice. Learn more.
Customer-managed keys for Azure VMware Solution is now in preview, both supporting higher security for customers’ mission-critical workloads and providing you with control over your encrypted vSAN data on Azure VMware Solution. With this feature, you can use Azure Key Vault to generate customer-managed keys as well as centralize and streamline the key management process. Learn more.
New node sizing for Azure VMware Solution. Start leveraging Azure VMware Solution across two new node sizes with the general availability of AV36P and AV52 in AVS. With these new node sizes organizations can optimize their workloads for memory and storage with AV36P and AV52. Learn more.
Microsoft Azure native services let you monitor, manage, and protect your virtual machines (VMs) in a hybrid environment (Azure, Azure VMware Solution, and on-premises). Here are some of the existing Azure services: Azure Arc, Azure Monitor, Microsoft Defender for Cloud, Azure Update Management, and Log Analytics Workspace. Learn more.

If you would like to stay up to date with the latest releases from Azure VMware Solution, please follow  Azure updates.

Learn more

This week we are offering a special opportunity to take the Azure VMware Solution Cloud Skills Challenge. Compete in this free, self-paced, Microsoft learning path and advance your technical skills at the same time! Register for the Challenge.

And if you are here at VMware Explore Barcelona, stop by the Microsoft booth, and say hello. We are excited to see you in person!

Check out all our Azure Breakout Sessions during the event.
Visit Booth #401 for our hourly in-booth theater sessions.

You can also attend our next Azure Webinar on December 15th: How to Modernize Your VMware Environment with Microsoft Azure.

As always, you can visit the Azure VMware Solution website or documentation for more information.
Quelle: Azure

Accelerate your cloud-native journey with Azure Monitor

This blog was co-authored by Xema Pathak, Senior Product Manager; Sahil Arora, Principal PM Lead; Matthew McCleary, Senior Program Manager and Brian Wren, Principal Content Developer.

Organizations are going through an era of digital transformation and are embracing various cloud-native technologies to fuel innovation. Developers are critical to this transformation; they need to quickly bring innovation to the market to address customer needs. At Microsoft Azure, we aspire to be the platform to empower you to accelerate your cloud-native journey!

Applications developed on Azure deliver reliability, scalability, and the ability to handle huge amounts of workloads anywhere around the world. These cloud-native apps take advantage of containers, serverless technology, and micro-services-based architecture with Azure Kubernetes Service, Azure Container Apps, and Azure Functions.

Such a growing application environment brings new challenges. Business acceleration is far more than just adopting cloud-native technologies, it’s also about agility and scale. We recognize how onerous it can be for developers to configure and monitor the infrastructure and distributed microservices. Once microservices are deployed, you need the ability to effectively detect and troubleshoot issues to ensure that you provide performance and reliability to your customers. Combating these challenges requires a reliable and scalable monitoring solution that seamlessly combines metrics, logs, and dashboards into a single experience.

Our team has been busy bringing you a reliable, scalable, and secure monitoring service with Azure Monitor. We are excited to share our new offerings—Azure Monitor managed service for Prometheus (preview) and Azure Managed Grafana. They complement existing Azure Monitor tools to help you monitor each layer of your full cloud-native stack on Kubernetes and quickly troubleshoot issues across microservices and infrastructure. Additionally, you can now set up collection for Prometheus metrics and container logs and view them in Grafana dashboards with a single click!

The new Azure Monitor managed service for Prometheus (preview) gives you a fully managed cloud-native metrics solution to ingest, alert on, and query your Prometheus metrics, which provide visibility to the health and performance of your infrastructure and applications. Azure monitor container insights increases your visibility with a fully managed cloud-native logs solution for advanced troubleshooting by analyzing container stdout, stderr, and infrastructure logs. You can quickly identify and mitigate latency and reliability issues using distributed traces with Azure Monitor application insights with preview OpenTelemetry-based instrumentation, which is a fully managed application and performance monitoring (APM) solution. Take your DevOps and site reliability engineering productivity to the next level with the new Azure Managed Grafana with plugins for Azure Monitor, which gives you a fully managed service for full-stack troubleshooting dashboards.

Let’s take a look at how simple it is to configure the monitoring for your kubernetes clusters with Azure Monitor and how to quickly identify the issues across each layer of your full cloud-native stack.

Monitor with highly available, scalable, and secure managed service for Prometheus

Prometheus has become a de facto standard for Kubernetes monitoring to collect a rich set of metric types and visualize them with Grafana, which offers a huge set of community dashboards. However, running self-managed Prometheus is challenging to scale for enterprise workloads, requiring significant time and bandwidth to set up and maintain Kubernetes monitoring deployments. We are introducing Azure Monitor Managed service for Prometheus (preview) to overcome the challenges of self-managed Prometheus and help you accelerate innovation by carrying out frequent high-scale deployments for your services.

Azure Monitor managed service for Prometheus (preview) is a fully managed service that provides a highly available, scalable, and enterprise-grade secure service to easily monitor applications and services running in a containerized environment. Use it as a drop-in replacement for self-managed Prometheus or as remote storage option. Our remote write interface allows you to continue using your self-managed Prometheus, adding the benefits of our managed service such as high-availability, scaling, monitoring across clusters, and long-term data retention.

Easily troubleshoot issues with logs

With Azure Monitor’s unified cloud-native offering for Kubernetes monitoring, you can easily set up log collection alongside managed service for Prometheus. Azure Monitor container insights collects troubleshooting logs, provides recommended alerts to proactively identify issues, and has visualizations to monitor health and performance of your Kubernetes cluster. It complements Prometheus and Grafana for end-to-end Kubernetes monitoring across microservices and infrastructure. With Azure Monitor, you can easily:
•    Identify any resource bottlenecks and perform advanced debugging for any implicit failures.
•    Proactively lookout for any failures or outages by configuring alerts and notifications on Prometheus metrics and container logs.
•    Continuously observe the overall health of your infrastructure and correlate metrics and logs under a single view.


Observe your full-stack with Azure Managed Grafana and OpenTelemetry-based instrumentation

Once you have the monitoring data, it is imperative to bring it all together for continuous observability. To gain more insights for the data you collect, link Azure Managed Grafana to managed service for Prometheus. This offers a curated set of popular open source Grafana dashboards built on top of Prometheus metrics out-of-the-box. You can also combine application metrics and infrastructure metrics from various data sources into a single dashboard for full-stack observability.

At the application layer, Azure Monitor’s preview OpenTelemetry-based instrumentation allows you to use open source technologies to collect additional telemetry from within your application components. We are announcing new capabilities for our preview OpenTelemetry-based offering including metrics, sampling, and resilient data transport. This makes it easier to start using OpenTelemetry APIs with Azure Monitor Application Insights. There’s no need to configure additional agents or other system processes on your cluster. In the video below, check out our recent progress in bringing OpenTelemetry and Grafana to Azure and learn more about the value they can bring to your project.

As cloud-native technologies become central to digital transformation, we are focused on empowering developers to unlock productivity and innovation. We continue to innovate and add more capabilities that allow you to provide performant and reliable experiences to your customers. Get started with monitoring Kubernetes clusters with Azure Monitor.

Learn more
•    Learn more about Azure Monitor managed service for Prometheus and read our technical documentation.
•    Learn more on how to get started with Azure Monitor’s unified cloud-native offering for Kubernetes monitoring.
•    Read the Grafana integrations with Azure Monitor blog.
•    Learn more about OpenTelemetry with Azure Monitor.
Quelle: Azure

Amazon QuickSight ermöglicht Row Level Security (RLS) auf Dataset-as-a-source

Amazon QuickSight hat die neue Funktion für Row Level Security (RLS) auf Dataset-as-a-Source eingeführt. Hierbei handelt es sich um eine Folgefunktion zur Verbesserung des Sicherheitsniveaus für die aktuelle QuickSight-Funktion „Dataset-as-a-Source“. Wenn einer der übergeordneten QuickSight-Datensätze RLS-fähig ist, war bisher die Erstellung eines untergeordneten Datensatzes aus diesem übergeordneten Datensatz blockiert. Mit der neuen Funktion können Kunden nun untergeordnete Datensätze mit den vom übergeordneten Datensatz geerbten RLS-Regeln erstellen. Bei der Abfrage des untergeordneten Datensatzes wendet QuickSight den übergeordneten RLS-Filter zur Laufzeit auf die übergeordneten Daten an. Weitere Informationen finden Sie hier.
Quelle: aws.amazon.com

Amazon Pinpoint-Konsole unterstützt jetzt Pool-Management

Heute hat Amazon Pinpoint Pool-Management-Funktionen innerhalb der Amazon Pinpoint-Konsole angekündigt. Das Pool-Management, eine Funktion, mit der Sie Telefonnummern und Absender-IDs für den SMS-Versand gruppieren können, wurde Anfang des Jahres als Teil unserer Version 2.0 der SMS- und Sprach-API veröffentlicht und ist nun in der Amazon Pinpoint-Benutzeroberfläche zur individuellen Konfiguration verfügbar.
Quelle: aws.amazon.com

AWS App Runner bietet nun Unterstützung für verwaltete PHP-, Go-, .Net- und Ruby-Laufzeiten

AWS App Runner unterstützt jetzt PHP 8.1, Go 1.18, .Net 6 und Ruby 3.1 verwaltete Laufzeiten zur Erstellung und Ausführung von Webanwendungen und APIs. Diese Laufzeiten ermöglichen es Ihnen, die App Runner-Fähigkeit „Build from source“-Fähigkeit zu nutzen, um direkt von Ihrem Quellcode-Repository aus zu kompilieren und bereitzustellen, ohne dass Sie sich mit den Interna der Erstellung und Verwaltung Ihrer eigenen Container-Images auseinandersetzen müssen.
Quelle: aws.amazon.com

CloudWatch RUM unterstützt jetzt erweiterte CloudWatch-Metriken mit zusätzlichen Dimensionen

Amazon CloudWatch RUM kann jetzt RUM-Metriken mit zusätzlichen Dimensionen an CloudWatch senden. CloudWatch RUM kann verwendet werden, um den Client-seitigen Zustand und die Leistung Ihrer Webanwendung zu erfassen und anzuzeigen. Aktuell sendet RUM automatisch aggregierte Metriken zum Zustand der Benutzersitzungen an CloudWatch Metrics. Sie können nun zusätzliche Dimensionen zu diesen Standardmetriken hinzufügen, um einen detaillierteren Überblick über Ihre RUM-Metriken zu erhalten.
Quelle: aws.amazon.com






