In the rapidly evolving landscape of AI-assisted development, most developers continue to struggle with clunky web interfaces, resource-intensive IDEs, and fragmented toolchains. But what if we told you there’s a combination that pairs Google’s 76.3K-star Gemini CLI (in just 5 months) with Docker’s innovative MCP Toolkit, quietly revolutionizing how modern AI developers work?
Enter the powerhouse duo: Gemini CLI and Docker MCP Toolkit. This isn’t just another tool combination — it’s a paradigm shift that delivers developer AI assistance with zero complexity overhead. A one-time setup of just 5 minutes can save you 20 minutes per test scenario — that’s a 97% time reduction that compounds with every test you run.
Let’s look at a concrete example: browser testing and performance analysis that developers do regularly can be simplified and completely automated. What used to require opening browsers, clicking through flows, analyzing DevTools, taking screenshots, and manually documenting buys can now happen in a single 30-second conversation.
In this guide, you’ll learn how to:
Set up Gemini CLI and connect it to Docker MCP Toolkit
Configure the Playwright MCP server for browser automation
Configure the GitHub MCP server for issue creation
Configure the Filesystem MCP server for saving test artifacts
Automate browser testing that discovers real bugs and creates documented GitHub issues
See how Gemini CLI can analyze performance, capture screenshots, and report findings—all without leaving your terminal
With 220+ pre-built MCP servers, browser automation becomes as simple as having a conversation. No Selenium WebDriver configuration, no CI/CD pipeline complexity, no manual screenshot management — just natural language instructions that execute real browser tests.
Why Gemini CLI and Docker MCP Toolkit Work Better Together
Manual browser testing and performance analysis are broken. You open Chrome DevTools, click through pages, check network requests, analyze performance metrics, take screenshots, write bug reports, and then manually create GitHub issues. This context-switching nightmare wastes hours every sprint.
Traditional automation tools don’t solve the real problem. Selenium requires brittle selectors and a complex setup. Playwright needs JavaScript knowledge and test frameworks. Both require maintaining test scripts that break with every UI change. The “solution” often takes more time than manual testing.
While Gemini provides powerful AI capabilities and MCP provides the protocol, Docker MCP Toolkit makes browser automation practical. Without containerization, setting up browser testing means managing Chrome/Firefox installations, dealing with WebDriver versions, configuring Node.js dependencies, handling screenshot directories manually, and different configurations for every developer’s machine. The setup that should take 2 minutes takes 2-6 hours per developer.
Docker MCP Toolkit eliminates this friction:
220+ pre-built MCP servers in the catalog
One-click deployment through Docker Desktop
Playwright MCP with browsers pre-installed (Chrome, Firefox, WebKit)
GitHub MCP for automated issue creation
Filesystem MCP for artifact storage
Secure credential management via OAuth or encrypted storage
Consistent configuration across Mac, Windows, and Linux
Automatic updates when new server versions are released
We built Docker MCP Toolkit to meet developers where they are. If you’re using Gemini CLI, you should be able to automate browser testing without wrestling with infrastructure.
Your tests run securely on your machine. Everything executes in isolated Docker containers on your local system. Test data, screenshots, and application access never leave your computer. No cloud uploads, no third-party services, no compliance concerns. You get enterprise-grade browser automation with complete privacy.
Setting up Gemini CLI in Docker MCP Toolkit
Prerequisites
Install Docker Desktop 4.40 or later
Enable MCP Toolkit
Step 1. Install Gemini CLI
Install via npm:
npm install -g @google/gemini-cli
Step 2. Launch and authenticate
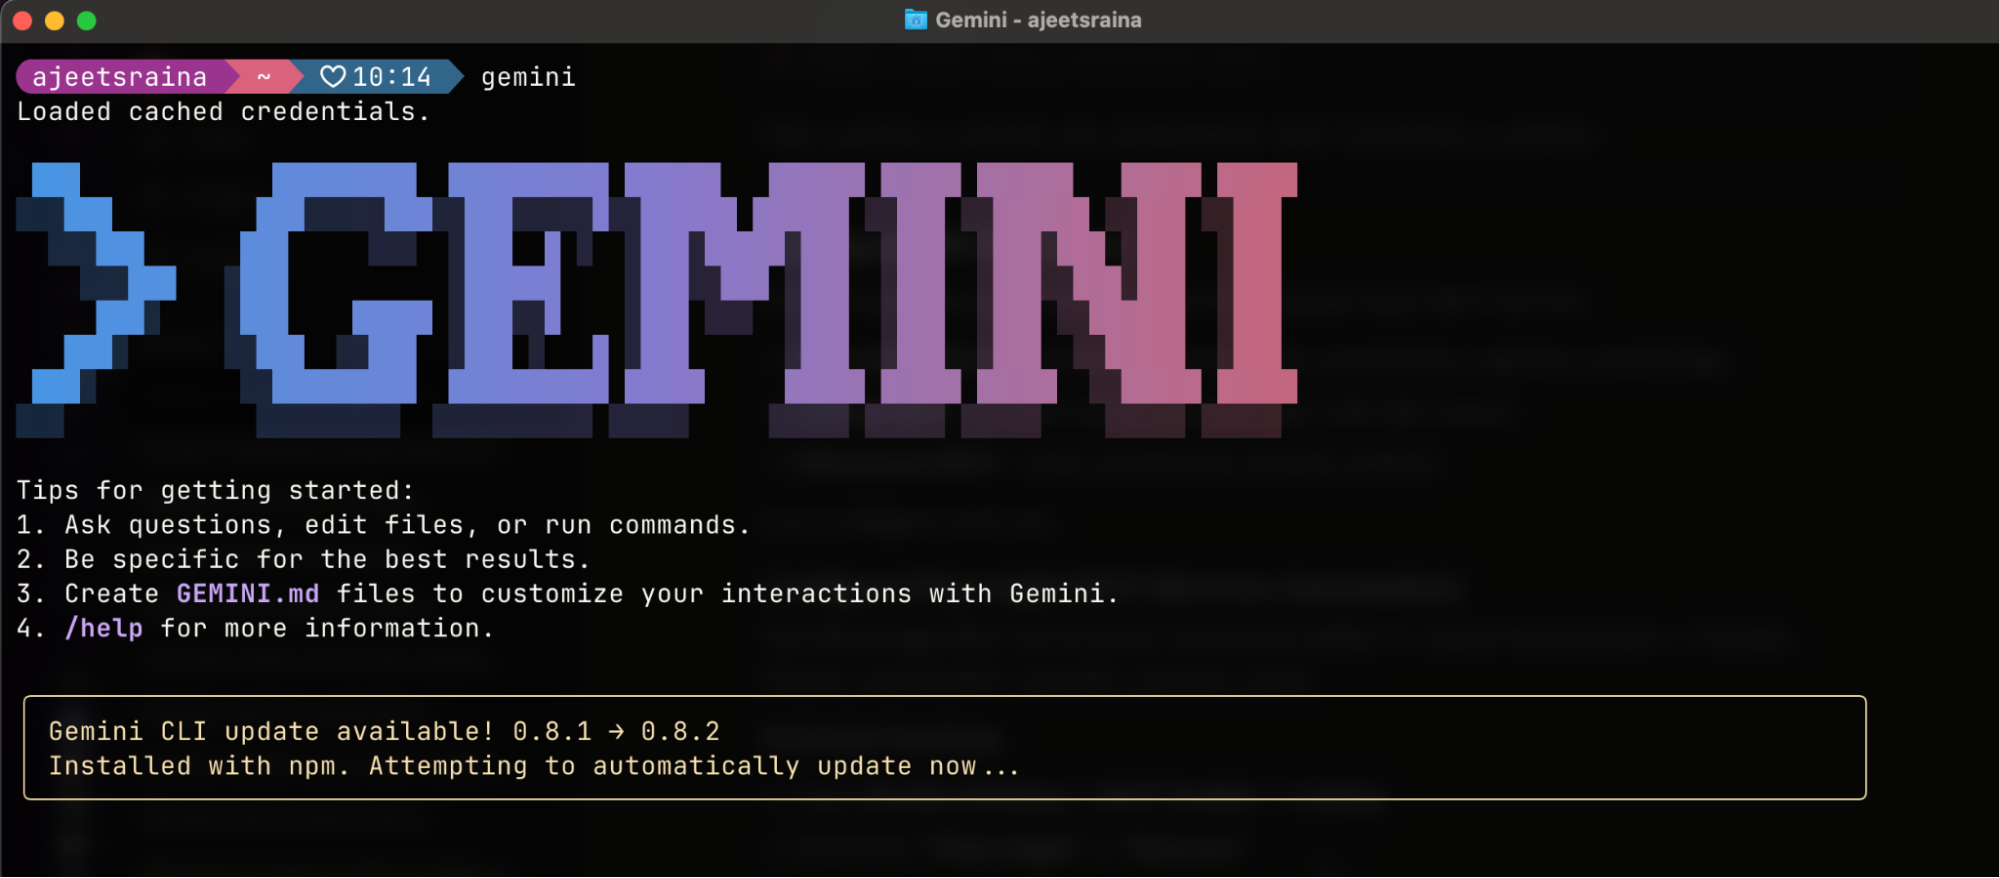
Once installed, just type gemini in your terminal window.
gemini
Step 3. Log in via Google
Follow the setup wizard:
Select a preferred theme style from the options.
Choose a login method. I recommend “Login with Google”, which allows up to 60 requests/minute and 1,000 requests/day for free
In case you need higher rate limits or enterprise access, I suggested you use an API key from Google AI Studio. You can easily set it as an environment variable:
export GEMINI_API_KEY="YOUR_API_KEY"
After selecting your sign-in method, a browser window will open. Simply log in with your Google account
Step 4. Start chatting with Gemini
Just type “gemini” in your terminal window to start chatting with Gemini and enter your prompt.
Connect Gemini CLI to Docker MCP Toolkit
Option 1: One-Click Connection (Recommended)
Open Docker Desktop
Navigate to MCP Toolkit in the sidebar
Click the Clients tab
Find “Gemini” in the list.
Click Connect
Docker Desktop automatically configures the MCP Gateway connection – the underlying infrastructure that routes requests between Gemini CLI and your MCP servers, handling authentication, containerisation, and secure communication seamlessly.
Option 2: Manual Command Line SetupIf you prefer a command-line setup or need to configure a specific project:
Navigate to your project folder in the terminal
Run this command:
docker mcp client connect gemini –global
You’ll see output like this:
=== System-wide MCP Configurations ===
● gemini: connected
MCP_DOCKER: Docker MCP Catalog (gateway server) (stdio)
● gordon: connected
MCP_DOCKER: Docker MCP Catalog (gateway server) (stdio)
You might have to restart 'gemini'.
The connected status confirms Gemini CLI is linked to the Docker MCP Gateway.
What’s happening under the hood?
The Gemini CLI uses the mcpServers configuration in your settings.json file to locate and connect to MCP servers. This configuration supports multiple servers with different transport mechanisms. The mcpServers object is where you define each MCP server you want the CLI to connect to.
Whenever you hit the “Connect” button under the Docker MCP Client for Gemini CLI, it adds the following Docker MCP Gateway configuration to the ~/.gemini/settings.json file.
{
"theme": "Default",
"selectedAuthType": "oauth-personal",
"mcpServers": {
"MCP_DOCKER": {
"command": "docker",
"args": ["mcp", "gateway", "run"],
"env": {}
}
}
}
Learn more about MCP and Gemini CLI interaction through this link.
Step 5. Restart Gemini CLI
# Exit Gemini CLI if running, then restart
gemini
Step 6. Verify the Connection
Inside Claude Code, type /mcp to see available MCP servers.
You should see the Docker MCP Gateway listed, which provides access to all enabled MCP servers. The /MCP_DOCKER tools indicate a successful connection. As you enable more MCP servers in Docker Desktop, they’ll appear here automatically.
First Run: What to Expect
When you start Gemini CLI for the first time after connecting to Docker MCP Toolkit, you’ll see a prompt about the new MCP server:
Choose Option 1 (recommended). This configures your project to automatically use Docker MCP Toolkit and any MCP servers you enable in Docker Desktop. You won’t need to approve MCP servers individually each time.
You’re now ready to use Gemini with MCP servers from Docker Desktop.
Real-World Demo: Automated Browser Testing and Performance Analysis
Now that you’ve connected Gemini CLI to Docker MCP Toolkit, let’s see it in action with a practical example. We’ll automatically discover real bugs through browser testing and identify performance bottlenecks through detailed analysis — the kind that would take 20 minutes of manual testing, DevTools monitoring, and performance profiling.
What Makes This Realistic?
This isn’t a trivial “Hello World” demo. We’re performing comprehensive browser testing and performance analysis on a real e-commerce application with the kinds of issues you encounter in production:
Uses actual application running on localhost
Executes functional browser tests (navigation, element inspection, console monitoring)
Discovers genuine performance bottlenecks through browser DevTools analysis
Identifies accessibility violations that affect real users
Captures evidence with screenshots and console logs
Measures real performance metrics: page load times, network requests, resource usage
Creates properly formatted GitHub issues with actionable recommendations
Time investment:
Manual process: ~20 minutes (opening browsers, clicking through flows, DevTools analysis, performance profiling, documentation, issue creation)
Automated with Gemini CLI + MCP: ~30 seconds total
That’s a 97% time reduction, but more importantly, it’s consistent, thorough, and documented every time.
What We’re Testing
The catalog-service-node application is a realistic e-commerce catalog with intentional issues that mirror common production problems:
Performance Issues:
No pagination – loads all 15 products at once (will degrade with scale)
Duplicate API calls – requests /api/products twice unnecessarily
Missing optimization – unoptimized loading patterns
Accessibility Issues:
Missing product images – placeholder buttons instead of actual images
Vague button labels – “Fetch” and “Upload” aren’t descriptive for screen readers
Missing ARIA labels – table structure not properly announced
Browser Issues:
Missing favicon – generates 404 errors in console
Console warnings – duplicate request warnings
Let’s see if Gemini CLI can discover all of these automatically through intelligent browser testing and performance analysis, then create a comprehensive GitHub issue.
Step 1: Set Up a Real-World e-Commerce Catalog application
For this demo, we’ll use a real e-commerce catalog application. This gives us realistic performance and accessibility issues to discover.
Clone the repository:
git clone https://github.com/ajeetraina/catalog-service-node
cd catalog-service-node
Start all services:
# Start Docker services (database, S3, Kafka)
docker compose up -d
# Install dependencies
npm install –omit=optional
# Start the application
npm run dev
Verify it’s running:
Frontend: http://localhost:5173
API: http://localhost:3000
Step 2: Seed Test Data
To make testing realistic, create sample products:
# Create seed script
cat > seed-data.sh << 'EOF'
#!/bin/bash
API_URL="http://localhost:3000/api"
echo "Seeding test products…"
curl -s -X POST "$API_URL/products"
-H "Content-Type: application/json"
-d '{"name":"Vintage Camera","description":"Classic 35mm film camera","price":299.99,"upc":"CAM001"}'
> /dev/null && echo "✅ Vintage Camera"
curl -s -X POST "$API_URL/products"
-H "Content-Type: application/json"
-d '{"name":"Rare Vinyl Record – LAST ONE!","description":"Limited edition. Only 1 left!","price":149.99,"upc":"VINYL001"}'
> /dev/null && echo "✅ Rare Vinyl Record"
curl -s -X POST "$API_URL/products"
-H "Content-Type: application/json"
-d '{"name":"Professional DSLR Camera","description":"50MP camera with 8K video","price":2499.99,"upc":"CAMPRO001"}'
> /dev/null && echo "✅ Professional DSLR"
# Add bulk test products
for i in {4..15}; do
curl -s -X POST "$API_URL/products"
-H "Content-Type: application/json"
-d "{"name":"Test Product $i","description":"Bulk test product $i","price":$((50 + RANDOM % 450)).99,"upc":"BULK$(printf '%03d' $i)"}"
> /dev/null && echo "✅ Test Product $i"
done
echo ""
TOTAL=$(curl -s "$API_URL/products" | jq '. | length')
echo "Total products: $TOTAL"
echo "Ready! Visit http://localhost:5173"
EOF
chmod +x seed-data.sh
./seed-data.sh
Expected output:
Seeding test products…
✅ Vintage Camera
✅ Rare Vinyl Record
✅ Professional DSLR
✅ Test Product 4
✅ Test Product 5
…
✅ Test Product 15
Total products: 15
Ready! Visit http://localhost:5173
Now you have a realistic environment with 15 products to analyze.
Configure MCP Servers
For browser testing and performance analysis automation, you’ll orchestrate three MCP servers:
Playwright MCP – Controls browsers, takes screenshots, captures console logs
GitHub MCP – Creates issues automatically with full context
Filesystem MCP – Saves screenshots and test artifacts
Let’s configure each one.
Configure Playwright MCP (Browser Automation)
The Playwright MCP server gives Gemini the ability to control real browsers, Chrome, Firefox, and WebKit, just like a human would.
In Docker Desktop:
Open Docker Desktop → MCP Toolkit → Catalog
Search for “Playwright” or “Browser”
Find Playwright (Browser Automation) in the results
Click + Add
The server will be added with default configuration (no additional setup needed)
Click Start Server
What you get:
21+ browser automation tools including:
browser_navigate – Navigate to URLs
browser_snapshot – Capture page state for analysis
browser_take_screenshot – Save visual evidence
browser_click, browser_type – Interact with elements
browser_console_messages – Get console errors
browser_network_requests – Analyze HTTP requests
The Playwright MCP runs in a secure Docker container with browsers pre-installed. No manual ChromeDriver setup, no WebDriver conflicts, no OS-specific browser installations.
Configure GitHub MCP (Issue Creation)
The GitHub MCP enables Gemini to create issues, PRs, and manage repositories on your behalf.
Option 1: OAuth Authentication (Recommended – Easiest)
In MCP Toolkit → Catalog, search “GitHub Official”
Click + Add
Go to the OAuth tab in Docker Desktop
Find the GitHub entry
Click “Authorize”
Your browser opens GitHub’s authorization page
Click “Authorize Docker” on GitHub
You’re redirected back to Docker Desktop
Return to Catalog tab, find GitHub Official
Click Start Server
Advantage: No manual token creation. Authorization happens through GitHub’s secure OAuth flow with automatic token refresh.
Option 2: Personal Access Token (For Granular Control)
If you prefer manual control or need specific scopes:
Step 1: Create GitHub Personal Access Token
Go to https://github.com and sign in
Click your profile picture → Settings
Scroll to “Developer settings” in the left sidebar
Click “Personal access tokens” → “Tokens (classic)”
Click “Generate new token” → “Generate new token (classic)”
Name it: “Docker MCP Browser Testing”
Select scopes:
repo (Full control of repositories)
workflow (Update GitHub Actions workflows)
Click “Generate token”
Copy the token immediately (you won’t see it again!)
Step 2: Configure in Docker Desktop
In MCP Toolkit → Catalog, find GitHub Official
Click + Add (if not already added)
Go to Configuration tab
Select “Personal Access Token” as the authentication method
Paste your token
Click Start Server
Or via CLI:
docker mcp secret set GITHUB.PERSONAL_ACCESS_TOKEN=github_pat_YOUR_TOKEN_HERE
Configure Filesystem MCP (Screenshot Storage)
The Filesystem MCP allows Gemini to save screenshots and test artifacts to your local machine.
In Docker Desktop:
Go to MCP Toolkit → Catalog
Search for “Filesystem”
Find Filesystem (Reference) and click + Add
Go to the Configuration tab
Under filesystem.paths, add your project directory:
Example: /Users/yourname/catalog-service-node
Or wherever you cloned the repository
You can add multiple paths by clicking the + button
Click Save
Click Start Server
Important Security Note: Only grant access to directories you’re comfortable with Gemini reading and writing to. The Filesystem MCP is scoped to these specific paths for your protection.
Run the Automation
Change directory to the root of the catalog-service-node project repository and open Gemini CLI:
gemini
Paste this prompt:
Navigate to http://host.docker.internal:5173 and perform a detailed
performance and accessibility analysis:
1. Take a screenshot of the full page
2. Count how many products are displayed
3. Open browser DevTools and check:
– Console for any JavaScript errors
– Network tab: how many HTTP requests are made?
– Performance: how long does the page take to load?
4. Identify performance issues:
– Are all products loading at once with no pagination?
– Are images optimized?
– Any unnecessary network requests?
5. Check for accessibility issues:
– Missing alt text on images
– Color contrast problems
– Vague button labels
Create a GitHub issue titled "Product catalog performance and
accessibility issues" with:
– Screenshots attached
– List of specific problems found
– Severity: Medium
– Labels: performance, accessibility, enhancement
Watch Gemini Work
Here’s what happens behind the scenes as Gemini orchestrates multiple MCP servers:
Step 1: Browser Navigation
The web server is running. I'll navigate to http://host.docker.internal:5173, take a screenshot, and then proceed with the rest of the performance analysis.
Gemini launches a real Chromium browser in the Docker container and navigates to your application.
Step 2: Console Analysis
✦ I can see 15 products listed on the page: * Vintage Camera * Rare Vinyl Record – LAST ONE! * Professional DSLR Camera * Test Product 4-15
Step 3: Performance Check
✦ Checking browser console and network requests… Opening DevTools to analyze performance metrics…
Step 4: Issue Creation
✦ Creating GitHub issue with findings…
create_issue (MCP_DOCKER MCP Server) {"labels":["performance","accessibility","enhancement"],"body":"### Summary…"}
✦ I have successfully created the issue. You can find it at: https://github.com/ajeetraina/catalog-service-node/issues/1
The Complete GitHub Issue
Gemini automatically created this comprehensive issue with structured information:
Workflow Comparison: Before vs After MCP
Step
Before MCP (Manual Testing)
Time
After MCP (Gemini CLI + MCP)
Time
1
Open browser manually
1 min
Paste prompt in Gemini CLI
5 sec
2
Navigate to application
30 sec
Gemini analyzes automatically
25 sec
3
Click through pages
3 min
GitHub issue created
auto
4
Open DevTools manually
30 sec
Screenshots attached
auto
5
Take screenshots
2 min
✓ Complete
–
6
Check browser console
1 min
–
–
7
Analyze network requests
2 min
–
–
8
Document findings
3 min
–
–
9
Write detailed bug report
5 min
–
–
10
Create GitHub issue
2 min
–
–
Summary
Total
~ 20 minutes per test
–
30 sec per test
Time saved per test: 19.5 minutes (97% faster!)
Impact over time:
Per day (5 tests): 97 minutes saved → 1.6 hours
Per week (25 tests): 8 hours saved → 1 full workday
Per sprint (50 tests): 16 hours saved → 2 full workdays
Per year (1,000 tests): 325 hours saved → 40 workdays
Wrapping Up
You’ve just witnessed how Docker MCP Toolkit transforms Gemini CLI from a chat assistant into a complete browser testing and performance analysis platform. What used to require opening browsers, clicking through flows, analyzing DevTools, documenting bugs, and creating issues manually now happens in one 30-second conversation.
The combination of Gemini CLI and Docker MCP Toolkit represents a paradigm shift in AI-assisted development. By leveraging terminal-native tools and containerized services, you get:
Unmatched flexibility in tool selection
Superior performance with minimal overhead
Future-proof architecture that scales with your needs
This setup isn’t just about convenience — it’s about building a development environment that adapts to your workflow rather than forcing you to adapt to it. The developer productivity revolution is here. The question isn’t whether you’ll adopt AI-assisted development — it’s whether you’ll lead with the best tools available or play catch-up later.
Ready to try it? Enable Docker MCP Toolkit in Docker Desktop and start building your own Gemini-powered development workflow today.
Learn more
Explore the MCP Catalog: Discover containerized, security-hardened MCP servers
Open Docker Desktop and get started with the MCP Toolkit (Requires version 4.48 or newer to launch the MCP Toolkit automatically)
Explore our guide on adding MCP Servers to Claude Code with the Docker MCP Toolkit
Check out our MCP Horror Stories series to see common MCP security pitfalls and how you can avoid them.
Quelle: https://blog.docker.com/feed/