A Crash Course in Remote Management

Remote work is a prominent topic lately, as people around the world are doing their best to live their lives and keep themselves and their families safe and prepared during the COVID-19 outbreak. The impact of this outbreak is felt across societies and cultures as well as in the workplace.  

Automattic, the company behind WordPress.com, is a primarily distributed company with more than 1,000 employees across 76 countries. I’m an engineering lead, currently working on the Developer Experience team. As Automattic has grown, we’ve learned a lot about working remotely and across time zones, and have shared insights on what we see as the future of work on the Distributed podcast, hosted by our CEO, Matt Mullenweg. 

This week, Nicole Sanchez, the founder of Vaya Consulting and an expert on workplace culture, and I had an opportunity to co-present a Crash Course in Remote Management, a free one-hour webinar hosted on Zoom. Nicole has previously held social impact and leadership roles at GitHub and the Kapor Center for Social Impact.

Nicole and I walked an engaged audience through proven practices and what they’ve learned about leading, communicating with, and measuring the success of remote teams. Participants offered insightful questions, leading to lively discussions around:

Collaboration and relationship-building.The cost, benefit, and ideal frequency of bringing teams together for face-to-face interaction (in general, if not as commonly right now).Communicating and prioritizing messages across a variety of channels. Encouraging people to go outside, exercise, spend time with family, or otherwise step away from the computer (also known as being “AFK,” or “Away From Keyboard”) without the fear of being judged or anxiety over being less productive.

Some companies are encouraging employees to experiment with working from home, which can feel very different from in-person and office work. If you’re interested in learning more, please check out the full video recording of the course:

Matt’s latest blog post, “Coronavirus and the Remote Work Experiment No One Asked For,” is also worth a read. For more information and advice on COVID-19, please visit resources from the CDC, World Health Organization, and other health authorities.
Quelle: RedHat Stack


Use the Dashboard API to build your own monitoring dashboard

Using dashboards in Cloud Monitoring makes it easy for you to track important system metrics. Creating dashboards by hand in the Monitoring UI can be a time-consuming process, especially if you want to use them in multiple different Monitoring Workspaces. With the recent GA announcement for the Cloud Monitoring dashboards API, you now have a way to programmatically create dashboards. You can create a dashboard in the Monitoring UI, use the dashboards API to download the JSON configuration, then use the dashboards API to create a dashboard in a separate Workspace using the JSON configuration.The Monitoring dashboards APIThe Cloud Monitoring API provides a resource called projects.dashboards which offers a familiar set of methods: create, delete, get, list, and patch. The REST API accepts JSON payloads, which you can use to create dashboards, update existing dashboards or delete dashboards. Using the API requires a basic understanding of Cloud Monitoring dashboards. For details about creating dashboards in the Monitoring console, you can read the Creating charts section in the docs to find all the details.The dashboard JSON payloadIn order to create a dashboard via the dashboards API, you need to define several objects in the JSON payload data. This part is easy if you call the API to export the JSON configuration from an existing dashboard.Here’s an example JSON payload:There are several structures in the dashboard data model to understand:displayName—the human-readable name of the dashboardgridLayout, rowLayout, columnLayout—the container for the widgetswidgets—the container for the chart itemsxyCharts—a chart model that displays data on a 2D (X and Y axes) planedataSets—data for the chart object, which includes the details used to gather the specific data in a timeSeriesFilter object, including the metric name, metric filters and how the metric is aggregated.xAxis, yAxis—definitions affecting the presentation of the axeschartOptions—definitions affecting the mode of the chartBuilding the dashboard JSON payload the easy wayA simple approach to building a dashboard configuration is to first create a dashboard in the Cloud Monitoring console, then use the dashboards API to export the JSON configuration. Once exported, you can share that configuration as a template, either via source control or however you normally share files with your colleagues.The Dashboards API provides both a create and a get method. Building a dashboard in JSON from scratch requires detailed knowledge of the API data model and corresponding JSON syntax. A far simpler approach is to build the dashboard JSON configuration in the Dashboards section of Cloud Monitoring UI, then use the API to export the JSON representation of the dashboard. Once you have the JSON, you can use the create method to create another dashboard based on the JSON.Creating an example dashboardThere are many ways to call the Cloud Monitoring API. One easy way to test out API calls is to use the “Try this API” functionality directly in the projects.dashboards.create method. Note that you’ll need to have a Cloud Monitoring Workspace defined and the GCP project ID for the project that contains the Workspace.We created a sample JSON dashboard that includes six different charts, monitoring a data pipeline with Pub/Sub, Dataflow, and BigQuery components. You can use this JSON payload as a template for your own dashboard.1. Create the dashboard, click the blue “TRY IT!” button to open the “Try this API” feature on the right-hand side of the projects.dashboards.create method.2. Enter a value for the parent input form in the pattern “projects/YOUR_PROJECT_ID,” replacing your own GCP project ID that contains the Cloud Workspace where you want to create the dashboard for the “YOUR_PROJECT_ID” string value.3. Highlight the default values in the “Request Body” input form, then copy/paste the JSON configuration for the dashboard.4. Click the “EXECUTE” button at the bottom of the page. If all goes well, you should see a green HTTP “200” response code, along with the JSON description of the dashboard you just created.5. Open the Dashboards section in the Cloud Monitoring console to review your newly created dashboard. Find the “Data Processing Dashboard Template” and click the name to open the dashboard.If you have already deployed Pub/Sub, Dataflow, and BigQuery resources, you should see values in the dashboard.Exporting an existing dashboardA common use case for this API is to export existing dashboard configurations, which can then be used to create a dashboard in another Workspace. You can export the configuration by calling the projects.dashboards.get method with the name of the dashboard. 1. Open the projects.dashboards.get API documentation and click the blue “TRY IT!” button, which opens the “Try this API” feature on the right-hand side of the page.  2. Enter a value for the parent input form in the pattern “projects/YOUR_PROJECT_ID/dashboards/YOUR_DASHBOARD_ID” replacing the host project id of the Workspace where you want to create the dashboard for the “YOUR_PROJECT_ID” string value and your dashboard ID for the “YOUR_DASHBOARD_ID” string value. Note that you can find your dashboard ID from the URL when viewing your dashboard in the Monitoring UI. Here’s an example. https://console.cloud.google.com/monitoring/dashboards/custom/e6ee2110-efc0-431e-bc1a-ce2600a207bc?project=YOUR_PROJECT_IDIf you don’t have your dashboard ID, you can instead call the projects.dashboards.list method, which will return a list of all your dashboards. The dashboard configuration can then be extracted from the list by finding the corresponding “Data Processing Dashboard” value in the displayName in the JSON configuration.  3. Click the “EXECUTE” button at the bottom of the page. If all goes well, you should see a green HTTP “200” response code along with the JSON description of the dashboard that you just created. The JSON snippet below shows the name of the dashboard, which you’ll need for the next API call.4. Save this JSON configuration as a file. To use it to create a new dashboard, you have to make three changes to the JSON configuration:a. Remove the “name” key/value pairb. Remove the “etag” key/value pairc. Update the “displayName” key/value to reflect the name for your new dashboard5. Open the projects.dashboards.create API documentation and click the blue “TRY IT!” button which opens the “Try this API” feature on the right-hand side of the page.  6. Enter a value for the parent input form in the pattern “projects/YOUR_PROJECT_ID,” replacing your own GCP project ID that contains the Cloud Workspace where you want to create the dashboard for the “YOUR_PROJECT_ID” string value. 7. Click the “EXECUTE” button at the bottom of the page. If all goes well, you should see a green HTTP “200” response code along with the JSON description of the dashboard that you just created. The JSON snippet below shows the name of the dashboard which you’ll need for the next API call.Making the API even more usefulTry other sample dashboard configurations and read more about the API via the Managing Dashboards documentation. We’re working on features to make the API even more useful, including through the gcloud command line. Also, contributors are discussing and planning the Terraform module for the Monitoring Dashboard API in github. As always, we’d love to hear your feedback through the Cloud Console feedback form.
Quelle: Google Cloud Platform

Create deployment pipelines for your GKE workloads in a few clicks

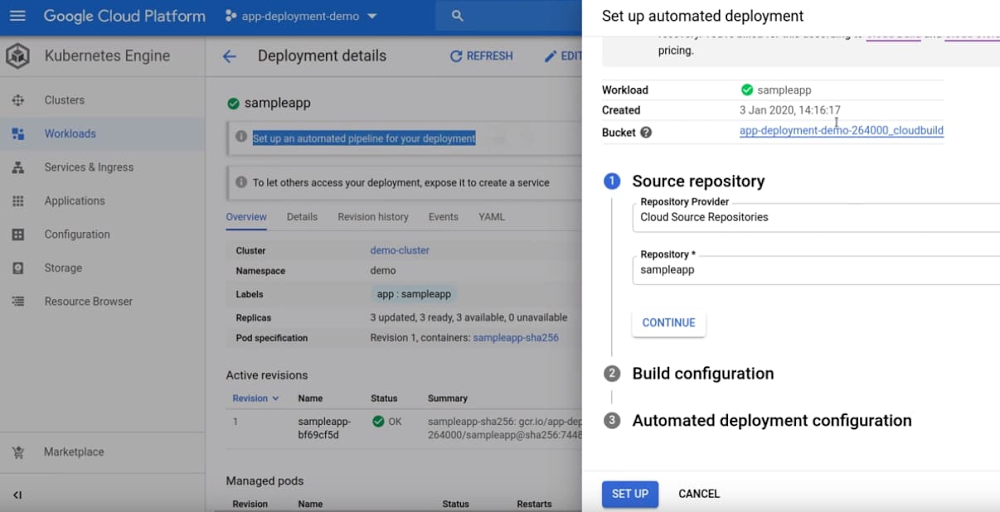
With Kubernetes becoming the de facto standard for container orchestration, many development teams are looking to build, test, and deploy code quickly in a frictionless manner to Kubernetes. Traditional continuous integration and continuous delivery (CI/CD) tools not designed for cloud-native environments often fall short as developers spend many hours looking for best practices to automate deployments, scaling pipelines, and worrying about other implementation details. For teams just getting started with Kubernetes, a bunch of time-consuming error-prone chores further complicate these efforts. These steps include creating configuration files for the application, setting up a CI/CD server, ensuring configuration files are updated, or deploying images with correct credentials to a Kubernetes cluster. Not surprisingly, it’s easy to get frustrated. You’d rather spend time writing code, than worrying about these steps or what the right pipeline looks like for a specific environment. And even when CI/CD pipelines are set up, they are way too complex, and scripts keep being added over time. To help you overcome these problems with continuous delivery, we’re pleased to announce an automated deployment feature that lets you create continuous delivery pipelines for Google Kubernetes Engine (GKE) in a few clicks. Without worrying about implementation details, you can now deploy changes to GKE faster and hassle-free. These pipelines implement out-of-the-box best practices that we’ve  learned at Google for handling Kubernetes deployments, thereby further reducing the overhead of setting up and managing pipelines. Automated deployment for GKE is powered by Cloud Build, an industry-leading cloud-native CI/CD platform that allows pipelines to scale up and down without having to pre-provision servers or pay in advance for additional capacity. Cloud Build also provides pipelines with baked-in security and compliance enhancements to meet specific workflow and policy needs. And unlike with continuous delivery features that you’ll find in traditional CI/CD tools, with automated deployment for GKE, you no longer have to manage, update, or improve the pipeline. All changes and updates are handled automatically in the background. The pipelines run automatically whenever changes are made to the source code, allowing you to deploy new features and fixes quickly and reliably. And with preview deployments, whenever you open or update a pull request, a version of the application with the suggested code change is deployed, so you can quickly validate if the change behaves as expected. Unused preview deployments are automatically cleaned up, freeing up resources.Create your first first pipeline in a few clicksTo get started with automated deployment, simply choose the source repository, build configuration, and YAML file specifying Kubernetes configuration. You can either use your own existing YAML or leverage Google recommended YAML.  1. Select the source2. Select the build configuration3. Choose the Kubernetes YAML—bring your own YAML or use the one Google Cloud provides4. Link workload revisions to Cloud Build for traceability and debuggingHow automated deployment can helpHere are some other benefits that you get from automated deployments:Recommended Kubernetes configuration: Automated deployment suggests the Kubernetes YAML to be used to deploy your application. You no longer have to fine-tune the configuration by hand.Hassle-free continuous delivery setup: Configure all the steps required for an automated deployment pipeline—a connection to your source code repository, the conditions under which to trigger the pipeline, and the steps to build and deploy your containerized application—with a couple of clicks in a single flow.Reduced CI/CD maintenance: Because continuous delivery pipelines run in Cloud Build, you don’t have to spend time installing and maintaining your own CI/CD system.End-to-end traceability: Workloads deployed using automated deployment can be linked to the pipeline and source code commit that created them. Using Binary Authorization, you can create secure software supply-chain policies that only allow workloads deployed using continuous delivery pipelines.“Shift left” with preview deployments: Quickly test whether your application is working as intended before merging code changes, to ensure issues are identified as early as possible in the development process.You can start using automated deployment feature today in the Google Cloud Console. To learn more about how to set up your first automated deployment pipeline and deploy it  to GKE, check out the documentation, or watch the video below:
Quelle: Google Cloud Platform

Architecting multi-region database disaster recovery for MySQL

Enterprises expect extreme reliability of the database infrastructure that’s accessed by their applications. Despite your best intentions and careful engineering, database errors happen, whether that’s machine crashes or network partitioning. Good planning can help you stay ahead of problems and recover more quickly when issues do occur.This blog shows one approach of deploying a database architecture that implements high availability and disaster recovery for MySQL on Compute Engine, using regional disks as well as load balancers.Any database architecture must provide approaches to tolerate errors and recover from those errors quickly without losing data. These approaches are expressed in RTO (recovery time objective) and RPO (recovery point objective), which offer ways to set and then measure how long a service can be unavailable, and how far back data should be saved.After a database error, a database must recover as fast as possible with an RTO as small as possible, ideally in seconds. There must be as little data loss as possible—ideally, none at all. The desired RPO is the last consistent database state.From a database architecture and deployment viewpoint, this can be accomplished with two distinct concepts: high availability and disaster recovery. Use both at the same time in order to achieve an architecture that’s prepared for the widest range of errors or incidents.Creating a resilient database architectureA high-availability database architecture has database instances in two or more zones. If a server on a zone fails, or the zone becomes inaccessible, the instances in other zones are available to continue the processing. The figure below shows two instances, one in zone zn1, and one in zone zn2. The load balancer in front supports directing traffic to a healthy database instance available for read and write queries.A disaster recovery architecture adds a second high-availability database setup in a second region. If one of the regions becomes inaccessible or fails, the other region takes over. The figure below shows two regions, primary and DR. Data is replicated from the primary to the DR region so that the DR region can take over from the latest consistent database state. The load balancer in front of the regions directs traffic to the region in charge of the read and write traffic. Here’s how this architecture looks:In addition to the database instance setup, a regional disk is deployed so that data is written simultaneously in two zones, proving fail-safe in the event of zone failure. This is a huge advantage of Google Cloud, allowing you to skip MySQL-level replication within a region. Each write operation to disk is done in two zones synchronously. When the primary instance fails, a standby instance is mounted with regional persistent disk(s), and the database service (MySQL) is then started using the same. This brings the peace of mind of not worrying about replication lag or database state for high availability.From a disaster recovery process view, the following happens over time during a failure situation:Normal steady state database operationA failure happens and a region becomes unavailable or the database instance inaccessibleA decision must be made to fail over or not (in case there is the expectation that the region becomes available soon enough or the instance becomes responsive again)DNS is updated manually, therefore it redirects application traffic to a second regionFallback to the primary region after it becomes available again is optional, as the second region is a fully built-out deploymentFrom a high-availability process view, the following happens over time during a failure situation:Normal steady state database operationDatabase instance fails or becomes unavailableLaunch the standby instanceMount regional SSD and start databaseAutomatic redirection of application traffic to the standby via load balancerAfter the failed or unavailable instance becomes available again, a fallback can take place or notThe database architecture shown demonstrates a highly available architecture supporting disaster recovery. With regional disks and load balancers, it is straightforward to provide a resilient database deployment.Find out more about load balancers and regional disks. Check out general HA and DR processes and detailed steps in the initial part of the reference guide. Try it out to become familiar with the architecture as well as the two major failover processes.
Quelle: Google Cloud Platform

Security: Das Intel-ME-Chaos kommt

Bis zum Chaos sei es nur eine Frage der Zeit, schreiben die ME-Hacker. Intel versucht, das zu verschweigen, und kann das Security-Theater eigentlich auch gleich sein lassen. Ein IMHO von Sebastian Grüner (Intel, Sicherheitslücke)
Quelle: Golem