Discover, understand and manage your data with Data Catalog, now GA

Google Cloud Data Catalog is a fully managed and scalable metadata management service. It can help your organization quickly discover, understand, and manage all your data from one simple interface. Accessible from within the Google Cloud console, Data Catalog allows immediate access to data discovery without requiring any upfront setup.The Data Catalog service is now generally available, providing regionalized service in 23 different regions globally. In addition to providing higher resilience against potential outages, the regionalized service delivers metadata residency at rest in each of the supported regions while providing a unified view of all data assets distributed across multiple regions.Most organizations today are dealing with a large and growing number of data assets, and want to open up access to that data so business users can find the right data assets through self-service. Past approaches have failed to scale up, required tedious set up, and did not deliver easy data discovery for all.At Google, we also faced this challenge for large and growing data assets, and built an internal data catalog service to help bring comprehensive metadata management to all data users. You can see more about the techniques used to build an effective data catalog in Goods: Organizing Google’s Datasets. Data Catalog builds on that foundation, bringing a scalable managed service to all Google Cloud users for data within BigQuery, Pub/Sub, and Cloud Storage. Here are some details on how Data Catalog works, and how it can help.Auto-syncing technical metadataTechnical metadata for all Google BigQuery data assets like datasets, tables, and views is synced into Data Catalog on a continuous basis. This means you can start using Data Catalog instantly and don’t need to deal with any tedious setup. Data Catalog also auto-syncs technical metadata from Pub/Sub and user-created filesets from Cloud Storage. These filesets are simple to create—you just need to specify a pattern with wildcards and apply it to a bucket. A fileset groups together all files in the bucket that match the wildcard pattern.Technical metadata vs. business metadataTechnical metadata refers to metadata that is available in the source system. Technical metadata for a BigQuery table includes table name, table description, column names, column types, column descriptions, creation date, last modification date, and more. For Pub/Sub, technical metadata refers to Pub/Sub topic names and date created. For Cloud Storage filesets, technical metadata refers to the fileset name, the pattern used for creating the fileset, creation date, and modification date.Business metadata refers to the collection of metadata that is critical for business and operational purposes but is not available in technical metadata. Business metadata might include the person responsible for a particular data asset, whether the data asset contains personally identifiable information (PII), if the data is approved for official use, the data retention policy for the data asset, the life cycle stage of the data asset, the data quality score, any known data quality issues, or data asset freshness. Data Catalog supports structured tags for capturing complex business metadata (more on that below).Data discoveryData Catalog can be used from a Google Cloud project by simply enabling it in that project. Data Catalog discovers data assets that are located not only in the project where the API is enabled but across all projects and across all regions. Support for data assets outside of BigQuery, Pub/Sub and Cloud Storage are in the Data Catalog roadmap, while support for non-Google Cloud data sources are available through open-source connectors (see below). You can use Data Catalog to search for all your data assets by simply typing a keyword and discovering all matching data assets. You can also narrow down your search to locate data assets in specific projects, systems, types of data assets, or data assets created during specific time periods.Structured tags for business metadataAt Google, we believe that simple string tags, once used widely, are no longer sufficient to capture the richness of business metadata. With Data Catalog, you can create tags with structure such that each tag contains multiple attributes, and each attribute is of one of the types string, double, boolean, enumerated, and datetime. Creating structured tags is a two-step process. First, define the structure of your tag in a tag template, then create tags with metadata that adhere to the template. You can attach each tag to individual data assets like datasets, tables, views, and even columns.As illustrated below, the structured tags on data assets provide rich business metadata to all data users. You as a data analyst or a data scientist can search for specific tags and better understand your data assets with the business context provided by the collection of tags. You as a data curator or a data governor can better manage data assets by using the metadata on data quality and data governance.Access control for metadataData Catalog is integrated with Cloud Identity and Access Management (Cloud IAM). All operations, including search for data discovery, are serviced in accordance with the applicable access control specifications. If user A has read access to a data asset and user B does not have any access to that data asset, a search carried out by user A reveals the data asset, while the same search carried out by user B does not return the data asset.Metadata can be sensitive in nature and data governance teams might want certain business metadata tags to be visible only to select groups of users. Data Catalog provides access control on templates, and the access control extends to all tags created using that template.Auto-tagging PII data with Cloud DLPData Catalog’s integration with Cloud Data Loss Prevention (Cloud DLP) enables users to run Cloud DLP inspection jobs on BigQuery and automatically create Data Catalog tags for identifying PII data. You can find this in the Cloud DLP interface. You can also refer to the Google tutorial Create Data Catalog tags by inspecting BigQuery data with Cloud Data Loss Prevention and use the accompanying source code.Data Catalog support for non-Google Cloud data assetsThe Data Catalog API supports ingestion of technical metadata from non-Google Cloud data assets as well. The open-source connectors are organized in four Google Cloud Github repositories: datacatalog-connectors contains the common components for all connectors; datacatalog-connectors-rdbms has connectors for Oracle, SQL Server, Teradata, Redshift, PostgreSQL, MySQL, Vertica, and Greenplum; datacatalog-connectors-bi hosts connectors for Looker and Tableau; and data catalog-connectors-hive provides the connector for Hive with the option for live syncing.You can attach structured metadata tags on the Data Catalog entries for data assets that reside outside of Google Cloud. The single interface of Data Catalog lets you discover, annotate, and manage all your data assets. Next steps with Data Catalog Data Catalog is now GA and provides self-service data discovery at scale to enterprise users across all regions. Getting started with Data Catalog couldn’t be easier, as it does not require any setup to quickly discover, understand, and manage all your data in Google Cloud and supports ingesting on-premises metadata from non-Google Cloud data sources. Learn more about Data Catalog, check out our comprehensive documentation, or try the Quickstart guide.
Quelle: Google Cloud Platform
Anthos in depth: What new AWS multi-cloud support means for you

Last week we announced new features for Anthos that our customers tell us will drive business agility and efficiency. Today, we’d like to dive a bit deeper into one of Anthos’ most exciting new features: support for multi-cloud. Now, you can use Anthos to consolidate all your operations across on-premises, Google Cloud, and other clouds (starting with AWS).Getting multi-cloud rightMany of you deploy workloads to multiple clouds to take advantage of best-of-breed capabilities and improve the resiliency of your services. But managing applications across different clouds is easier said than done. I’ve heard from many of you that the specialized skill sets required for multi-cloud deployments lead to siloed, disconnected, teams—even if those teams are working on the same application. Despite these challenges, concerns about lock-in to one cloud provider and availability in the case of an outage make succeeding with multi-cloud a priority for many of you.Taking advantage of an open application modernization platform like Anthos can help ease some of those challenges and enable you to modernize your existing applications, build new ones, and run them anywhere. According to a new app modernization survey from Enterprise Strategy Group, “92% of organizations feel it is important to utilize a multi-cloud enabled container management and orchestration solution.“1 Let’s take a deeper look at how Anthos can help you build a successful multi-cloud strategy. Enabling consistency across multiple cloudsDisjointed management tools slow down teams, waste valuable time and money, and ultimately lead to reduced employee productivity. Anthos layers on top of Kubernetes and brings consistency to orchestration and policy enforcement across multiple clouds and on-premises. With the same open software experience across all environments, your platform teams can move faster while your security teams maintain consistent controls, all while reducing both complexity and your exposed attack surface. Anthos lets you take a holistic view of your services running across a multi-cloud architecture. Anthos Service Mesh manages, and secures, traffic running in your data center, on Google Cloud and on other clouds such as AWS. Anthos Config Management allows you to distribute and enforce hierarchical policies (such as authorization, resource quotas, and limits for namespaces) at scale across multiple apps running in multiple clouds. In short, Anthos frees you from cloud provider constraints and gives you the tools to run your applications anywhere.When you’re developing your application, Anthos helps by providing a “build once, deploy anywhere” platform so you can take your applications to multiple public clouds, starting with AWS. Regardless of the environment for which your app was developed, Anthos gives you the same development experience. You spend less time focused on the tool chain, configuration, and management of your app, and more time writing great code. Empowering you with flexibility and choiceSince we launched Anthos, we’ve been committed to giving you more choice in cloud providers. Far too often we hear from customers who started building applications in one cloud and are stuck with proprietary technology that prevents them from moving fast and using the services they need, in the locations that they want. The open technology underpinning Anthos unlocks the flexibility you need to make the best decision for your organization and avoids lock-in to any cloud—even our own. But we also know that trusting a new cloud vendor with your critical workloads is not a decision you take lightly. That’s why we made getting started with Anthos for AWS as seamless as possible. If your team has built processes and tooling around your AWS practice, those teams can install Anthos directly into your existing AWS VPC and reuse your existing AWS security groups and IAM resources. To make your services accessible to other services within your organization, or publicly accessible to your users, you can also expose them using AWS load balancers.Anthos multi-cloud features available todaySupport for Anthos for AWS is generally available. This release includes several of the top features that you have been asking for, bringing a variety of benefits:High reliability: Your clusters can be deployed in a high availability (HA) configuration, where both control plane instances, as well as node pools, can be placed across multiple availability zones. AWS Auto Scaling groups are also used for resiliency.Auto-scaling: Automatically resize your number of nodes based on traffic volumes so you are only paying for the resources you need.Integration with an existing AWS environment: Anthos can be deployed into your existing AWS VPCs, and you can leverage existing security groups to secure those clusters. If your existing AWS setup has been approved by your security team, you can deploy Anthos into it, as long as the firewalls allow connections back to Google. You can also expose services via AWS load balancers so deploying Anthos is easy and configuration of the environment is minimal.Operational consistency: Now, you can manage workloads running on Google Cloud as well as AWS from one place. The Google Cloud Console provides single-pane-of-glass management for all your clusters. Additionally, system logs for all these environments can be stored in Cloud Logging (formerly Stackdriver).Integration with the full Anthos stack: You can set policy on your AWS workloads with Anthos Config Management, and use Anthos Service Mesh to securely connect and manage your resources running in AWS so your policies and monitoring have a view of your entire application and not just a silo of one part.To support more of your multi-cloud plans, we’re also offering support for Anthos for Azure later this year.Ensuring success in the new multi-cloud futureMulti-cloud can ensure your teams can develop and build across environments, pivot quickly, and keep your applications running if disaster strikes. Anthos makes multi-cloud easy by providing a single pane of glass for management and ensures that it is done right with a consistent, integrated, experience for your developers, operators, and administrators. This message rings true for our partners, who report that Anthos’ approach to multi-cloud is resonating with their customers.“We’re seeing very positive feedback from the early adopters of Anthos on AWS,” said Kyle Bassett, Partner at Arctiq. “Anthos sets itself apart with the ability to provide a full-stack cloud-agnostic Kubernetes experience from low-level resource management all the way up to policy enforcement—all while providing an enhanced developer experience. For customers committed to containers but tired of managing everything themselves, Anthos does the heavy lifting for you.” If you’re looking to get started with Anthos for AWS, we have partners including Arctiq, IGNW, SADA, SoftServe, and World Wide Technology that are eager to help. And if you are interested in seeing how Anthos can help your organization get multi-cloud right, please reach out to our sales team to schedule an architecture design session.1. ESG Custom Research Survey, Measuring App Modernization and its Impact, Commissioned by Google, March 2020.
Quelle: Google Cloud Platform

What’s happening in BigQuery: Efficient new views and Cloud AI integrations

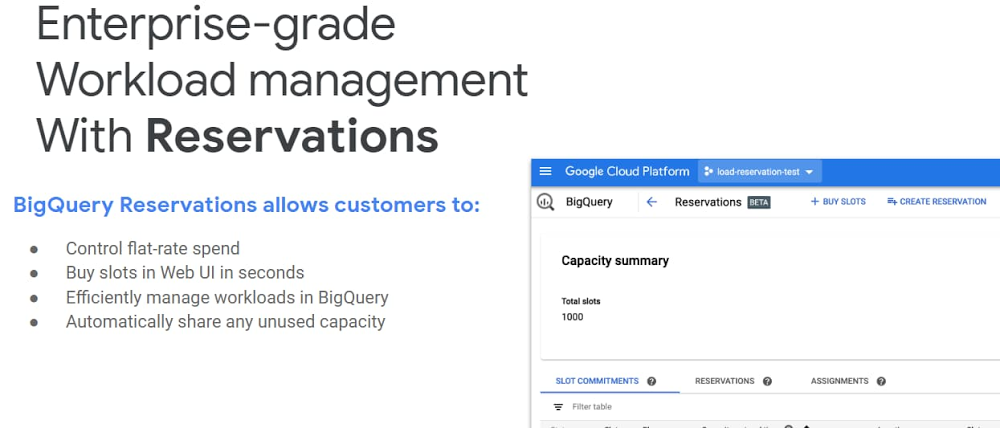
BigQuery, Google Cloud’s petabyte-scale data warehouse, lets you ingest and analyze data quickly and with high availability, so you can find new insights, trends, and predictions to efficiently run your business. Our engineering team is continually making improvements to BigQuery so you can get even more out of it. Recently added BigQuery features include new materialized views, column-level security, and BigQuery ML additions.Read on to learn more about these new capabilities and how they can help you speed up queries, add access controls, and focus on innovation.Accelerate performance and improve cost savings with BigQuery materialized viewsWe’re happy to announce that BigQuery materialized views are now available in beta. BigQuery materialized views are precomputed views that periodically cache the results of a query in a BigQuery table for increased performance and efficiency. A materialized view is a database object that contains the results of a query. For example, it may be a subset of the rows and/or columns of a table or join result, or may be a summary using an aggregate function. So when a query is re-run and a materialized view exists, the query doesn’t need to rescan all the tables again, but can quickly report the answer from the materialized view. This significantly improves performance and cuts down cost because the amount of data scanned is much smaller.BigQuery materialized views are easy to set up and work with in real time. Here’s an overview of the benefits: Zero maintenance: The system automatically synchronizes data refreshes with data changes in base tables. All incremental data changes from the base tables are automatically added to the materialized views—no user inputs required.  Always fresh: Materialized views are always consistent with the base table (including BigQuery streaming tables). Materialized views unite their data with the delta changes in the base table and return any new data in real time.Self-tuning: If a query or part of a query against the source table can instead be resolved by querying the materialized views, BigQuery will rewrite (reroute) the query to use the materialized view for better performance and efficiency.Customers such as Viant have seen tremendous benefits. “We have been using BigQuery Materialized Views in production for more than a year now,” says Adrian Witas, SVP and chief architect at Viant. “Not only does it come with great cost reduction, but it also hugely improves performance. Query latency is critical in our case where reporting data is directly consumed by the UI, which processes about 8,000 SQL queries per day with each query needing to complete in under a second. This has allowed us to successfully migrate our Vertica Reporting cluster to BigQuery.”Learn more about BigQuery materialized views in the documentation.Use BigQuery ML models for online prediction and build recommendation models You can export models from BigQuery ML in TensorFlow SavedModel format, and use those for online prediction in Cloud AI Platform, or your own serving layer. This also enables data scientists to tune the model in Python after it has been created in BigQuery ML, when further tuning is desired. Importing TensorFlow models for batch prediction in BigQuery is already generally available. This ability enables data scientists, data analysts, ML engineers, and data engineers to easily build end-to-end data to model deployment workflows. See the BigQuery ML documentation for more details.In addition, BigQuery ML has added support for training matrix factorization, a new type of model, which is now in beta. Matrix factorization allows users to train recommendation systems on large datasets in BigQuery through SQL. To learn more, see the tutorials forimplicit recommendations (user behavior-based; i.e.,used for product recommendations) andexplicit recommendations (rating-based; i.e., app and movie recommendations). Set access controls on data classes with column-level securitySensitive data is often scattered alongside less sensitive data within the same dataset, and managing the appropriate access to that sensitive data becomes challenging if you only look at table, dataset, or project-level permissions. BigQuery column-level security, now in beta, lets you set access controls on data classes, abstracted by policy tags at column-level granularity. With this new capability, you can tag sensitive columns containing a protected data class (i.e., PII, financial, health) and restrict these columns to privileged groups. Furthermore, you can create policy tag hierarchies, wherein tags in the root nodes aggregate permissions for tags at the leaf nodes. For example, if a “patient health” tag is nested below a general “restricted” tag, anyone who can access restricted data can access patient health data. Read more about BigQuery column-level security or dive into the documentation. Price predictability with BigQuery ReservationsPrice predictability continues to be top of mind for many organizations looking to understand and manage their data warehousing spend. We announced the beta release of BigQuery Reservations to help customers take advantage of BigQuery flat-rate pricing in an easy and flexible way. Advanced enterprise users can use Reservations to facilitate complex workload management scenarios. Reservations is now generally available in all BigQuery regions.Read more about BigQuery flat-rate pricing or dive into the documentation to get started.Command and control with BigQuery scripting and stored proceduresScripting allows data engineers and data analysts to execute a wide range of tasks, from simple ones like running queries in a sequence to complex, multi-step tasks with control flow including IF statements and WHILE loops. Stored procedures allow you to save these scripts within BigQuery and share them so that any user can run them in the future. We’re announcing general availability of scripting and stored procedures in all BigQuery regions. Since the beta release, we have added the following new capabilities:Exception handling: Support for EXCEPTION clauses to handle errors generated during the script executionSystem variable support: Support for key variables such as time zone, current project, and job ID, to display information specific to the user during execution.Validation of the PROCEDURE body during creation: Validation of the commands in the body of the PROCEDURE during creation to detect problems before executionJDBC and ODBC support: Support for standard APIs to enable execution by third-party execution engines that rely on the JDBC and ODBC drivers.Read more about scripting and stored procedures in the BigQuery documentation. In case you missed it:Launched COVID-19 public dataset program, making a hosted repository of public datasets like Johns Hopkins Center for Systems Science and Engineering (JHU CSSE), the Global Health Data from the World Bank, and OpenStreetMap data free to access and query.Federated ORC and Parquet federated queries in Cloud Storage are now generally available.Geospatial data ingest: Launched integration of FME and BigQuery so that users can transform hundreds of different geospatial file types and projections directly into BigQuery tables.To keep up on what’s new with BigQuery, subscribe to our release notes. You can try BigQuery with no charge in our sandbox. And let us know how we can help.
Quelle: Google Cloud Platform

Managing cost and reliability in fully managed applications

In both good times and challenging ones, running an application on a fully managed serverless environment has lots of benefits. If you experience extremely high demand, your application scales automatically, avoiding crashes or downtime. And if you see a contraction of demand, then the application scales down and saves you money. But big changes in customer demand can lead to unexpected system behavior—and bills. In times of uncertainty, you may want to temporarily reduce your overall spend, or simply gain a measure of predictability—all while maintaining an acceptable service level.At Google Cloud, we have severalserverless compute products in our portfolio—App Engine, Cloud Run, and Cloud Functions—all used for different use cases, and each one featuring different ways to help you control costs and plan for traffic spikes. In this blog post, we present a set of simple tasks and checks you can perform to both minimize downtime and mitigate unexpected costs for your serverless applications.Controlling costsWhether you want to reduce your overall serverless bill, or simply want to put safeguards in place to prevent cost overruns, here are some approaches you can use.Set maximum instancesGoogle Cloud serverless infrastructure tries to optimize both the number of instances in your application (fewer instances will cost less) as well as the request latency (more instances can lower latency). All of our serverless offerings allow you to set a maximum number of instances for a given application, service or function. This is a powerful feature, but one that you should use wisely. Setting a ’max-instances’ value low may result in a lower overall bill, but may also increase request latency or request timeouts, since requests which cannot be served by an instance will be queued, and may eventually time out.Conversely, setting a high value or disabling max-instances will result in optimal request latency, but a higher overall cost—especially if there is a spike in traffic.Choosing the right number of maximum instances depends on your traffic and your desired request latency. How you configure this setting varies by product:App EngineApp Engine provides a Cloud Monitoring metric (appengine.googleapis.com/system/instance_count) that you can use to estimate the number of instances your application needs under normal circumstances. You can then change the max instances value for App Engine via the app.yaml file:Learn more about managing instances in App Engine.Cloud RunYou can use the “billable container instance time” metric to estimate how many instances are used to run your application; as an example, if you see “100s/s”, it means around 100 instances were scheduled. You may want to set a buffer of up to 30% to preserve your application’s current performance characteristics (e.g. 130 max instances for 100s/s of traffic).You can change the max instances value for Cloud Run via the command line:Another element of managing Cloud Run costs is how it handles the automatic scaling of instances to handle incoming requests. By default Cloud Run container instances can receive several requests at the same time; you can control the maximum number of those requests that an instance can respond to with the concurrency setting. Cloud Run will automatically determine how many requests to send to a given instance based on the instance’s CPU and memory utilization. You can set a maximum to this value by adjusting the concurrency of your Cloud Run service. If you are using a lower value than the default (80), we recommend you try to increase the concurrency setting prior to changing max instances, as simply increasing concurrency can reduce the number of instances required.Learn more about Cloud Run’s instance automatic scaling.Cloud FunctionsCloud Functions provides a Cloud Monitoring metric (cloudfunctions.googleapis.com/function/active_instances) that you can use to estimate the number of instances your function needs under normal circumstances.You can change the max instances value for Cloud Functions via the command line:Learn more about managing instances in Cloud Functions.Set budget alertsWith or without changes to your application to reduce its footprint, budget alerts can provide an important early-warning signal of unexpected increases in your bill. Setting a budget alert is a straightforward process, and you can configure them to alert you via email or via Cloud Pub/Sub. That, in turn, can trigger a Cloud Function, so you can handle the alert programmatically.Use labelsLabels allow you to assign a simple text value to a particular resource that you can then use to filter charges on your bill. For example, you may have an application that consists of several Cloud Run services and a Cloud Function. By applying a consistent label to these resources, you can see the overall impact of this multi-service application on your bill. This will help identify areas of your Google Cloud usage that contribute the most to your bill and allow you to take targeted action on them. For more, see How to set labels in Cloud RunHow to set labels in Cloud FunctionsSet instance class sizingAll of our serverless compute products allow some amount of choice when it comes to how much memory or CPU is available to your application. Provisioning larger values for these resources typically results in a higher price. However, in some cases choosing more powerful instances can actually reduce your overall bill.For workloads that consume a lot of CPU, a large allocation of CPU (or more specifically, a greater number of CPU cycles per second) can result in shorter execution times and therefore result in fewer instances of your application being created. While there isn’t a one-size-fits-all recommendation for instance class sizing, in general applications that use a lot of CPU benefit from being granted a larger allocation of CPU.  Conversely, you may also be over-provisioned on CPU that your application is not fully utilizing, which may suggest that a smaller instance (at lower cost) would be able to serve the traffic to your application. Let’s take a look at how to size instances across the various Google Cloud serverless platforms.  App Engine standard environmentAt this time App Engine standard environment doesn’t provide a per-instance metric for CPU utilization. However, you can track an application’s overall CPU usage across all instances using the appengine.googleapis.com/system/cpu/usage metric. An application that is largely CPU-bound may benefit from larger instance classes, which would result in an overall reduction in CPU usage across an application due to requiring fewer instances and fewer instance creation events.App Engine flexible environmentApp Engine flexible environment provides a CPU Utilization metric (appengine.googleapis.com/flex/instance/cpu/utilization) that allows you to track the per-instance CPU utilization of your application.Cloud RunCloud Run provides a CPU Utilization distribution metric (run.googleapis.com/container/cpu/utilizations) that shows a percentile distribution of CPU utilization across all instances of a Cloud Run service. Cloud FunctionsAt this time, Cloud Functions does not provide a metric to report CPU utilization, and the best way to determine the optimal instance class is via experimentation. You can monitor the impact of an increase in allocated CPU by monitoring the execution time of your functions (cloudfunctions.googleapis.com/function/execution_times). CPU-bound functions typically report shorter execution times if they are granted larger CPU resources.Regardless of whether you may need larger, or smaller instances, we recommend using traffic management to help find the optimal configuration. First, create a new revision (or version in the case of App Engine) of your service or application with the changes to your configuration. That done, monitor the afore-mentioned metrics to see if there is an improvement.Learn more about traffic management in App EngineLearn more about traffic management in Cloud RunPreparing to scaleIf you’re experiencing higher than anticipated demand for your service, there are a few things you should check to ensure your application is well-prepared to handle significant increases in traffic.Check max instancesAs a corollary to the cost management advice above, if you’re more concerned about application performance and reliability than cost control, then you should double-check that any max instances setting you have in place is appropriate.Learn more about managing instances in App EngineLearn more about managing instances in Cloud RunLearn more about managing instances in Cloud FunctionsCheck quotasResource quotas are set up to make sure you don’t consume more resources than you forecast and avoid facing a higher than expected bill.  But if your application is getting more traffic than was forecast, you may need to increase your resource quotas to avoid going down when your customers need you the most. You can change some quotas directly via the Google Cloud Console, while you need to change others via support ticket. You can check your current usage against the quotas for your service via the Quotas page in the Cloud Console.Learn more about quotas in App EngineLearn more about quotas in Cloud RunLearn more about quotas in Cloud FunctionsPutting it all togetherIf what you want is an application that scales automatically with demand, building on a serverless platform is a great place to start. But there are lots of actions you can take to make sure it scales efficiently, without sacrificing performance or incurring in unintended costs. To learn more about how to use serverless compute products for your next application, explore our other serverless offerings.
Quelle: Google Cloud Platform

Cross Region Restore (CRR) for Azure Virtual Machines using Azure Backup

Today we're introducing the preview of Cross Region Restore (CRR) for Microsoft Azure Virtual Machines (VMs) support using Microsoft Azure Backup.

Azure Backup uses Recovery Services vault to hold customers' backup data which offers both local and geographic redundancy. To ensure high availability of backed up data, Azure Backup defaults storage settings to geo-redundancy. By virtue, backed up data in the primary region is geo-replicated to an Azure-paired secondary region. If Azure declares a disaster in the primary region, the data replicated in the secondary region is available to restore in the secondary region only. With the introduction of this new feature, the customer can initiate restores in a secondary region at will to mitigate real downtime disaster in the primary region for their environment. This makes the secondary region restores completely customer-controlled. Azure Backup utilizes the backed-up data replicated to the secondary region for such restores.

For the following scenarios, customers can leverage the secondary region data mentioned above using this feature:

Full outage: Previously, if there was an Azure primary region disaster for the customer, the customer had to wait for Azure to declare disaster to access their secondary region data. With the cross region restore feature, there is no wait time for the customer to recover data in the secondary region. The customer can initiate restores in the secondary region even before Azure declares an outage.
Partial outage: Downtime can occur in specific storage clusters where Azure Backup stores a customer’s backed up data or even in-network, connecting Azure Backup and storage clusters associated with a customer’s backed up data. Customers previously could not perform restores to primary or secondary regions. With Cross Region Restore, customers can perform a restore in the secondary region using a replica of backed up data in the secondary region.
No outage: Previously there was no provision for customers to conduct business continuity and disaster recovery (BCDR) drills for audit or compliance purposes with the secondary region data. This new capability enables customers to perform a restore of backed up data in the secondary region even if there is not a full or partial outage in the primary region for business continuity and disaster recovery drills.

Azure Backup leverages storage accounts’ read-access geo-redundant storage (RA-GRS) capability to support restores from a secondary region. Note that due to delays in storage replication from primary to secondary, there will be latency in the backed up data being available for a restore in the secondary region.

Key features available with the preview include:

Self-service recoveries of secondary backed up data in a secondary region
Enables the ability to conduct disaster recovery (DR) drills for audit and compliance anytime
High availability of backup data during partial or full outages of an Azure region

With this preview, Azure Backup will support restoring Azure Virtual Machines as well as disks from a secondary region.

How to onboard to this feature

Cross Region Restore can be enabled on Recovery Services vault by turning on the Cross Region Restore setting for Recovery Services vault with the geo-redundant storage redundancy setting. Note that this feature does not support the restore of classic virtual machines as well as vaults with locally redundant storage (LRS) redundancy settings. Only Recovery Service vault enabled with geo-redundant storage settings will have the option to onboard to this feature. Cross Region Restore is now available in all Azure public regions. The regions where this feature is supported are updated in this Cross Region Restore documentation.

The road ahead

Azure Backup will extend its support to all other workloads apart from Azure Virtual Machines in the coming months. Learn more about Cross Region Restore and sign up for the preview.

Pricing

Currently pricing for enabling Cross Region Restore on Recovery Services vault will remain the same as pricing for geo-redundant storage based Recovery Services vault. Please refer to Azure Backup pricing to learn more about the details of Cross Region Restore pricing. For further queries related to pricing, please contact AskAzureBackupTeam.

Get started with Cross Region Restore

Learn more about Cross Region Restore.
Getting started with Recovery Services vault.
Need help? Reach out to Azure Backup forum for support.
Tell us how we can improve Azure Backup by contributing new ideas and voting up existing ones.
Follow us on Twitter @AzureBackup for the latest news and updates.

Quelle: Azure

Azure Container Registry: Mitigating data exfiltration with dedicated data endpoints

Azure Container Registry announces dedicated data endpoints, enabling tightly scoped client firewall rules to specific registries, minimizing data exfiltration concerns.

Pulling content from a registry involves two endpoints:

Registry endpoint, often referred to as the login URL, used for authentication and content discovery.
A command like docker pull contoso.azurecr.io/hello-world makes a REST request which authenticates and negotiates the layers which represent the requested artifact.
Data endpoints serve blobs representing content layers.

Registry managed storage accounts

Azure Container Registry is a multi-tenant service, where the data endpoint storage accounts are managed by the registry service. There are many benefits for managed storage, such as load balancing, contentious content splitting, multiple copies for higher concurrent content delivery, and multi-region support with geo-replication.

Azure Private Link virtual network support

Azure Container Registry recently announced Private Link support, enabling private endpoints from Azure Virtual Networks to be placed on the managed registry service. In this case, both the registry and data endpoints are accessible from within the virtual network, using private IPs.

The public endpoint can then be removed, securing the managed registry and storage accounts to access from within the virtual network.
 

Unfortunately, virtual network connectivity isn’t always an option.

Client firewall rules and data exfiltration risks

When connecting to a registry from on-prem hosts, IoT devices, custom build agents, or when Private Link may not be an option, client firewall rules may be applied, limiting access to specific resources.

 
As customers locked down their client firewall configurations, they realized they must create a rule with a wildcard for all storage accounts, raising concerns for data-exfiltration. A bad actor could deploy code that would be capable of writing to their storage account.

To mitigate data-exfiltration concerns, Azure Container Registry is making dedicated data endpoints available.

Dedicated data endpoints

When dedicated data endpoints are enabled, layers are retrieved from the Azure Container Registry service, with fully qualified domain names representing the registry domain. As any registry may become geo-replicated, a regional pattern is used:

[registry].[region].data.azurecr.io.

For the Contoso example, multiple regional data endpoints are added supporting the local region with a nearby replica.

With dedicated data endpoints, the bad actor is blocked from writing to other storage accounts.

Enabling dedicated data endpoints

Note: Switching to dedicated data-endpoints will impact clients that have configured firewall access to the existing *.blob.core.windows.net endpoints, causing pull failures. To assure clients have consistent access, add the new data-endpoints to the client firewall rules. Once completed, existing registries can enable dedicated data-endpoints through the az cli.

Using az cli version 2.4.0 or greater, run the az acr update command:

az acr update –name contoso –data-endpoint-enabled

To view the data endpoints, including regional endpoints for geo-replicated registries, use the az acr show-endpoints cli:

az acr show-endpoints –name contoso

outputs:

{
  "loginServer": "contoso.azurecr.io",
  "dataEndpoints": [
    {
      "region": "eastus",
      "endpoint": "contoso.eastus.data.azurecr.io",
    },
    {
      "region": "westus",
      "endpoint": "contoso.westus.data.azurecr.io",
    }
  ]
}

Security with Azure Private Link

Azure Private Link is the most secure way to control network access between clients and the registry as network traffic is limited to the Azure Virtual Network, using private IPs. When Private Link isn’t an option, dedicated data endpoints can provide secure knowledge in what resources are accessible from each client.

Pricing information

Dedicated data endpoints are a feature of premium registries.

For more information on dedicated data endpoints, see the pricing information here.
Quelle: Azure

Azure Cost Management + Billing updates – April 2020

Whether you're a new student, thriving startup, or the largest enterprise, you have financial constraints and you need to know what you're spending, where, and how to plan for the future. Nobody wants a surprise when it comes to the bill, and this is where Azure Cost Management + Billing comes in.

We're always looking for ways to learn more about your challenges and how Azure Cost Management + Billing can help you better understand where you're accruing costs in the cloud, identify and prevent bad spending patterns, and optimize costs to empower you to do more with less. Here are a few of the latest improvements and updates based on your feedback:

Azure Spot Virtual Machines now generally available.
Monitoring your reservation and Marketplace purchases with budgets.
Automate cost savings with Azure Resource Graph.
Azure Cost Management covered by FedRAMP High.
Tell us about your reporting goals.
New ways to save money with Azure.
New videos and learning opportunities.
Documentation updates.

Let's dig into the details.


Azure Spot Virtual Machines now generally available

We all want to save money. We often look at our largest workloads for savings opportunities, but make sure you don't stop there. You may be able to save up to 90 percent on interruptible virtual machine workloads with Azure Spot Virtual Machines (Spot VMs), now generally available.

Spot VMs allow you to utilize unused compute capacity at very low rates compared to pay-as-you-go prices. Spot VMs are best suited to batch jobs, supplementing workloads that can be interrupted, dev/test environments, stateless applications, and other fault-tolerant applications. Spot VMs can be very useful in reducing the cost of running applications significantly or alternatively staying within budget while scaling out your applications.

Learn more about how to identify and track Spot VM costs in Azure Cost Management.


Monitoring your reservation and Marketplace purchases with budgets

Azure Cost Management budgets help you plan for and drive organizational accountability by ensuring everyone is aware as costs increase. You already know you can monitor usage of your Azure and AWS services. Now you can also track and get notified when a reservation or Marketplace purchase causes you to exceed your budget.

With the inclusion of purchases, your budgets become even more powerful. You have a more complete picture of your costs, enabling you to proactively manage and optimize costs to stay within your financial constraints. You can even target these costs more specifically, for finer-grained monitoring.

Let's say you don't expect your Marketplace purchases to be over $1000 per month. Create a monthly budget where PublisherType is set to Marketplace and ChargeType is set to Purchase. Setup notifications for 50 percent, 75 percent, or another portion of your budget, and you'll get an email if those thresholds are hit. Pretty simple.

How about reservation purchases? You may not want to limit reservation purchases since they do help save money, but maybe you just want to be notified when they're used throughout the organization. Create a yearly budget where PublisherType is set to Azure and ChargeType is set to Purchase. You'll get notified as purchases cause the threshold to be exceeded and at that point, you can even increase the budget amount to continue to get notified as new reservations are purchased.

Alternatively, if you only want to monitor usage, simply filter ChargeType to Usage. That's it!

Of course, this is just the tip of the iceberg. Learn more about how to monitor and control spending with Azure Cost Management budgets.


Automate cost savings with Azure Resource Graph

You already know Azure Advisor helps you reduce and optimize costs without sacrificing quality. And you may already be familiar with the Azure Advisor APIs that enable you to integrate recommendations into your own reporting or automation. Now you can also get recommendations via Azure Resource Graph.

Azure Resource Graph enables you to explore your Azure resources across subscriptions. You can use advanced filtering, grouping, and sorting based on resource properties and relationships to target specific workloads and even take that further to automate resource management and governance at scale. Now, with the addition of Azure Advisor recommendations, you can also query your cost saving recommendations.

Querying for recommendations is easy. Just open Azure Resource Graph in the Azure portal and explore the advisorresources table. Let's say you want a summary of your potential cost savings opportunities:

advisorresources
// First, we trim down the list to only cost recommendations
| where type == 'microsoft.advisor/recommendations'
| where properties.category == 'Cost'
//
// Then we group rows…
| summarize
// …count the resources and add up the total savings
     resources = dcount(tostring(properties.resourceMetadata.resourceId)),
     savings = sum(todouble(properties.extendedProperties.savingsAmount))
     by
// …for each recommendation type (solution)
     solution = tostring(properties.shortDescription.solution),
     currency = tostring(properties.extendedProperties.savingsCurrency)
//
// And lastly, format and sort the list
| project solution, resources, savings = bin(savings, 0.01), currency
| order by savings desc

Take this one step further using Logic Apps or Azure Functions and send out weekly emails to subscription and resource group owners. Or pivot this on resource ID and setup an approval workflow to automatically delete unused resources or downsize underutilized virtual machines. The sky's the limit!


Azure Cost Management covered by FedRAMP High

Azure Cost Management is now one of the 101 services covered by the Federal Risk and Authorization Management Program (FedRAMP) High Provisional Authorization to Operate (P-ATO) for Azure Government—more services than any other cloud provider.

Learn more about the expanded FedRAMP High coverage.


Tell us about your reporting goals

As you know, we're always looking for ways to learn more about your needs and expectations. If you already responded last month, thank you! If not, we'd like to learn about the most important reporting tasks and goals you have when managing and optimizing costs. We'll use your inputs from this survey to help prioritize reporting improvements within Cost Management + Billing experiences over the coming months. The 9-question survey should take about 10 minutes. Please share this with anyone working with Azure Cost Management + Billing. The more diverse perspectives we get, the better we can serve you, your team, and your organization.

Take the survey.


New ways to save money with Azure

Lots of cost optimization improvements over the past month. Here are a few you might be interested in:

Azure Spot VMs are now generally available, enabling you to save up to 90 percent on interruptible workloads.
Save up to 49 percent with new 3-year reservations for Azure Database for MariaDB.
Save up to 65 percent with new 3-year reservations for Azure Database for MySQL.
Save up to 65 percent with Azure Dedicated Host reservations.
Simplify Windows virtual machine management and save money with Azure DevTest discounts.
Reduce user license costs with Azure DevOps multi-org billing.


New videos and learning opportunities

For those visual learners out there, there are five new videos and a new MS Learn learning path you should take a look at:

Setting up for success (8 minutes).
Setting up entity hierarchies (8 minutes).
Controlling access (12 minutes).
Reporting by dimensions and tags (8 minutes).
How to set up "Connectors for AWS" in Azure Cost Management (9 minutes).
Control Azure spending and manage bills with Azure Cost Management + Billing (2 hours 36 minutes).

Follow the Azure Cost Management + Billing YouTube channel to stay in the loop with new videos as they're released and let us know what you'd like to see next.

Want a more guided experience? Start with Control Azure spending and manage bills with Azure Cost Management + Billing.


Documentation updates

Here are a few documentation updates you might be interested in:

Prevent unexpected charges with Azure Cost Management + Billing.
How to enable access to costs for new/renewed EA enrollments.
How to determine what reservations you should purchase.
Added reservation and spot usage analysis to common cost analysis uses.
Create management groups as part of a Resource Manager deployment template.

Want to keep an eye on all of the documentation updates? Check out the Cost Management + Billing doc change history in the azure-docs repository on GitHub. If you see something missing, select Edit at the top of the document and submit a quick pull request.


What's next?

These are just a few of the big updates from last month. Don't forget to check out the previous Azure Cost Management + Billing updates. We're always listening and making constant improvements based on your feedback, so please keep the feedback coming.

Follow @AzureCostMgmt on Twitter and subscribe to the YouTube channel for updates, tips, and tricks. And, as always, share your ideas and vote up others in the Cost Management feedback forum.

We know these are trying times for everyone. Best wishes from the Azure Cost Management team. Stay safe and stay healthy!
Quelle: Azure

Multi-arch build and images, the simple way

“Build once, deploy anywhere” is really nice on the paper but if you want to use ARM targets to reduce your bill, such as Raspberry Pis and AWS A1 instances, or even keep using your old i386 servers, deploying everywhere can become a tricky problem as you need to build your software for these platforms. To fix this problem, Docker introduced the principle of multi-arch builds and we’ll see how to use this  and put it into production.

Quick setup

To be able to use the docker manifest command, you’ll have to enable the experimental features.

On macOS and Windows, it’s really simple. Open the Preferences > Command Line panel and just enable the experimental features.

On Linux, you’ll have to edit ~/.docker/config.json and restart the engine.

Under the hood

OK, now we understand why multi-arch images are interesting, but how do we produce them? How do they  work?

Each Docker image is represented by a manifest. A manifest is a JSON file containing all the information about a Docker image. This includes references to each of its layers, their corresponding sizes, the hash of the image, its size and also the platform it’s supposed to work on. This manifest can then be referenced by a tag so that it’s easy to find.

For example, if you run the following command, you’ll get the manifest of a non-multi-arch image in the rustlang/rust repository with the nightly-slim tag:

$ docker manifest inspect –verbose rustlang/rust:nightly-slim{   “Ref”: “docker.io/amd64/rust:1.42-slim-buster”,  “Descriptor”: {    “mediaType”: “application/vnd.docker.distribution.manifest.v2+json”,    “digest”: “sha256:1bf29985958d1436197c3b507e697fbf1ae99489ea69e59972a30654cdce70cb”,    “size”: 742,    “platform”: {      “architecture”: “amd64”,      “os”: “linux”    }  },  “SchemaV2Manifest”: {    “schemaVersion”: 2,    “mediaType”: “application/vnd.docker.distribution.manifest.v2+json”,    “config”: {      “mediaType”: “application/vnd.docker.container.image.v1+json”,      “size”: 4830,      “digest”: “sha256:dbeae51214f7ff96fb23481776002739cf29b47bce62ca8ebc5191d9ddcd85ae”    },    “layers”: [      {      “mediaType”: “application/vnd.docker.image.rootfs.diff.tar.gzip”,      “size”: 27091862,      “digest”: “sha256:c499e6d256d6d4a546f1c141e04b5b4951983ba7581e39deaf5cc595289ee70f”
      },      {
        “mediaType”: “application/vnd.docker.image.rootfs.diff.tar.gzip”,        “size”: 175987238,        “digest”: “sha256:e2f298701fbeb02568c3dcb9822f8488e24ef12f5430bc2e8562016ba8670f0d”
      }    ]  }}

The question is now, how can we put multiple Docker images, each supporting a different architecture, behind the sametag?

What if this manifest file contained a list of manifests, so that the Docker Engine could pick the one that it matches at runtime? That’s exactly how the manifest is built for a multi-arch image. This type of manifest is called a manifest list.

Let’s take a look at a multi-arch image:

$ docker manifest inspect –verbose rust:1.42-slim-buster[  {    “Ref”: “docker.io/library/rust:1.42-slim-buster@sha256:1bf29985958d1436197c3b507e697fbf1ae99489ea69e59972a30654cdce70cb”,    “Descriptor”: {      “mediaType”: “application/vnd.docker.distribution.manifest.v2+json”,       “digest”: “sha256:1bf29985958d1436197c3b507e697fbf1ae99489ea69e59972a30654cdce70cb”,      “size”: 742,      “platform”: {         “architecture”: “amd64”,        “os”: “linux”      }    },    “SchemaV2Manifest”: { … }  },  {    “Ref”: “docker.io/library/rust:1.42-slim-buster@sha256:116d243c6346c44f3d458e650e8cc4e0b66ae0bcd37897e77f06054a5691c570”,    “Descriptor”: {      “mediaType”: “application/vnd.docker.distribution.manifest.v2+json”,      “digest”: “sha256:116d243c6346c44f3d458e650e8cc4e0b66ae0bcd37897e77f06054a5691c570”,      “size”: 742,      “platform”: {        “architecture”: “arm”,        “os”: “linux”,        “variant”: “v7”      }    },    “SchemaV2Manifest”: { … }…]

We can see that it’s a simple list of the manifests of all the different images, each with a platform section that can be used by the Docker Engine to match itself to.

How they’re made

There are two ways to use Docker to build a multiarch image: using docker manifest or using docker buildx.

To demonstrate this, we will need a project to play. We’ll use the following Dockerfile which just results in a Debian based image that includes the curl binary.

ARG ARCH=FROM ${ARCH}debian:buster-slimRUN apt-get update && apt-get install -y curl && rm -rf /var/lib/apt/lists/*ENTRYPOINT [ “curl” ]

Now we are ready to start building our multi-arch image.

The hard way with docker manifest

We’ll start by doing it the hard way with `docker manifest` because it’s the oldest tool made by Docker to build multiarch images.

To begin our journey, we’ll first need to build and push the images for each architecture to the Docker Hub. We will then combine all these images in a manifest list referenced by a tag.

# AMD64$ docker build -t your-username/multiarch-example:manifest-amd64 –build-arg ARCH=amd64/ .$ docker push your-username/multiarch-example:manifest-amd64# ARM32V7$ docker build -t your-username/multiarch-example:manifest-arm32v7 –build-arg ARCH=arm32v7/ .$ docker push your-username/multiarch-example:manifest-arm32v7# ARM64V8$ docker build -t your-username/multiarch-example:manifest-arm64v8 –build-arg ARCH=arm64v8/ .$ docker push your-username/multiarch-example:manifest-arm64v8

Now that we have built our images and pushed them, we are able to reference them all in a manifest list using the docker manifest command.

$ docker manifest create your-username/multiarch-example:manifest-latest –amend your-username/multiarch-example:manifest-amd64 –amend your-username/multiarch-example:manifest-arm32v7 –amend your-username/multiarch-example:manifest-arm64v8

Once the manifest list has been created, we can push it to Docker Hub.

$ docker manifest push your-username/multiarch-example:manifest-latest

If you now go to Docker Hub, you’ll be able to see the new tag referencing the images:

The simple way with docker buildx

You should be aware that buildx is still experimental.

If you are on Mac or Windows, you have nothing to worry about, buildx is shipped with Docker Desktop. If you are on linux, you might need to install it by following the documentation here https://github.com/docker/buildx

The magic of buildx is that the whole above process can be done with a single command.

$ docker buildx build –push –platform linux/arm/v7,linux/arm64/v8,linux/amd64 –tag your-username/multiarch-example:buildx-latest .

And that’s it, one command, one tag and multiple images.

Let’s go to production

We’ll now try to target the CI and use GitHub Actions to build a multiarch image and push it to the Hub.

To do so, we’ll write a configuration file that we’ll put in .github/workflows/image.yml of our git repository.

name: build our imageon:  push:    branches: masterjobs:  build:    runs-on: ubuntu-latest    steps:      – name: checkout code        uses: actions/checkout@v2      – name: install buildx        id: buildx        uses: crazy-max/ghaction-docker-buildx@v1        with:          version: latest      – name: build the image      run: |        docker buildx build           –tag your-username/multiarch-example:latest           –platform linux/amd64,linux/arm/v7,linux/arm64 .

Thanks to the GitHub Action crazy-max/docker-buildx we can install and configure buildx with only one step.

To be able to push, we now have to get an access token on Docker Hub in the security settings.

Once you created it, you’ll have to set it in your repository settings in the Secrets section. We’ll create DOCKER_USERNAME and DOCKER_PASSWORD variables to login afterward.

Now, we can update the GitHub Action configuration file and add the login step before the build. And then, we can add the –push to the buildx command.

…      – name: login to docker hub        run: echo “${{ secrets.DOCKER_PASSWORD }}” | docker login -u “${{ secrets.DOCKER_USERNAME }}” –password-stdin      – name: build the image        run: |          docker buildx build –push             –tag your-username/multiarch-example:latest             –platform linux/amd64,linux/arm/v7,linux/arm64 .

We now have our image being built and pushed each time something is pushed on master.

Conclusion

This post gives an example of how to build a multiarch Docker image and push it to the Docker Hub. It also showed how to automate this process for git repositories using GitHub Actions; but this can be done from any other CI system too.

An example of building multiarch image on Circle CI, Gitlab CI and Travis can be found here.
The post Multi-arch build and images, the simple way appeared first on Docker Blog.
Quelle: https://blog.docker.com/feed/



