Extended retention for custom and Prometheus metrics in Cloud Monitoring

Metrics help you understand how your business and applications are performing. Longer metric retention enables quarter-over-quarter or year-over-year analysis and reporting, forecasting seasonal trends, retention for compliance, and much more. We recently announced the general availability (GA) of extended metric retention forcustom andPrometheus metrics in Cloud Monitoring, increasing retention from 6 weeks to 24 months. Extended retention for custom and Prometheus metrics is enabled by default.Longer retention is particularly useful in financial services, retail, healthcare, and media organizations. For example, a finance team could use the extended data to forecast seasonal trends, so that you know how many Compute Engine instances to reserve ahead of time for Black Friday. Similarly, a DevOps team could use year over year data to help inform a scaling plan for Cyber Monday.To achieve higher charting performance, Cloud Monitoring stores metric data for 6 weeks at its original sampling frequency, then downsamples it to 10-minute intervals for extended storage. This ensures that you can view extended retention metrics but still query with high performance. There is no additional cost for extended retention (see Cloud Monitoring chargeable services which is based on volume ingestion for specific metric types). Extended retention for Google Cloud (system) metrics, agent metrics, and other metric types is coming soon.How to query extended retention metricsLet’s take an example scenario where you have a Compute Engine VM running a web application. In that web app, you write a metric that tracks a critical user journey for which you want to perform a month-over-month analysis.To query metric data for a month-over-month comparison, go to Cloud Monitoring and select Metrics Explorer. Select your custom or Prometheus metric and the resource type. Then click on “Custom” in the time range selector above the chart. Previously the time-range selector only allowed you to select up to 6 weeks of metric data; now you can select up to 24 months.Querying extended retention metric data for custom and Prometheus metrics in Cloud Monitoring Metrics ExplorerThe Custom time range selector lets you query metric data that is up to 24 months oldIn addition to the UI, you can also perform the above query steps programmatically through theListTimeSeries endpoint of the Monitoring API.The above query lets you view metric data values for a given time range. But how do you compare results month over month?To perform time shift analysis, you can use the Cloud Monitoring Query Language, which recently became generally available.Let’s take the example of a custom metric that tracks request counts for a shopping cart service in an e-commerce application. The following query returns the overall mean request counts now and from a month ago. Using “union”, you can display these two results on the same chart. Note: the resource and metric specified below are an example; to use it in your environment, replace them with your own custom or Prometheus metric.To enter the query, go to Metrics Explorer and click the “Query Editor” button:Enter the above query, click “Run Query”, and you’ll see a result like the following:Extending the usefulness of metricsWith Cloud Monitoring, we give you visibility into your data and help you to understand the health and performance of your services and applications. Extended metric retention helps your DevOps, engineering, and business teams with troubleshooting and debugging, compliance, reporting, and many other use cases. It allows you to do real-time operations and long-term data analysis in a single tool, without needing to export to another data analytics tool. If you have any questions or feedback, please click Help > Send Feedback in the Cloud Monitoring UI or contact Cloud Support. We also invite you to join the discussion on our mailing list. As always, we welcome your feedback.
Quelle: Google Cloud Platform
MySQL 8 is ready for the enterprise with Cloud SQL

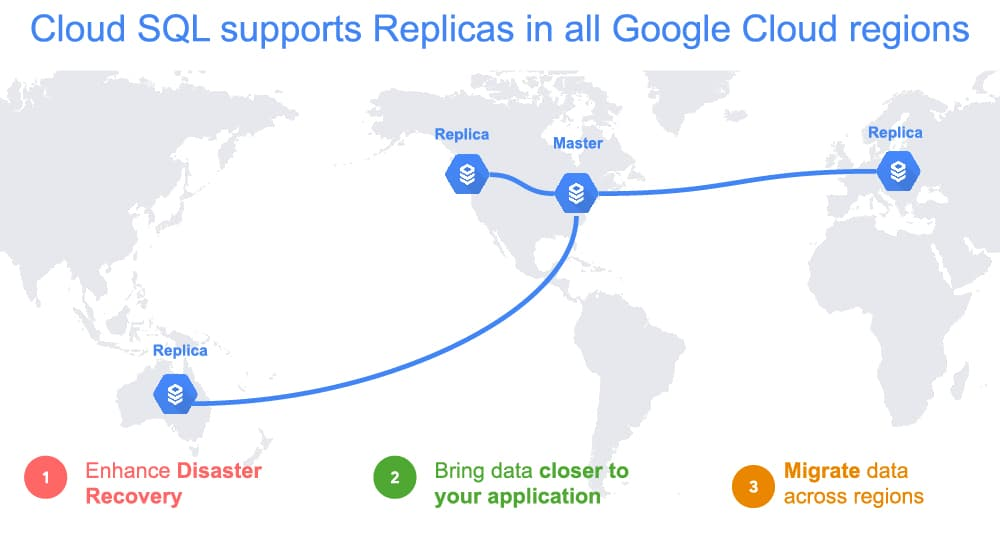
Today, we’re announcing that Cloud SQL, our fully managed database service for MySQL, PostgreSQL, and SQL Server, now supports MySQL 8. This means you get access to a variety of powerful new features—such as instant DDL statements (e.g. ADD COLUMN), atomic DDL, privilege collection using roles, window functions, and extended JSON syntax – to help you be more productive. And, as a managed service, we’ll ensure your MySQL 8 deployments help you stay stable and more secure. You’ll get automatic patches and updates, as well as our maintenance controls so you can reduce the risk associated with upgrades. More so, we’ve fully integrated it with Cloud SQL’s high availability configuration and security controls, to make sure your MySQL 8 database instance is enterprise ready.High availability and Disaster RecoveryConsidering a wide variety of failure scenarios, from localized problems to widespread issues, is an important party of business continuity planning. With MySQL 8 on Cloud SQL, you enable high availability (HA) to ensure your database workloads are automatically fault tolerant in the event of an instance-level problem or even a zone outage. We’ve worked closely with Cloud SQL customers facing business continuity challenges to simplify their experience with support for cross-region replication. Cross region replication for MySQL 8 is supported in all Google Cloud regions.SecurityCloud SQL is designed to provide multiple layers of security without complexity, whether you’re looking to protect your data or comply with regulations. Encryption of data is a foundational control, which is why Cloud SQL encrypts data at rest by default. For organizations that have sensitive or regulated data, we offer customer-managed encryption keys (CMEK) to support compliance with regulatory requirements and maintain control of your own encryption keys.To secure connectivity to your MySQL 8 instance, you can use private services access and VPC Service Controls. Private services access gives your database instance a private IP address, using Google Cloud VPC. Because VPCs are global, creating a cross-region replica requires no networking setup. Global VPC uses private IP for replication traffic between regions—helping to eliminate the need for complex VPN and VPC configuration, which would otherwise be needed to set up cross-region networking. With VPC Service Controls, you can define fine-grained perimeter controls to make your Cloud SQL API accessible only from within your service perimeter.Ready to build?Combine powerful availability and these security features to quickly build a scalable and fault tolerant application, using the Cloud SQL Proxy, our connection management integration with Google Kubernetes Engine (GKE). The Cloud SQL Proxy automatically encrypts connections without the need to manually configure SSL and makes connecting from GKE easy. With more than than 500,000 proxy instances deployed on GKE, this is a popular option. See for yourself by building an application with our Codelab.Can I apply my Committed Use Discounts?We built Committed Use Discounts so you attain the savings you expect—no matter how you configure your resources or which database you select. The discounts also apply to usage from all versions supported by Cloud SQL, including MySQL 8. Feel free to start using MySQL 8 and know that you don’t need to make any manual changes or updates to realize savings from your existing Committed Use Discounts.What’s next for Cloud SQLSupport for MySQL 8 has been a top request from users. We’re committed to compatibility and bringing you more frequent version updates in the future. We’re also committed to making sure new database versions are fully integrated with the Cloud SQL platform so you can run your most sensitive and critical applications. Have more ideas? Let us know what other features and capabilities you need with our Issue Tracker and by joining the Cloud SQL discussion group. We’re glad you’re along for the ride, and we look forward to your feedback!
Quelle: Google Cloud Platform