Migrating from GKE to CloudRun

medium.com – GKE is one of the wonderful service offerings from Google cloud. However, just that your services or functionalities are dockerized, does not mean that GKE should be the only choice of runtime to ach…
Quelle: news.kubernauts.io

Is Rancher going in the SUSE Box?

The post Is Rancher going in the SUSE Box? appeared first on Mirantis | Pure Play Open Cloud.
SUSE’s $600 million (USD) acquisition of Rancher Labs means that the Kubernetes market is heading towards a major decision-point between freedom of choice and solutions tied to an enterprise Linux distribution and its agenda.
For a long time, Rancher has been telling customers that they’re committed to open source, and has claimed freedom of choice as a core part of their value proposition. But in hitching their steers to an OS-maker’s wagon, will they be turning their back on these principles? We think there’s ample reason for Rancher customers to be concerned, and for those evaluating and comparing enterprise Kubernetes solutions to be cautious.
SUSE’s CaaS and App platforms, after all, both ran only on SUSE products. Their strategy — just like Red Hat’s with OpenShift — seems pretty clear: build a tall Kubernetes enterprise application stack — each layer locked into the one below it, all grounded on an enterprise Linux spin that they control.
Now, the risk to Rancher users is that SUSE will double down on this strategy, copying Red Hat, Canonical, and other Linux providers in closely coupling Kubernetes offerings to their core OS platform. Cloud-hosted Kubernetes service providers have done this too, of course, though in different ways.
(In fact, this leaves Mirantis as the only leading enterprise Kubernetes solution provider still unambiguously committed to providing a zero lock-in platform and empowering customer freedom of choice.)
How’s this likely to roll out?
For a while, current Rancher users will be unaffected: they’ll keep running the platform on any OS Rancher currently supports. Gradually, though, economics and profit motives will likely urge creation of hard dependencies between Rancher and SUSE Linux Enterprise Server, gradually limiting customer choice and promoting lock-in.
How could this look? Lots of small changes, with valuable bits moving around from place to place. Red Hat does this a lot: for example, they implemented FIPS 140-2 compliance (use of NIST-certified ciphers for traffic encryption within nodes) in RHEL, rather than OpenShift, locking platform and OS tighter than ever together for users who need this level of encryption.
What will it mean for Rancher users, if it happens? First, there’s cost. They’ll need to pay for the OS their platform runs on, just like you can’t run OpenShift without running Red Hat Enterprise Linux. Every new node adds a fixed (or, on cloud platforms, recurring) charge, plus maybe the additional cost of skilling-up to support a new flavor of Linux. This may not sit well with top developers and IT ops talent, who tend to want control over the operating systems they work with and depend on.
Then there are roadblocks. For example, you might be barred from deploying Kubernetes on certain platform footprints, simply because they can’t run the required host OS. 
Will all this happen to Rancher users? Only time will tell — for now, though, we know for sure that lock-in is profitable for (some) vendors, and that others are strongly compelled to try to duplicate that success. We saw this with OS-vendor-driven OpenStack distributions, for example, which became more and more dependent on proprietary OS features and associated services. We see it now with Kubernetes offerings from Red Hat, Canonical, and similar quasi-proprietary spins from every cloud provider.
If this concerns you, please get in touch, and let’s discuss the cost and productivity benefits of opting for Kubernetes freedom of choice.
The post Is Rancher going in the SUSE Box? appeared first on Mirantis | Pure Play Open Cloud.
Quelle: Mirantis

Setting SLOs: a step-by-step guide

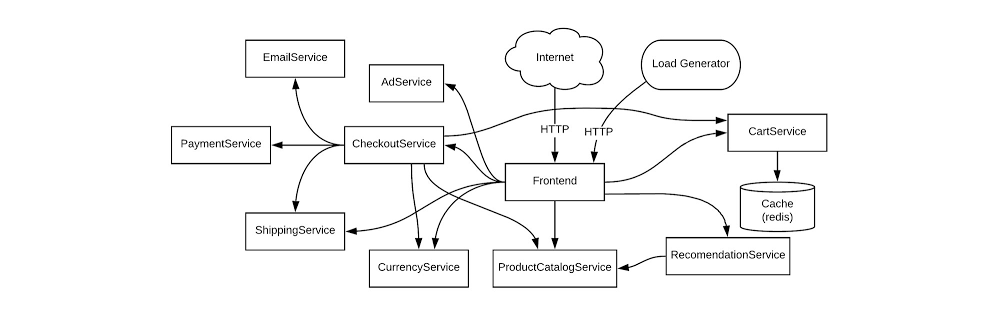
Are you responsible for a customer-facing service? If you are, you know that when that service is unavailable, it can impact your revenue. A lengthy outage could drive your customers to competitors. How do you know if your customers are generally happy with your service? If you follow site reliability engineering (SRE) principles, you can measure customer experience with service-level objectives (SLOs). SLOs allow you to quantifiably measure customer happiness, which directly impacts the business.   Instead of creating a potentially unbounded number of monitoring metrics, we suggest using a small number of alerts grounded in customer pain—i.e., violation of SLOs. This lets you focus alerts on scenarios where you can confidently assert that customers are experiencing, or will soon experience, significant pain.Here we’ll walk through a hands-on approach for coming up with SLOs for a service and creating real dashboards and alerts.Setting SLOs for an example serviceWe’re going to be creating SLOs for a web-based e-commerce app called “Online Boutique” that sells vintage items. The app is composed of 10 microservices, written in a variety of languages and deployed on an Istio-installed Google Kubernetes Engine (GKE) cluster.Here’s what our architecture looks like:This shop has a front end that exposes an HTTP server to serve the website, a cart service, product catalog, checkout, and various other services. Our service is pretty complex and we can easily get into the weeds trying to figure out what metrics we need to monitor. Fortunately for us, using SLOs, we can drill down to monitor the most important aspects of our service using an easy step-by-step approach. Here’s how to determine good SLOs:SLO process overviewList out critical user journeys and order them by business impact.Determine which metrics to use as service-level indicators (SLIs) to most accurately track the user experience.Determine SLO target goals and the SLO measurement period.Create SLI, SLO, and error budget consoles.Create SLO alerts.Step 1: List out critical user journeys and order them by business impactThe first step in SLO creation is listing critical user journeys for this business. A critical user journey describes a set of interactions a user has with a service to achieve some end result. So let’s look at a few of the actions our customers will be taking when they use the service:Browse productsCheck outAdd to cartNext, let’s order these items by business impact. In this case, as an e-commerce shop, it’s important that customers can complete their purchases. Look at user journeys that directly affect their ability to do so.So the newly prioritized list is going to look like this:Check outAdd to cartBrowse productsYou may be wondering why “browse products” is at the bottom of this list. Shouldn’t it be a dependency of the other two items, thus making it more important? You would be correct; it is a dependency of the other two items. However, users can come to your site and browse products all day long, but that doesn’t mean they want to buy anything. When they go through the checkout flow, you now have a stronger indicator of an intent to make a purchase, so this portion of your service is very important to your business.For the rest of this example, we’ll use the “Checkout” critical user journey as the basis for SLOs. Once you know how the process works, you can apply the same techniques to other critical user journeys. Step 2: Determine which metrics to use as SLIs to most accurately track the user experienceThe next step is to figure out which metrics to use as SLIs that will most accurately track the user experience. SLIs are the quantifiable measurements that indicate whether or not the service is working. We can choose from a wide range of indicators, such as availability (i. e., how many requests are succeeding), latency (i.e., how long a request takes), throughput, correctness, data freshness, etc.The SLI equation can help quantify the right SLI for the business:The SLI equation is the number of good events divided by the total number of valid events, multiplied by 100 to keep it a uniform percentage.Let’s look at the SLIs we want to measure for the “Checkout” critical user journey. Picture the journey your customers take to buy a product from the store. First, they spend time browsing, researching items, adding the item to cart (maybe letting it sit there so they can think about it some more), then finally, when they are ready, they decide to check out. If you get this far with your customer, you can assume you’ve succeeded in gaining their business, so it is absolutely critical that customers are able to check out.Here are the SLIs to consider for this user journey.Availability SLIWe want the checkout functionality of our service to be available to our users, so we’ll choose an availability SLI. What we’re looking for is a metric that will tell us how well our service performs in terms of availability. In this case, we want to monitor how many users tried to check out and how many of those requests succeeded, so the number of successful requests is the ”good” metric. It’s important to detail what specifically we’re going to measure and where we plan on measuring it, so the availability SLI should look something like this:The proportion of HTTP GET requests for /checkout_service/response_counts that do not have 5XX status (3XX and 4XX excluded) measured at the Istio service mesh.Why are 3XX and 4XX status codes excluded? We don’t want to count events that don’t indicate a failure with our service because they will throw our SLI signals off, so we exclude 3XX redirects and 4XX client errors from our “total” value.Latency SLIYou’ll also want to make sure that when a customer checks out, the order confirmation will be returned within an acceptable window. For this, set a latency SLI that measures how long a successful response takes. Here we’ll set a value of 500ms for a response to be returned, assuming that this is an acceptable threshold for the business. So the latency SLI would look like this:The proportion of HTTP GET requests for /checkout_service/response_counts that do not have 5XX status (3XX and 4XX excluded) that send their entire response within 500 ms measured at the Istio service mesh. Step 3: Determine SLO target goals and SLO measurement periodOnce we have SLIs, it’s time to set an SLO. Service-level objectives are a target of service-level indicators during a specified time window. This helps to measure whether the reliability of a service during a given duration—for example, a month, quarter, or year—meets the expectations of most of its users. For example, if there are 10,000 HTTP requests within one calendar month and only 9,990 of those return a successful response according to the SLI, that translates to 9,990/10,000 or 99.9% availability for that month.It’s important to set a target that is achievable so that alerts are meaningful. Normally, when choosing an SLO, it’s best to start from historical trends and assume if enough people are happy with the service now, you’re probably doing OK. Eventually, it’s ideal to converge those numbers with aspirational targets that your business may want you to meet. We can say that our SLO will be 99.9%, according to the historical data trends. Next, it’s time to put these words into real tangible dashboards and alerts. Step 4: Create SLI, SLO, and error budget consolesAs engineers, we need to be able to see the state of the service at any time, which means we need to create monitoring dashboards. For customer-focused monitoring, we want to see graphs for SLIs, SLOs, and error budgets.Most monitoring frameworks operate in very similar ways, so it’s up to you to decide which one to use. The basic components are generally the same. Breaking down the Checkout Availability SLI to generic monitoring fields would most likely look like this:Metric Name: /checkout_service/response_countsFilter: Good filter: http_response_code=200Total filter: http_response_code=500 OR http_response_code=200Aggregation: CumulativeAlignment Window: 1-minute intervalWith a lot of elbow grease, you can calculate the right definitions needed to create SLI and SLO graphs. But this process can be pretty tedious, especially when you have multiple services and SLOs to create. Fortunately, the Service Monitoring component of Cloud Operations can automatically generate these graphs. Because we are using Istio service mesh integration in this example, observability into the system is even more accessible. Here’s how to set up a dashboard with Service Monitoring:1. Go to the Monitoring page in Cloud Console and select Services2. Since we’re using Istio, our services are automatically exposed to Cloud Monitoring, so you just need to select the checkout service.3. Select Create an SLO4. Select Availability and Request-based metric unit.Now you can see the SLIs as well as details into what metrics we are using.5. Select the compliance period. Here we’ll use a rolling window and a target of 30 days. Rolling windows are more closely aligned with user experience, but you can use calendar windows if you want your monitoring to align with your business targets and planning.6. Select the previously set SLO target of 99.9%. Service Monitoring also shows your historical SLO achievements if you have existing data.That’s it! Your monitoring dashboard is ready.Once we’re done, we end up with nice graphs for SLIs, SLOs, and error budgets.You can then repeat the process for the Checkout Latency SLI using the same workflow. Step 5: Create SLO alertsAs much as we love our dashboards, we won’t be looking at them every second of the day, so we want to set up alerts to notify us when our service is in trouble. There are varying preferences for which thresholds to use when creating alerts, but as SREs, we like using the error budget burn-based alerting. Service Monitoring lets you set alerting policies for this exact situation.1. Go to the Monitoring page in Cloud Console and select Services.2. Select Set up alerting policy for the service you want to add an alerting policy for.3. Select SLO burn rate and fill in the alert condition details.Here, we set a burn rate alert that will notify us when we burn our error budget at 2x the baseline rate, where the baseline is the error rate that, if consistent throughout the compliance period, would exactly use up the allotted error budget.4. Save the alert condition.If you run a customer-facing service, following this process will help you define initial SLIs and SLOs. One thing to keep in mind is that your SLOs are never set in stone. It’s important to periodically review your SLOs every six to twelve months and make sure they still align with your users’ expectations and business needs or if there are other ways you can improve your SLOs to more accurately reflect your customer’s needs. There are many factors that can affect your SLOs, so you need to regularly iterate on them. If you want to learn more about implementing SLOs, check out these resources for defining and adopting SLOs. One final note: while we used the Service Monitoring UI to help us create SLIs and SLOs, at the end of the day, SLIs and SLOs are still configurations. As engineers, we want to make sure that our configurations are source-controlled to improve reliability, scalability, and maintainability. To learn more about how to use config files with Service Monitoring, check out the second part of this series at Setting SLOs: observability with custom metrics.
Quelle: Google Cloud Platform
Setting SLOs: observability using custom metrics

If you’ve embarked on your site reliability engineering (SRE) journey, you’ve likely started using service-level objectives (SLOs) to bring customer-focused metrics into your monitoring, perhaps even utilizing Service Monitoring as discussed in “Setting SLOs: a step-by-step guide.” Once you’re able to decrease your alert volume, your oncallers are experiencing less operational overhead and are focused on what matters to your business—your customers. But now, you’ve run into a problem: one of your services is too complex and you’re unable to find a good indicator of customer happiness using Google Cloud Monitoring-provided metrics.This is a common problem, but not one without a solution. In this blog post, we’re going to look at how you can create service-level objectives for services that require custom metrics. We will utilize the help of service monitoring again, but this time, instead of setting SLOs in the UI, we will look at using infrastructure as code with Terraform. Exploring an example service: stock traderFor this example, we have a back-end service that processes stock market trades for buying and selling stocks. Customers submit their trades via a web front end, and their requests are sent to this back-end service for the actual orders to be completed. This service is built on Google Compute Engine. Since the web front end is managed by a different team, we are going to be responsible for setting the SLOs for our back-end service. In this example, the customers are the teams responsible for the services that interact with the back-end service, such as the front-end web app team.This team really cares that our service is available, because without it customers aren’t able to make trades. They also care that trades are processed quickly. So we’ll look at using an availability service-level indicator (SLI) and a latency SLI. For this example, we will only focus on creating SLOs for an availability SLI—or, in other words, the proportion of successful responses to all responses. The trade execution process can return the following status codes: 0 (OK), 1 (FAILED), or 2 (ERROR UNKNOWN). So, if we get a 0 status code, then the request succeeds.Now we need to come up with what metrics we are going to measure and where we are going to measure them. However, this is where the problem lies.There’s a full list of metrics provided by Compute Engine.You might think that instance/uptime shows how long the VM has been running, so it’s a good metric to indicate when a back-end service is available. This is a common mistake, though—if a VM is not running, but no one is making trades, does that mean your customers are unhappy with your service? No. What about the opposite situation: What if the VM is running, but trades aren’t being processed? You’ll quickly find out the answer to that by the number of angry investors at your doorstep. So using instance/uptime is not a good indicator of customer happiness here. You can look at the Compute Engine metrics list and try to justify other metrics like instance/network, instance/disk, etc. to represent your customer happiness, but you’d most likely be out of luck. While there are lots of metrics available in Cloud Monitoring, sometimes custom metrics are needed to gain better observability into our services. Creating custom metrics with OpenCensusThere are various ways that you can create custom metrics to export to Cloud Monitoring, but we recommend using OpenCensus for its idiomatic API, open-source flexibility and ease of use. For this example, we’ve already instrumented the application code using the OpenCensus libraries. We’ve created two custom metrics using OpenCensus: one metric that aggregates the total number of responses with /OpenCensus/total_count and another one, /OpenCensus/success_count, that aggregates the number of successful responses.So now, the availability SLI will look like this:The proportion of /OpenCensus/success_count to /OpenCensus/total_count measured at the application level.Once these custom metrics are exported, we can see them in Cloud Monitoring:Setting the SLO with TerraformWith application-level custom metrics exported to Cloud Monitoring, we can begin to monitor our SLOs with Service Monitoring. Since we are creating configurations, we want to source-control them so that everyone on the team knows what’s been added, removed or modified. There are many ways to set your SLO configurations in Service Monitoring, such as using gcloud commands, Python and Golang libraries, or using a REST API. But in this example, we will be utilizing Terraform and the google_monitoring_slo resource. Since this is configuration-as-code we can take advantage of a version control system to help track our changes, perform rollbacks, etc. Here’s what the Terraform configuration looks like:Let’s explore the main components:resource “google_monitoring_slo” allows us to create a Terraform resource for Service Monitoring.goal = 0.999 sets an SLO target or goal of 99.9%rolling_period_days = 28 sets a rolling SLO target window of 28 daysrequest_based_sli is the meat and potatoes of our SLI. We want to specify an SLI that measures the count of successful requests divided by the count of total requests.good_total_ratio allows us to simply compute the ratio of successful or good requests to all requests. We specify this number by providing two TimeSeries monitoring filters for what constitutes a good_service_filter. In this case, “/opencensus/success_count” is joined with our project identification and resource type. You want to be as precise as you can with your filter so that you only end up with one result. Then do the same for the total_service_filter, which filters for all your total requests.Once the Terraform configuration is applied, the newly created SLO is in the Service Monitoring dashboard for our project (as shown in the figure below). We can even make changes to this SLO at any time by editing our Terraform configuration and re-applying it-simple!Setting a burn-rate alert with TerraformOnce we’ve created our SLO, we will need to create burn-rate alerts to notify us when we’re close to exhausting the error budget. The google_monitoring_alert_policy resource can do this:Let’s explore the main components:conditions determine what criteria must be met to open an incident.filter = “select_slo_burn_rate” is the filter we will use to create SLO burn-based alerts. It takes two arguments: the target SLO and a lookback period.threshold is the error budget consumption rate. If a service uses a burn rate of 1, this means that it is consuming the error budget at a rate that will completely exhaust the error budget by the end of the SLO window.notification_channels will use existing notification channels when the alerting policy is triggered. You can create notification_channels with Terraform, but here we’ll use an existing one.documentation is the information sent when the condition is violated to help recipients diagnose the problem.Now that you’ve looked at how to create SLOs out of the box with service monitoring, and how to create SLOs for custom metrics to get better observability for your customer-focused metrics, you’re well on your way to creating quality SLOs for your own services. You can learn more about the Service Monitoring API to help you accomplish other tasks such as setting windows-based alerts and more.
Quelle: Google Cloud Platform

Enabling hybrid deployments with Cloud CDN and Load Balancing

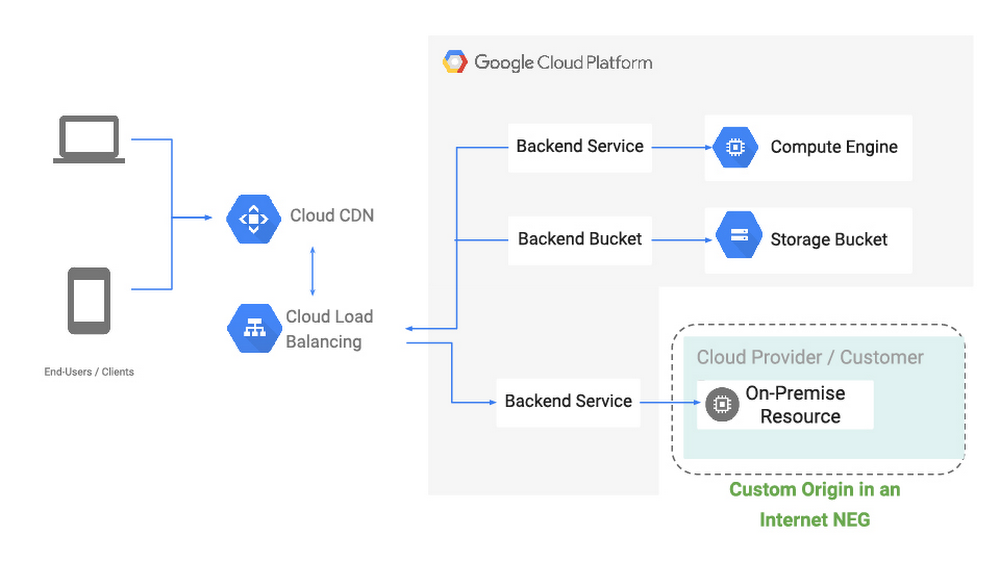
Like many Google Cloud customers, you probably have content, workloads or services that are on-prem or in other clouds. At the same time, you want the benefit of high availability, low latency, and convenience of a single anycast virtual IP address that HTTP(S) Load Balancing and Cloud CDN provide. To enable these hybrid architectures, we’re excited to bring first-class support for external origins to our CDN and HTTP(S) Load Balancing services, so you can pull content or reach web services that are on-prem or in another cloud, using Google’s global high-performance network. Introducing Internet Network Endpoint GroupsA network endpoint group (NEG) is a collection of network endpoints. NEGs are used as backends for some load balancers to define how a set of endpoints should be reached, whether they can be reached, and where they’re located. This new hybrid configuration that we’re discussing today are the result of new internet network endpoint groups, which allow you to configure a publicly addressable endpoint that resides outside of Google Cloud, such as a web server or load balancer running on-prem, or object storage at a third-party cloud provider. From there, you can serve static web and video content via Cloud CDN, or serve front-end shopping cart or API traffic via an external HTTP(S) Load Balancer, similar to configuring backends hosted directly within Google Cloud.With internet network endpoint groups, you can:Use Google’s global edge infrastructure to terminate your user connections closest to where users are.Route traffic to your external origin/backend based on host, path, query parameter and/or header values, allowing you to direct different requests to different sets of infrastructure.Enable Cloud CDN to cache and serve popular content closest to your users across the world.Deliver traffic to your public endpoint across Google’s private backbone, which improves reliability and can decrease latency between client and server.Protect your on-prem deployments with Cloud Armor, Google Cloud’s DDoS and application defense service, by configuring a backend service that includes the NEG containing the external endpoint and associating a Cloud Armor policy to it.Endpoints within an internet NEG can be either a publicly resolvable hostname (i.e., origin.example.com), or the public IP address of the endpoint itself, and can be reached over HTTP/2, HTTPS or HTTP.Let’s look at some of the hybrid use cases enabled with internet NEGs:Use-case #1: Custom (external) origins for Cloud CDNInternet NEGs enable you to serve, cache and accelerate content hosted on origins inside and outside of Google Cloud via Cloud CDN, and use our global backbone for cache fill and dynamic content to keep latency down and availability up.This can be great if you have a large content library that you’re still migrating to the cloud, or a multi-cloud architecture where your web server infrastructure is hosted in a third-party cloud, but you want to make the most of Google’s network performance and network protocols (including support for QUIC and TLS 1.3). Use-case #2: Hybrid global load balancingPicking up and moving complex, critical infrastructure to the cloud safely can take time, and many organizations choose to perform it in phases. Internet NEGs let you make the most of our global network and load balancing—an anycast network, planet-scale capacity and Cloud Armor—before you’ve moved all (or even any) of your infrastructure.With this configuration, requests are proxied by the HTTP(S) load-balancer to services running on Google Cloud or other clouds to the services running in your on-prem locations that are configured as an internet NEG backend to your load-balancer. With Google’s global edge and the global network, you are able to deal elastically with traffic peaks, be more resilient, and protect your backend workloads from DDoS attacks by using Cloud Armor. In this first launch of  internet NEG, we only support a single non-GCP endpoint. A typical use-case is where this endpoint points to a load-balancer virtual IP address on premises. We are also working on enabling multiple endpoints for internet NEG and health-checking for these endpoints.  We will continue to offer new NEG capabilities, including support for non GCP RFC-1918 addresses as load-balancing endpoints. What’s next?We believe hybrid connectivity options can help us meet you where you are, and we’re already working on the next set of improvements to help you make the most of Google’s global network, no matter where your infrastructure might be. You can dive into how to set up Cloud CDN with an external origin or how internet network endpoint groups work in more detail in our Load Balancing documentation. Further, if you’d like to understand the role of the network in infrastructure modernization, read this white paper written by Enterprise Strategy Group (ESG). We’d love your feedback on these features and what else you’d like to see from our hybrid networking portfolio.
Quelle: Google Cloud Platform