How rapid integrated clinical data helps prioritize care for a vulnerable population

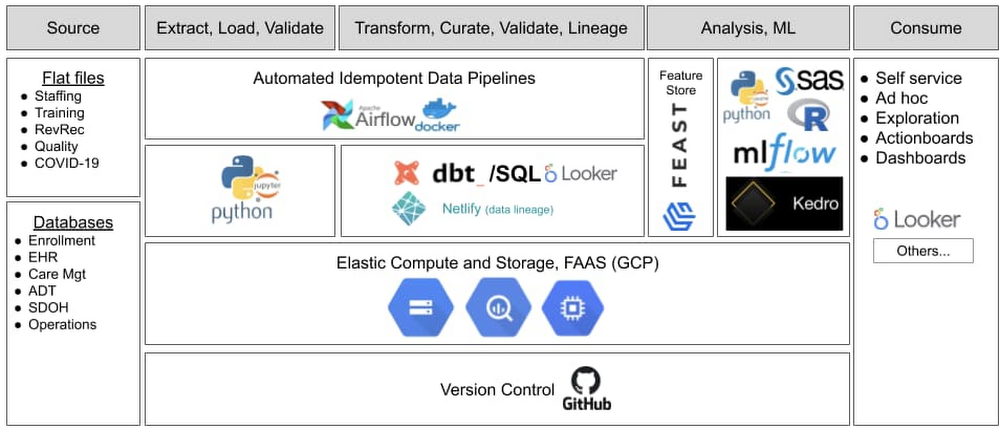
Editor’s note: When the COVID-19 pandemic arrived in the U.S. earlier this year, healthcare organizations had to quickly change or speed up their plans to serve patients. Commonwealth Care Alliance (CCA) used data analytics from Google Cloud to connect clinicians and care managers with high-risk members. Valmeek Kudesia, vice president of clinical informatics and advanced analytics at CCA, shares their story. CCA is a community-based healthcare organization nationally recognized as a leader in providing and coordinating care for high-cost, high-need individuals who are dually eligible for Medicaid and Medicare. CCA integrates the roles of healthcare payor, care management organization, and direct care provider to serve these individuals (known as “members”). Our members live with medical, behavioral health, and social challenges. Many have complicated lives and almost all are vulnerable or marginalized. When news of COVID-19 arrived here in the U.S. last winter, we knew our members would need enhanced levels of care and attention. We needed to deliver on our mission of serving our members while accounting for many new and rapidly changing factors. Our dedicated staff and clinicians needed reliable data that was available quickly and integrated across many domains and sources. We had already put in place an advanced analytics platform with Google Cloud’s BigQuery and Looker. Six months later, we’ve established trust in our data and provide our clinicians with a more holistic view of members’ needs—extending our ability to provide compassion and care to our members, i.e., human-centered use of data and analytics. We will continue to lean upon our data to best serve our members during the upcoming combination of COVID-19 and influenza.Related ArticleData warehouse migration tips: preparation and discoveryIn this post, we’ll explore a few important questions that come up during the initial preparation and discovery phase for data warehouse …Read ArticleThe data required to make decisions fasterThe platform we’d chosen was built for a situation where many users must move fast and in different directions and quickly change what data or information they need. This meant we didn’t have to pivot when COVID-19 arrived. Our data science team used Looker and BigQuery in combination with other technologies (see figure below) to develop and deploy our data ops and ML ops capabilities. All of Google Cloud was available under a single business associate agreement (BAA) to meet HIPAA requirements and BigQuery was (and still is) elastic and available as a service. These two features made it easier for our small data science team to stay focused and move fast, while remaining compliant and enjoy great platform performance.As we used query abstraction and a columnar-based data engine, we discovered an advantage during our response to the COVID-19 pandemic. We had a rapidly increasing number of ways to describe individual “things” combined with very rapid cycles to define “what mattered” at a moment of the day or week. We took advantage of the columnar format to pre-answer as many questions as possible and used straightforward query virtualization to quickly iterate on the idea of what clinicians wanted to see at the speed that they needed to see new or different data. Consequently, we could “move with” clinicians and provide data and predictive insights via general dashboards and role-specific dashboards called action boards. “Action boards” go beyond dashboards—they offer the information needed to help decide which action a clinician will take next, depending on the specific needs of each member. Incorporating daily or even hourly data from various sources was essential to ensure our members got what they needed, whether home-delivered meals, medications, or another service. In some cases, we already had all the required data. For example, in less than 30 minutes, we implemented the CDC’s definition of high-risk for COVID-19 complications in LookML (Looker’s query abstraction layer) and linked the concept “high-risk COVID-19 complications” into our information model. Within a day, we built our main COVID-19 monitoring dashboards and infused relevant pandemic data into other clinical dashboards and action boards. The combination of concept flexibility via abstraction and wide delivery allowed us to quickly identify every member at high risk of a poor COVID-19 outcome and provide that knowledge to their assigned CCA clinicians and integrated care team.Some of the data we needed wasn’t easily accessible—for example, at the time there wasn’t a repository of COVID-19 data or data services on GitHub. But it was essential that we incorporated all needed data to serve all our members—a data-omnivorous approach. In many cases, we had to gather the data ourselves. For example, in the early stages of the COVID-19 pandemic in Massachusetts, adult day health (ADH) centers, community centers that provide critical services for seniors, were closing one-by-one and then abruptly closed en masse. We were able to distribute that knowledge to each member’s assigned CCA clinician action board within minutes of learning of new ADH closings. At a later stage of the COVID-19 pandemic, we started to ingest Massachusetts Department of Public Health data describing test positivity rates to provide insights describing the concentration of high-risk members living in areas with high or escalating COVID-19 risk. The journey from “just data” to “essential for care and support” As the COVID-19 pandemic and its effects continue to evolve, we continually use the latest available information to update and guide our member support and care strategies. Our teams have become more comfortable using data. Typically, we have more than 450 weekly active users and, on average, someone looks at data nearly once every second during the workday. The questions have gotten more interesting and we’re able to ask more about how a piece of data fits, or doesn’t fit, into the member’s bigger picture. Instead of thinking of data as a separate factor, it fades away and becomes part of the surrounding context in which we see the person who is the member—just like how we don’t think specifically about GPS anymore, but rather we focus on the destination. Now the use of data is really built into the way we care for members–it’s part of daily routines. With this kind of reliability, the data science team has moved on to deeper feature engineering and causal inference to enrich the insights delivered to our staff and clinicians. Additionally, our staff and clinicians have come to expect that data can help them take care of vulnerable people. Retrospective for data-informed decisionsThe road to data-informed decision making involves time to build trust in the system. COVID-19 helped solidify that trust and now our clinicians expect data to help toward the care of vulnerable members. We learned that you must build up the ability to quickly iterate to get the data and platform good enough (not perfect) to start being meaningful —and the technology has to allow for that iteration speed. As humans, we see what we know and when people don’t see the big picture or don’t have all the information, they may make near-sighted or counterproductive choices. They can fall into habits or heuristics that reinforce existing problems.Now we’re dealing with human-to-machine interactions as well as human-to-data interactions. When we get it right, we start to incorporate data into our decision making without adding another step. Eventually, it’s just a natural part of the decision process—in this case to take care of a person. For example, evaluation of chest pain frequently requires an electrocardiogram (ECG) interpretation, which encapsulates a large amount of data, and clinicians expect an ECG to help them take better care of the person vs. focusing on the data itself. The COVID-19 pandemic showed us that data used in the right way can extend the human touch and become a therapeutic ally.  You can learn more about CCA in our JOIN@Home session and the full case study.
Quelle: Google Cloud Platform

Scale in at your own pace with Compute Engine autoscaler controls

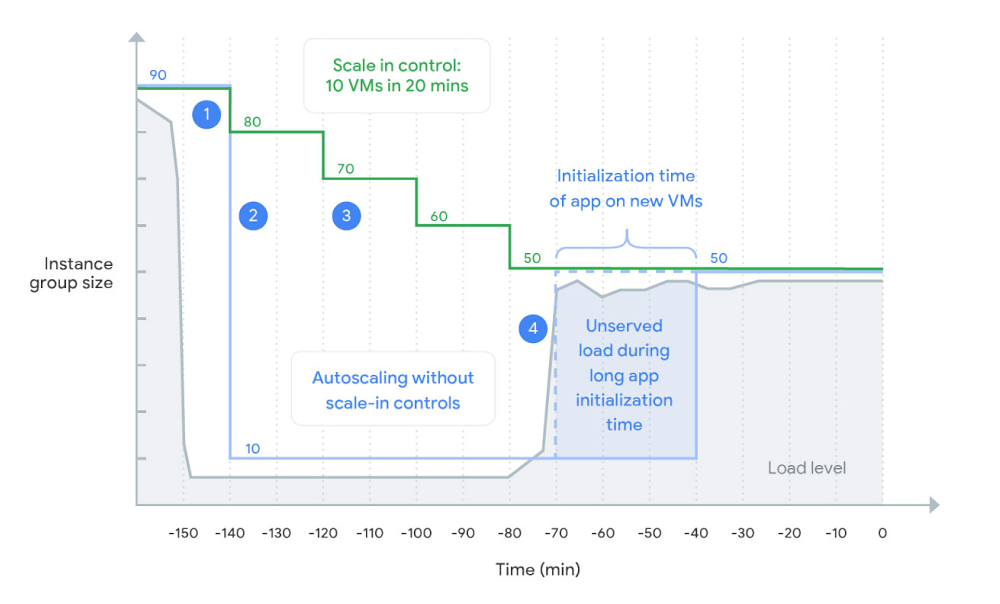
In a Compute Engine environment, managed instance groups (MIGs) offer autoscaling that lets you automatically change an instance group’s capacity based on current load, so you can rightsize your environment—and your costs. Autoscaling adds more virtual machines (VMs) to a MIG when there is more load (scaling out), and deletes VMs when the need for VMs is lesser (scaling in).When load declines, the autoscaler removes all unused capacity. This allows you to save costs but might cause the autoscaler to scale in abruptly. For example, if the load goes down by 50%, the autoscaler removes ~50% of your VMs immediately after a 10-minute stabilization period. Deleting VMs so abruptly might not work well for some workloads. For example, if your VMs take many minutes to initialize you might want to slow down the rate at which you scale in to maintain capacity for imminent load spikes.Introducing scale-in controlsNew scale-in controls in Compute Engine let you limit the VM deletion rate by preventing the autoscaler from reducing a MIG’s size by more VM instances than your workload can tolerate to lose.When you configure autoscaler scale-in controls, you control the speed at which you scale in. The autoscaler never scales in faster than your configured rate, as shown in this diagram:When load declines, the autoscaler maintains the size for the group at a level required to serve the peak load observed in the last 10 minutes (the stabilization period). This works the same with and without scale-in controls.An autoscaler without scale-in controls keeps only enough instances required to handle the recently observed load. After the stabilization period, the autoscaler removes all unneeded instances in one step. A sudden drop in load can lead to a dramatic reduction of instance group size.An autoscaler with scale-in controls limits how many VM instances can be removed in a given period of time (here 10 VMs in 20 minutes). This slows down the instance reduction rate.With the load spikes again, the autoscaler adds new instances. However, because VMs take a long time to initialize, the new VMs aren’t ready to serve the load. With scale-in controls, the previous capacity wasn’t deleted yet, allowing existing VMs to serve the spike.Getting startedYou can set up scale-in controls in the Google Cloud Console. Select an autoscaled MIG from the instance groups page and click Edit group. Under the Autoscaling section, set your scale-in controls:You can also configure scale-in controls programmatically. Here’s the same command written using CLI (gcloud):For more details including configuration using API refer to the documentation.Try scale-in controls todayScale-in controls are generally available across all regions. For more information on how you can control the scale-in rate, check out the docs. Related Article5 best practices for Compute Engine cost optimizationBest practices for saving money on Google Compute EngineRead Article
Quelle: Google Cloud Platform

APIs 101: Everything you need to know about API design

Application programming interfaces, or APIs, are how software talks to other software. They abstract the complexity of underlying systems so the systems can connect in novel ways even if they were never intended to interoperate. Consequently, APIs are key ingredients in both most modern digital experiences and the execution of many of today’s most exciting business opportunities. How much value an API provides, however, involves not only the functionality and data to which the API provides access, but also how the API is designed. Many APIs are designed for integration—that is, as one-off projects that connect systems but do not anticipate future use of the API. The most valuable APIs tend to be designed to make developers’ jobs easier, which typically means designing them with the expectation they’ll be used by other developers in the future. This is designing for consumption. The distinction can significantly impact a business’s efficiency and ability to innovate. APIs designed for consumption make valuable functionality and data reusable, letting developers modularly mix and match different APIs to create new digital experiences or enable new strategies. For goals such as streamlining partner engagement or facilitating participation in digital ecosystems, being able to leverage APIs in this way is crucial. APIs designed for integration, in contrast, may serve the needs of an immediate project but do not help developers do much with the APIs going forward. These APIs may not be designed in ways that future developers will easily understand and may not behave in ways future developers expect. This can lead to the creation of new APIs, adding work and delay that could have been avoided if the older APIs had been designed with broader vision in the first place. How can API designers ensure they’re building APIs that will maximize value and developer productivity? We’ve explored this topic many times in the Google Cloud Blog, and in this post, we offer a collection of some of our most useful API design tips and best practices.Different approaches: REST, RPC, and GraphQLWhat an API even entails can involve different approaches to system interaction and different design norms, so overviewing various API design models is a great starting point. Check out API Design: Understanding gRPC, OpenAPI and REST and When to Use Them, Rest vs. RPC: What Problems are You Trying to Solve with Your APIs?, GraphQL: Building a Consistent Approach for the API Consumer, and Why Your Web APIs Should Be Entity-Oriented to dive in. Holistic API design overviewsFor deep overviews of many API design topics, our ebook API Web Design: The Missing Link: Best Practices for Crafting. Interfaces that Developers Love provides a strong foundation, as does the Google Cloud API Design Guide, which has been used inside Google since 2014 and is the guide Google follows when designing Cloud APIs and other Google APIs. We also encourage you to read API Design Best Practices & Common Pitfalls, which summarizes a wide-ranging Q&A on API design. Specific Challenges and Best Practices Whereas the above articles address numerous broad topics, we’ve also explored many of the more granular and specific API design challenges that can impact an API’s long-term value. For example, APIs are in many ways about defining relationships. In a retailer’s API, the information model might address relationships among entities such as customers, orders, catalog items, carts, and so on. Similarly, a banking API expresses which customer an account belongs to or which account each credit or debit applies to. The most common way that API developers express relationships is to expose database keys, or proxies for them, in the fields of the entities they expose. However, at least for web APIs, that approach has several disadvantages over the alternative: the web link. To learn why, check out API Design: Why You Should use Links, Not Keys, to Represent Relationships in APIs. Similarly, when creating API URLs, it can be confusing — but impactful — to know when to use URLs built around names that are easy for humans to read versus when to use URLs that rely on static numeric identifiers. A bank account, for example, may be difficult to reliably reference if a numeric identifier is not used. Details about the account’s owner are all subject to change (e.g., name, address, marital status), or subject to ambiguity (date and place of birth), or both. Even if we have a reliable identifier for the owner, ownership of the account can change. A static numeric identifier is the most reliable choice—to dig deeper, read API Design: Choosing Between Names and Identifiers in URLs and, for a specific discussion of API design tradeoffs between human readability and system stability, don’t miss The False Dichotomy of URL Design in Web APIs.APIs designed for consumption are essentially software products for developers, which means they may be iterated and improved, just as any software product is. Handling versioning of new APIs can involve some nuances, however, so be sure to peruse API Design: Which Version of Versioning is Right for You? and Common Misconceptions about API Versioning. Finally, APIs can impact how single-page applications are indexed by search engines—so if this sounds pertinent to your business’s needs, our two-part series on API design and SEO might be right up your alley. Doing more with APIsYou’re now well on your way to creating more powerful, user-friendly, and versatile APIs—and because the point of these consumption-focused APIs is partly to facilitate reuse, you’re also on your way to enabling myriad new ways to build richer applications more quickly. To learn even more about how APIs are driving business results, be sure to check out our round-up of API-related topics from Google Cloud Next ‘20: OnAir. We can’t wait to see what you build.Related ArticleNo-code momentum: Accelerating app development and automationLearn why no-code development is gaining momentum and empowering citizen developers to create powerful automations and line-of-business a…Read Article
Quelle: Google Cloud Platform

Meeting the need for speed with a cloud data warehouse

In our work with Google Cloud customers, we hear great stories of growth, change, and cloud success. We worked closely with Trendyol Group, a fast-growing e-commerce company based in Turkey, on their data warehouse migration project. Trendyol employs about 2,000 people, and the company’s e-commerce site gets about 50 billion page views per year, 5 billion visits per year, and 50 million monthly unique users. For this digital-native company, data has been at the heart of their business. Trendyol Group was facing unprecedented growth, and the Trendyol data warehouse (DWH) team had been challenged with the performance and scalability of their existing Vertica data warehouse, especially during the holiday shopping season and other busy retail seasons. Performance issues had become critical over the past 18 months, and had business impact. The DWH team realized that not being able to process data and deliver internal reports and dashboards on time was causing lost revenue and inaccurate supplier management. For example, the business couldn’t react quickly when suppliers made bad decisions or sold a product that didn’t actually have inventory.  The capacity limitations of the on-premises data warehouse forced the IT team to constantly tune performance and plan and scale capacity instead of focusing on business insights. Trendyol’s reporting team serves more than 600 users with roughly 2,000 workbooks and 7,000 views in Tableau. Prior to migration, Trendyol stored over 30 TB of data in their Vertica environment. In addition, there were over 300 slowly changing dimensions (SCDs) in the ETL pipelines, requiring the team to update 10% of the data every day, which led to an 11 TB truncate-insert during the ELT process. The size of the data was weighing down the business. Business users couldn’t meet SLAs for their Monday morning financial reports required by the executives. To meet those busy periods, their IT team had to spend time tuning workloads by killing long-running queries to ensure timely completion of the reports. For example, business users couldn’t run queries that spanned a three-year period for aggregations due to capacity issues; they could only do a one-year time frame. By the time that business users accessed the report, the data was already stale. Then, when Thursdays came and users weren’t running as many queries, the DWH team found themselves with excess capacity. With the impact of COVID-19, Trendyol needed to be able to react quickly and cut off non-compliant products or suppliers to be able to meet the sudden increase in demand. The DWH team knew they needed to auto-scale the workloads in a cost-effective way. They extended their Vertica environment for one more year while they started evaluating cloud data warehousing alternatives. Cloud data warehouse decision criteria The Trendyol team decided to look into a number of vendors, including Snowflake and Google Cloud. Their decision criteria for a cloud data warehouse included:Instant scalability. Given the variability in their analytical workload, this was a critical need so they could have capacity on demand to run the Monday morning reports. Reduced operational costs. Since the retail business is seasonal, Trendyol needed to keep their costs low, in line with demand. Uptime SLAs. Their analytical platform needed to be highly available to meet business needs, especially in these critical times. BigQuery now offers a 99.99% SLA.Backup and recovery. This is important so the team can look back in time, in case there are errors in processing. Security. This is a key requirement for them, since they need to restrict access to personally identifiable information (PII) and sensitive data depending on roles. Ease of use. It was very important that business users could transition to the new cloud data warehouse platform without a learning curve and could be productive immediately.Evaluating cloud data warehousesBigQuery’s comprehensive documentation and simple management interface let the Trendyol team set up BigQuery and fine-tune queries for their proof-of-concept trial. Other data warehouse vendors’ trials required a consultant to optimize and tune the environment. They were able to move the data into BigQuery by themselves and it just worked. They also used BigQuery features like time travel, which met backup and recovery requirements out of the box, and integrated Cloud Identity and Access Management (Cloud IAM) roles that met security requirements easily.The most important feature in BigQuery for Trendyol was the separation of storage and compute, so that they would not have to pay for compute when not in use. Furthermore, it was easy to scale their workload up and down without the need for startup or shutdown time, which other tools required. The DWH team ran through a comprehensive evaluation of alternative data warehouse tools with a variety of benchmarks to represent their main workloads, including ELT, end-to-end BI, integration with BI, and a number of different OLAP queries. BigQuery was the preferred option for price and performance for each of the workloads. Here are three example queries—OLAP-type queries with joins involving a billion rows (Regex, 20+ analytical functions). 1. Ad hoc queries representing power users: Join four tables; high cartesian joins: 632m, 162m, 13m, 23k Regex functions, 2x dist. count2. ELT publish layer with analytical functions: Join five tables; rows: 800m, 13m, 11m, 10m, 360k 20+ analytical functions, first/last_value group by3. Example of publish layer: Join 13 tables (including subqueries), rows: 274m, 262m, 135m, 13m,10x group byTesting results from TrendyolConcurrent queries: BigQuery was the most cost-effective and faster compared to the alternative solution. BigQuery allowed testing increased slots and sharing resources seamlessly across reservations, which wasn’t possible in the alternative solution.DML statements performance: Similar across platforms, including CTAS/updates/inserts, but BigQuery was the most cost-effective. End-to-end runtime: With BI run, BigQuery was faster.Ingestion times: BigQuery was an order of magnitude faster. Data ingestion benchmark: 492 Parquet files with size of 63GB (400 million rows, 50 columns, snappy compressed)ELT’s SCD phase: With one of the largest dimensions, creates more than 2.1 million updates and approximately 1 million inserts.Overall, BigQuery provided the best price for performance, and its predictable flat-rate pricing was key for the decision. In the past, the DWH team had purchased capacity ahead of time, and often thought that it would end up being utilized, but didn’t—creating significant cost and unpredictability. The team would now be able to predict how much capacity they would use at the end of each month. And, the ability to scale up and down in minute intervals with Flex Slots was not available from any other vendor.  Migrating to BigQueryThe Trendyol DWH team separated the migration into three main categories:BI/Tableau migration was done in two weeks. The team changed 50 source tables accessed by 2,000 worksheets and 7,000 weave reports. Since Tableau has a native connection to BigQuery, it was easy to migrate. They used the same table and column names in BigQuery, matching the ones Tableau reports are using, and it just worked. They also avoided using custom SQL in Tableau, eliminating the need to rewrite most of the reports. The team found BigQuery’s ANSI SQL-compliant dialect to be compatible with most of their requirements. Additionally they had some custom SQL with a good amount of regular expressions, which were easily addressed by writing around 10 UDFs. ETL: More than 1,500 ETL jobs are scattered across three tools (Attunity, custom Python scripts, and Kafka Connect). The team has been doing ETL on-prem, and now, in the second phase of the migration, they’ve started migrating ETL to BigQuery.Data: There was 22 TB to start in Vertica that the team moved to BigQuery. They used Attunity for SQL Server and Kafka Connect for cloud-based sources. In addition, custom Python code integrated natively with the BigQuery JDBC driver. Within three months, the team ingested 600 TB into BigQuery, an order of magnitude larger than they had expected.  Currently, the Trendyol team stores 650 TB of data and 300+ SCDs in BigQuery and processes 11 TB of data daily. They mix and match flat-rate, slot reservations, and Flex Slots to get the best pricing at any given time. For example, they can now handle fluctuations in demand by purchasing Flex Slots on an on-demand basis. The data team can now concentrate on creating value rather than spending time on operationalizing the data warehouse. The relationship between the IT and business teams has been transformed, too. There are now plenty of compliments on speed and scalability. The data team can now produce reports in an hour on Monday morning, meeting their SLAs comfortably. The ODS pipeline previously took two to three hours, depending on the day. Trendyol’s BigQuery migration has helped restore trust between the IT and business teams, enable data-driven decision making, save on costs, and meet customer needs quickly. Learn more about Trendyol and about BigQuery’s data warehouse migration program.
Quelle: Google Cloud Platform

Docker and Snyk Extend Partnership to Docker Official and Certified Images

Today we are pleased to announce that Docker and Snyk have extended our existing partnership to bring vulnerability scanning to Docker Official and certified images. As the exclusive scanning partner for these two image categories, Snyk will work with Docker to provide developers with insights into our most popular images. It builds on our previous announcement earlier this year where Snyk scanning was integrated into the Docker Desktop and Docker Hub. This means that developers can now incorporate vulnerability assessment along each step of the container development and deployment process.

Docker Official images represent approximately 25% of all of the pull activity on Docker Hub. Docker Official images are used extensively by millions of developers and developer world wide teams to build and run tens of millions of containerized applications. By integrating vulnerability scanning from Snyk users are now able to get more visibility into the images and have a higher level of confidence that their applications are secure and ready for production.

Docker Official images that have been scanned by Snyk will be available early next year.

You can read more about it from Snyk here and you can catch Docker CEO Scott Johnson and Snyk CEO Peter McKay discuss the partnership during the Snykcon user conference keynote Thursday morning October 22 at 8:30 AM Pacific. You can register for Snykcon at http://bit.ly/SnykConDocker

Additional Resources

Get started with scanning in the desktop nowhttps://www.docker.com/get-started

Learn more about scanning in Docker Hubhttps://goto.docker.com/on-demand-adding-container-security.htmlLearn more about scanning in Docker Desktop https://goto.docker.com/on-demand-find-fix-container-image-vulnerabilities.html
The post Docker and Snyk Extend Partnership to Docker Official and Certified Images appeared first on Docker Blog.
Quelle: https://blog.docker.com/feed/