Deploy GPU workloads across all your clouds with Anthos and NVIDIA

We are very excited to announce a joint solution with NVIDIA now publicly available to all users in beta that allows customers to run NVIDIA GPU workloads on Anthos across hybrid cloud and on-premises environments. Running GPU workloads between cloudsMachine learning is one of the fastest growing application segments in the market today, powering many industries such as biotech, retail, manufacturing and many more. With such unprecedented growth, customers are facing multiple challenges. The first is the difficult choice of where to run your ML and HPC workloads. While the cloud offers elasticity and flexibility for ML workloads, some applications have latency, data size, or even regulatory requirements that mean they need to reside within certain data centers and at edge locations. The other challenge is high demand for on-prem GPU resources; no matter how fast organizations onboard GPU hardware, demand is always greater than supply, so you need to always maximize investment in your GPUs. Organizations are also looking for a hybrid architecture that maximizes both cloud and on-prem resources. In this architecture, bursty, and transient model development and training can run in the cloud, while inference and steady state runtime can be on-prem, or vice versa.Anthos and ML workloadsAnthos was built to enable customers to easily run applications both in the cloud and on-prem. Built on Kubernetes, Anthos’ advanced cluster management and multi-tenancy capabilities allows you to share your ML infrastructure across teams, increasing utilization and reducing the overhead of managing bespoke environments. Anthos also allows you to run applications anywhere, whether they reside on-prem, other cloud providers, or even at the edge. The flexibility of deployment options with Anthos combined with open-source ML frameworks such as Tensorflow and Kubeflow lets you build truly cloud-portable ML solutions and applications.In addition to in-house developed applications, you can use Anthos to deploy Google Cloud’s best-in-class ML services such as Vision AI, Document AI, and many others in your data center and at edge locations, turbocharging ML initiatives in your organizations. Our collaboration with NVIDIAFor this solution, we’ve built on our strong relationship with NVIDIA, a leader in AI/ML acceleration. The solution uses the NVIDIA GPU Operator to deploy GPU drivers and software components required to enable GPUs in Kubernetes. The solution works with many popular NVIDIA data center GPUs such as the V100 and T4. This broad support allows you to take advantage of your existing and future investments in NVIDIA GPUs with Anthos. For more information about supported NVIDIA platforms, please check the NVIDIA GPU Operator documentation. You can also learn more about other Google Cloud and NVIDIA collaborations.Getting startedThis solution is available as beta and will work with Anthos on-prem 1.4 or later. For instructions on getting started using NVIDIA GPUs with Google Cloud’s Anthos and supported NVIDIA GPUs, please refer to the documentation here.
Quelle: Google Cloud Platform

Google Cloud VMware Engine explained: Integrated networking and connectivity

Editor’s note: This the first installment in a new blog series that dives deep into our Google Cloud VMware Engine managed service. Stay tuned for other entries on migration, integration, running stateful database workloads, and enabling remote workers, to name a few.We recently announced the general availability of Google Cloud VMware Engine, a managed VMware platform service that enables enterprises to lift and shift their VMware-based applications to Google Cloud without changes to application architectures, tools or processes. With VMware Engine, you can deploy a private cloud—an isolated VMware stack—that consists of three or more nodes, enabling you to run VMware Cloud Foundation platform natively. This approach lets you retire or extend your data center to the cloud, use the cloud as a disaster recovery target, or migrate and modernize workloads by integrating with cloud-native services such as BigQuery, Cloud AI, etc.But before you can do that, you need easy-to-provision, high-performance, highly available networking to connect between:On-premises data centers and the cloudVMware workloads and cloud-native servicesVMware private clouds in single or multi-region deployments.Google Cloud VMware Engine networking leverages existing connectivity services for on-premises connections and provides seamless connectivity to other Google Cloud services. Furthermore, the service is built on high-performance, reliable and high-capacity infrastructure, giving you a fast and highly available VMware experience, at a low cost.Let’s take a closer look at some of the networking features you’ll find on VMware Engine. High Availability and 100G throughputGoogle Cloud VMware Engine private clouds are deployed on enterprise-grade infrastructure with redundant and dedicated 100Gbps networking that provides 99.99% availability, low latency and high throughput.Integrated networking and on-prem connectivity Subnets associated with private clouds are allocated in Google Cloud VPCs and delegated to VMware Engine. As a result, Compute Engine instances in the VPC communicate with VMware workloads using RFC 1918 private addresses, with no need for External IP-based addressing. Private clouds can be accessed from on-prem using existing Cloud VPN or Cloud Interconnect-based connections to Google Cloud VPCs without additional VPN or Interconnect attachments to VMware Engine private clouds. You can also stretch your on-prem networks to VMware Engine to facilitate workload migration.Furthermore, for internet access, you can choose to use VMware Engine’s internet access service or route internet-bound traffic from on-prem to meet your security or regulatory needs.Access to Google Cloud services from VMware Engine private cloudsVMware Engine workloads can access other Google Cloud services such as Cloud SQL, Cloud Storage, etc., using options such as Private Google Access and Private Service Access. Just like a Compute Engine instance in a VPC, a VMware workload can use private access options to communicate with Google Cloud services while staying within a secure and trusted Google Cloud network boundary. As such, you don’t need to exit out to the public internet to access Google Cloud services from VMware Engine, regardless of whether internet access is enabled or disabled. This provides for low-latency and secure communication between VMware Engine and other Google Cloud services.Multi-region connectivity between VMware private clouds VMware workloads in private clouds in the same region can talk to one another directly—without needing to “trombone” or “hairpin” across the Google Cloud VPCs. In the case where VMware workloads need to communicate with one another across regions, they can do so using VMware Engine’s global routing service. This approach to multi-region connectivity doesn’t require a VPN, or any other latency-inducing connectivity options. Access to full NSX-T functionalityVMware Engine supports full NSX-T functionality for VMware workloads. With this, you can use VMware’s NSX-T policy-based UI or API to create network segments, gateway firewall policies or distributed/east-west firewall policies. In addition, you can also leverage NSX-T’s load balancer, NAT and service insertion functionality. Networking is critical to any Enterprise’s cloud transformation journey—even more so for VMware-related use cases. The networking functionality in VMware Engine makes it easy for you to take advantage of the scale, flexibility and agility that Google Cloud provides without compromising on functionality.What’s nextIn the coming weeks, we’ll share more about VMware Engine and migration, building business resiliency, enabling work from anywhere, and your enterprise database options. To learn more or to get started, visit the VMware Engine website where you’ll find detailed information on key features, use cases, product documentation, and pricing.
Quelle: Google Cloud Platform

App modernization enabled this retail solution provider to converge physical and digital commerce

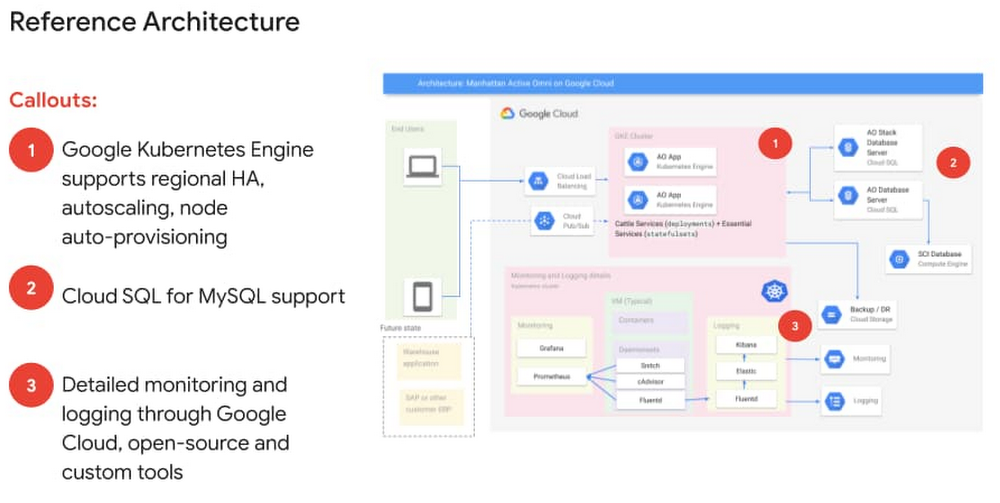
As Google Cloud CEO Thomas Kurian said earlier this year, digital transformation in the retail industry is more than just a requirement, it’s a race, and the retailers that transform the fastest will be the most successful in the long term. COVID-19’s impact on the retail industry has only exacerbated this challenge, forcing retailers to rapidly marry digital and physical experiences by offering services such as curbside pickups and contactless check-out.Long before 2020, Manhattan Associates, a leader in supply chain, inventory and omnichannel e-commerce technology, recognized retailers needed a platform that could help them adapt to changing market conditions and bridge the gap from brick and mortar to digital commerce. As a result, they launched the Manhattan Active Solutions portfolio for their customers in retail, manufacturing, and distribution. Solutions like Manhattan Active Warehouse Management, the cloud-native version of their flagship warehouse management system, and Manhattan Active Omni, a suite of cloud-based inventory management, point-of-sale, and customer engagement tools, are versionless so customers get continuous access to the latest features, with automated scaling for peak demand. But for Manhattan Associates to deliver their vision to make their solutions portfolio versionless, agile, scalable, and extensible, they first needed to modernize their application environment. They knew lifting and shifting a monolithic architecture to the cloud would not deliver the level of agility that they—and their end-customers—would need, so they decided to go with microservices. Consequently, they re-architected Manhattan Active Warehouse Management and Manhattan Active Omni from the ground up to take full advantage of the benefits of the cloud.Guiding principles behind Manhattan Associates cloud-native approachFirst, Manhattan Associates established some critical architectural principles to serve as their north star for cloud-native application design. These guiding principles, as outlined below, were created to help ensure Manhattan Associates solutions could deliver the engineering velocity demanded by their end-customers while also aiming to reduce the cost of innovation.Speed of innovation: Manhattan Associates strove to adopt a microservices-based, cloud-native approach so they could deliver new functionality faster than their competitors, and faster than they themselves had previously done. Extensibility: In addition to accelerating innovation in house, they also sought to ensure an open and extensible ecosystem so that their customers and partners can easily build and integrate additional capabilities without dependence on Manhattan Associates.Flexibility: With these managed SaaS versions of their flagship products, Manhattan Associates needed the flexibility to scale performance and resources based on their end-customers’ needs.Low cost of innovation: Finally, Manhattan Associates required the ability to leverage open-source technologies for portability and to avoid vendor lock-in. In addition, they required detailed logging and monitoring tools in order to maintain control over costs.Partnering with Google Cloud to meet business objectivesIn order to deliver on the imperatives outlined above, Manhattan Associates teamed with Google Cloud as their cloud platform. Here’s a quick look at how they are leveraging key Google Cloud services to help meet the objectives laid out in their guiding principles.Achieving agility, scalability, and resiliency with Google Kubernetes Engine: Manhattan Associates built on top of their already extensive Kubernetes experience and took advantage of Google Kubernetes Engine managed features such as regional high availability, autoscaling, node auto-provisioning, and the auto-repair functionality to help ensure scalability and resiliency for their containerized workloads.Gaining ease of use and openness with Cloud SQL for MySQL: Manhattan Associates team members were also long-time users of MySQL. With Cloud SQL for MySQL, they were able to continue using open-source software to run managed MySQL databases. In addition, Manhattan Associates could leverage Cloud SQL to support their environment setup and their customer needs. For instance, they can create a Cloud SQL database instance per project. And each project can correspond with an environment, like dev/test and production or with a specific customer. They also have the flexibility to support optional add-ons for each customer like additional database instances for high availability.Visibility and control with detailed monitoring and logging: Finally, Manhattan Associates demanded very detailed monitoring and logging to help ensure customer environments were running effectively across the stack. They leveraged a combination of open-source, custom and Google Cloud tools like Cloud Logging, Cloud Monitoring, and CloudRun as well as in-house tools to keep tabs on their environments and trigger alerts so that Manhattan Associates teams can take action when needed.As a result, Manhattan Associates was able to deliver a truly cloud-native warehouse management and unified commerce platform, built using microservices. They have been delivering on their goal of engineering velocity; releasing features quarterly versus annually as was the case on their prior monolithic architecture. More importantly, they can pass this speed of innovation on to their end-customers.To learn more about how Manhattan Associates rebuilt their platform in the cloud, check out the Manhattan Active Warehouse Management andManhattan Active Omni on Google Cloud virtual breakout sessions at Manhattan Associates’ digital event, Momentum Connect. In these sessions, they’ll dive into more detail behind their cloud native approach, their use cases, and how they combined Google Cloud, open-source, and home-grown tools to bring their Manhattan Active Warehouse Management and Manhattan Active Omni solutions to market.
Quelle: Google Cloud Platform

Build resilient applications with Kubernetes on Azure

Welcome to KubeCon EU 2020, the virtual edition. While we won’t be able to see each other in person at KubeCon EU this year, we're excited that this new virtual format of KubeCon will make the conference more accessible than ever, with more people from the amazing Kubernetes community able to join and participate from around the world without leaving their homes.

With everything that has been happening, the last year has been an up and down experience, but through it all I’m incredibly proud of the focus and dedication from the Azure Kubernetes team. They have continued to iterate and improve our Kubernetes on Azure that provides enterprise-grade experience for our customers.

Kubernetes on Azure (and indeed anywhere) delivers an open and portable ecosystem for cloud-native development. In addition to this core promise, we also deliver a unique enterprise-grade experience that ensures the reliability and security your workloads demand, while also enabling the agility and efficiency that business today desires. You can securely deploy any workload to Azure Kubernetes Service (AKS) to drive cost-savings at scale across your business. Today, we're going to tell you about even more capabilities that can help you along on your cloud-native journey to Kubernetes on Azure.

Improving latency and operational efficiency

One of the key drivers of cloud adoption is reducing latency. It used to be that it took days to get physical computers and set them up in a cluster. Today, you can deploy a Kubernetes cluster on Azure in less than five minutes. These improvements benefit the agility of our customers. For customers who want to scale and provision faster, we are announcing a preview of ephemeral OS disk support which makes responding to new compute demands on your cluster even faster.

Latency isn’t just about the length of time to create a cluster. It’s also about how fast you can detect and respond to operational problems. To help enterprises improve their operational efficiency, we’re announcing preview integration with Azure Resource Health which can alert you if your cluster is unhealthy for any reason. We’re also announcing the general availability of node image updates which allow you to upgrade the underlying operating system to respond to bugs or vulnerabilities in your cluster while staying on the same Kubernetes version for stability.

Finally, though Kubernetes has always enabled enterprises to drive cost savings through containerization, the new economic realities of the world during a pandemic mean that achieving cost efficiency for your business is more important than ever. We’ve got a great exercise that can help you learn how to optimize your costs using containers and the Azure Kubernetes Service.

Secure by design with Kubernetes on Azure

One of the key pillars of any enterprise computing platform is security. With market-leading features like policy integration and Azure Active Directory identity for Pods and cloud-native security have always been an important part of the Azure Kubernetes Service. I’m excited about some new features we’ve added recently to further enhance the security of your workloads running on Kubernetes.

Though Kubernetes has built-in support for secrets, most enterprise environments require a more secure and more compliant implementation. In the Azure Kubernetes Service, being enterprise-grade means providing integration between Azure Key Vault and the Azure Kubernetes service. Using Key Vault with Kubernetes enables you to securely store your credentials, certificates, and other secrets in state of the art, compliant secret store, and easily use them with your applications in an Azure Kubernetes cluster.

It’s even more exciting that this integration is built on the back of an open Container Storage Interface (CSI) driver that the Azure team built and open sourced for the entire Kubernetes community. Giving back to open source is an important part of what it means to be a community steward, and it was exciting to see our approach get validated as it was picked up and used by the HashiCorp Vault team for their secrets integration. Our open source team has been hard at work on improving many other parts of the security ecosystem. We’ve enhanced the CSI driver for Windows, and worked on cgroups v2 and containerd. If you want to learn more about how to secure your cloud-native workloads and make sure that your enterprise is following Microsoft’s best practices, check out our guide to Kubernetes best practices. They will teach you how to integrate firewalls, policy, and more to ensure you have both security and agility in your cloud-native development.

Next steps and KubeCon EU

I hope that you have an awesome KubeCon EU. As you go through the conference and learn more about Kubernetes, you can also learn more about Kubernetes on Azure with all of the great information online and in our virtual booth. If you’re new to KubeCon and Kubernetes and wondering how you can adopt Kubernetes for workloads from hobbyist to enterprise, we’ve got a great Kubernetes adoption guide for you.
Quelle: Azure

Advancing the outage experience—automation, communication, and transparency

“Service incidents like outages are an unfortunate inevitability of the technology industry. Of course, we are constantly improving the reliability of the Microsoft Azure cloud platform. We meet and exceed our Service Level Agreements (SLAs) for the vast majority of customers and continue to invest in evolving tools and training that make it easy for you to design and operate mission-critical systems with confidence.

In spite of these efforts, we acknowledge the unfortunate reality that—given the scale of our operations and the pace of change—we will never be able to avoid outages entirely. During these times we endeavor to be as open and transparent as possible to ensure that all impacted customers and partners understand what’s happening. As part of our Advancing Reliability blog series, I asked Sami Kubba, Principal Program Manager overseeing our outage communications process, to outline the investments we’re making to continue improving this experience.”—Mark Russinovich, CTO, Azure


In the cloud industry, we have a commitment to bring our customers the latest technology at scale, keeping customers and our platform secure, and ensuring that our customer experience is always optimal. For this to happen Azure is subject to a significant amount of change—and in rare circumstances, it is this change that can bring about unintended impact for our customers. As previously mentioned in this series of blog posts we take change very seriously and ensure that we have a systematic and phased approach to implementing changes as carefully as possible.

We continue to identify the inherent (and sometimes subtle) imperfections in the complex ways that our architectural designs, operational processes, hardware issues, software flaws, and human factors can align to cause service incidents—also known as outages. The reality of our industry is that impact caused by change is an intrinsic problem. When we think about outage communications we tend not to think of our competition as being other cloud providers, but rather the on-premises environment. On-premises change windows are controlled by administrators. They choose the best time to invoke any change, manage and monitor the risks, and roll it back if failures are observed.

Similarly, when an outage occurs in an on-premises environment, customers and users feel that they are more ‘in the know.’ Leadership is promptly made fully aware of the outage, they get access to support for troubleshooting, and expect that their team or partner company would be in a position to provide a full Post Incident Report (PIR)—previously called Root Cause Analysis (RCA)—once the issue is understood. Although our data analysis supports the hypothesis that time to mitigate an incident is faster in the cloud than on-premises, cloud outages can feel more stressful for customers when it comes to understanding the issue and what they can do about it.

Introducing our communications principles

During cloud outages, some customers have historically reported feeling as though they’re not promptly informed, or that they miss necessary updates and therefore lack a full understanding of what happened and what is being done to prevent future issues occurring. Based on these perceptions, we now operate by five pillars that guide our communications strategy—all of which have influenced our Azure Service Health experience in the Azure portal and include:

Speed
Granularity
Discoverability
Parity
Transparency

Speed

We must notify impacted customers as quickly as possible. This is our key objective around outage communications. Our goal is to notify all impacted Azure subscriptions within 15 minutes of an outage. We know that we can’t achieve this with human beings alone. By the time an engineer is engaged to investigate a monitoring alert to confirm impact (let alone engaging the right engineers to mitigate it, in what can be a complicated array of interconnectivities including third-party dependencies) too much time has passed. Any delay in communications leaves customers asking, “Is it me or is it Azure?” Customers can then spend needless time troubleshooting their own environments. Conversely, if we decide to err on the side of caution and communicate every time we suspect any potential customer impact, our customers could receive too many false positives. More importantly, if they are having an issue with their own environment, they could easily attribute these unrelated issues to a false alarm being sent by the platform. It is critical that we make investments that enable our communications to be both fast and accurate.

Last month, we outlined our continued investment in advancing Azure service quality with artificial intelligence: AIOps. This includes working towards improving automatic detection, engagement, and mitigation of cloud outages. Elements of this broader AIOps program are already being used in production to notify customers of outages that may be impacting their resources. These automatic notifications represented more than half of our outage communications in the last quarter. For many Azure services, automatic notifications are being sent in less than 10 minutes to impacted customers via Service Health—to be accessed in the Azure portal, or to trigger Service Health alerts that have been configured, more on this below.

With our investment in this area already improving the customer experience, we will continue to expand the scenarios in which we can notify customers in less than 15 minutes from the impact start time, all without the need for humans to confirm customer impact. We are also in the early stages of expanding our use of AI-based operations to identify related impacted services automatically and, upon mitigation, send resolution communications (for supported scenarios) as quickly as possible.

Granularity

We understand that when an outage causes impact, customers need to understand exactly which of their resources are impacted. One of the key building blocks in getting the health of specific resources are Resource Health signals. The Resource Health signal will check if a resource, such as a virtual machine (VM), SQL database, or storage account, is in a healthy state. Customers can also create Resource Health alerts, which leverage Azure Monitor, to let the right people know if a particular resource is having issues, regardless of whether it is a platform-wide issue or not. This is important to note: a Resource Health alert can be triggered due to a resource becoming unhealthy (for example, if the VM is rebooted from within the guest) which is not necessarily related to a platform event, like an outage. Customers can see the associated Resource Health checks, arranged by resource type.

We are building on this technology to augment and correlate each customer resource(s) that has moved into an unhealthy state with platform outages, all within Service Health. We are also investigating how we can include the impacted resources in our communication payloads, so that customers won’t necessarily need to sign in to Service Health to understand the impacted resources—of course, everyone should be able to consume this programmatically.

All of this will allow customers with large numbers of resources to know more precisely which of their services are impacted due to an outage, without having to conduct an investigation on their side. More importantly, customers can build alerts and trigger responses to these resource health alerts using native integrations to Logic Apps and Azure Functions.

Discoverability

Although we support both ‘push’ and ‘pull’ approaches for outage communications, we encourage customers to configure relevant alerts, so the right information is automatically pushed out to the right people and systems. Our customers and partners should not have to go searching to see if the resources they care about are impacted by an outage—they should be able to consume the notifications we send (in the medium of their choice) and react to them as appropriate. Despite this, we constantly find that customers visit the Azure Status page to determine the health of services on Azure.

Before the introduction of the authenticated in-portal Service Health experience, the Status page was the only way to discover known platform issues. These days, this public Status page is only used to communicate widespread outages (for example, impacting multiple regions and/or multiple services) so customers looking for potential issues impacting them don’t see the full story here. Since we rollout platform changes as safely as possible, the vast majority of issues like outages only impact a very small ‘blast radius’ of customer subscriptions. For these incidents, which make up more than 95 percent of our incidents, we communicate directly to impacted customers in-portal via Service Health.

We also recently integrated the ‘Emerging Issues’ feature into Service Health. This means that if we have an incident on the public Status page, and we have yet to identify and communicate to impacted customers, users can see this same information in-portal through Service Health, thereby receiving all relevant information without having to visit the Status page. We are encouraging all Azure users to make Service Health their ‘one stop shop’ for information related to service incidents, so they can see issues impacting them, understand which of their subscriptions and resources are impacted, and avoid the risk of making a false correlation, such as when an incident is posted on the Status page, but is not impacting them.

Most importantly, since we’re talking about the discoverability principle, from within Service Health customers can create Service Health alerts, which are push notifications leveraging the integration with Azure Monitor. This way, customers and partners can configure relevant notifications based on who needs to receive them and how they would best be notified—including by email, SMS, LogicApp, and/or through a webhook that can be integrated into service management tools like ServiceNow, PagerDuty, or Ops Genie.

To get started with simple alerts, consider routing all notifications to email a single distribution list. To take it to the next level, consider configuring different service health alerts for different use cases—maybe all production issues notify ServiceNow, maybe dev and test or pre-production issues might just email the relevant developer team, maybe any issue with a certain subscription also sends a text message to key people. All of this is completely customizable, to ensure that the right people are notified in the right way.

Parity

All Azure users should know that Service Health is the one place to go, for all service impacting events. First, we ensure that this experience is consistent across all our different Azure Services, each using Service Health to communicate any issues. As simple as this sounds, we are still navigating through some unique scenarios that make this complex. For example, most people using Azure DevOps don’t interact with the Azure portal. Since DevOps does not have its own authenticated Service Health experience, we can’t communicate updates directly to impacted customers for small DevOps outages that don’t justify going to the public Status page. To support scenarios like this, we have stood up the Azure DevOps status page where smaller scale DevOps outages can be communicated directly to the DevOps community.

Second, the Service Health experience is designed to communicate all impacting events across Azure—this includes maintenance events as well as service or feature retirements, and includes both widespread outages and isolated hiccups that only impact a single subscription. It is imperative that for any impact (whether it is potential, actual or upcoming) customers can expect the same experience and put in place a predictable action plan across all of their services on Azure.

Lastly, we are working towards expanding our philosophy of this pillar to extend to other Microsoft cloud products. We acknowledge that, at times, navigating through our different cloud products such as Azure, Microsoft 365, and Power Platform can sometimes feel like navigating technologies from three different companies. As we look to the future, we are invested in harmonizing across these products to bring about a more consistent, best-in-class experience.

Transparency

As we have mentioned many times in the Advancing Reliability blog series, we know that trust is earned and needs to be maintained. When it comes to outages, we know that being transparent about what is happening, what we know, and what we don’t know is critically important. The cloud shouldn’t feel like a black box. During service issues, we provide regular communications to all impacted customers and partners. Often, in the early stages of investigating an issue, these updates might not seem detailed until we learn more about what’s happening. Even though we are committed to sharing tangible updates, we generally try to avoid sharing speculation, since we know customers make business decisions based on these updates during outages.

In addition, an outage is not over once customer impact is mitigated. We could still be learning about the complexities of what led to the issue, so sometimes the message sent at or after mitigation is a fairly rudimentary summation of what happened. For major incidents, we follow this up with a PIR generally within three days, once the contributing factors are better understood.

For incidents that may have impacted fewer subscriptions, our customers and partners can request more information from within Service Health by requesting a PIR for the incident. We have heard feedback in the past that PIRs should be even more transparent, so we continue to encourage our incident managers and communications managers to provide as much detail as possible—including information about the issue impact, and our next steps to mitigate future risk. Ideally to ensure that this class of issue is less likely and/or less impactful moving forward.

While our industry will never be completely immune to service outages, we do take every opportunity to look at what happened from a holistic perspective and share our learnings. One of the future areas of investment at which we are looking closely, is how best to keep customers updated with the progress we are making on the commitments outlined in our PIR next steps. By linking our internal repair items to our external commitments in our next steps, customers and partners will be able to track the progress that our engineering teams are making to ensure that corrective actions are completed.

Our communications across all of these scenarios (outages, maintenance, service retirements, and health advisories) will continue to evolve, as we learn more and continue investing in programs that support these five pillars.

Reliability is a shared responsibility

While Microsoft is responsible for the reliability of the Azure platform itself, our customers and partners are responsible for the reliability of their cloud applications—including using architectural best practices based on the requirements of each workload. Building a reliable application in the cloud is different from traditional application development. Historically, customers may have purchased levels of redundant higher-end hardware to minimize the chance of an entire application platform failing. In the cloud, we acknowledge up front that failures will happen. As outlined several times above, we will never be able to prevent all outages. In addition to Microsoft trying to prevent failures, when building reliable applications in the cloud your goal should be to minimize the effects of any single failing component.

To that end, we recently launched the Microsoft Azure Well-Architected Framework—a set of guiding tenets that can be used to improve the quality of a workload. Reliability is one of the five pillars of architectural excellence alongside Cost Optimization, Operational Excellence, Performance Efficiency, and Security. If you already have a workload running in Azure and would like to assess your alignment to best practices in one or more of these areas, try the Microsoft Azure Well-Architected Review.

Specifically, the Reliability pillar describes six steps for building a reliable Azure application. Define availability and recovery requirements based on decomposed workloads and business needs. Use architectural best practices to identify possible failure points in your proposed/existing architecture and determine how the application will respond to failure. Test with simulations and forced failovers to test both detection and recovery from various failures. Deploy the application consistently using reliable and repeatable processes. Monitor application health to detect failures, monitor indicators of potential failures, and gauge the health of your applications. Finally, respond to failures and disasters by determining how best to address it based on established strategies.

Returning to our core topic of outage communications, we are working to incorporate relevant Well-Architected guidance into our PIRs in the aftermath of each service incident. Customers running critical workloads will be able to learn about specific steps to improve reliability that would have helped to avoid and lessen impact from that particular outage. For example, if an outage only impacted resources within a single Availability Zone, we will call this out as part of the PIRs and encourage impacted customers to consider zonal redundancies for their critical workloads.

Going forward

We outlined how Azure approaches communications during and after service incidents like outages. We want to be transparent about our five communication pillars, to explain both our progress to date and the areas in which we’re continuing to invest. Just as our engineering teams endeavor to learn from each incident to improve the reliability of the platform, our communications teams endeavor to learn from each incident to be more transparent, to get customers and partners the right details to make informed decisions, and to support customers and partners as best as possible during each of these difficult situations.

We are confident that we are making the right investments to continuing improving in this space, but we are increasingly looking for feedback on whether our communications are hitting the mark. We include an Azure post-incident survey at the end of each PIR we publish. We strive to review every response to learn from our customers and partners and validate whether we are focusing on the right areas and to keep improving the experience.

We continue to identify the inherent (and sometimes subtle) imperfections in the complex ways that our architectural designs, operational processes, hardware issues, software flaws, and human factors align to cause outages. Since trust is earned and needs to be maintained, we are committed to being as transparent as possible—especially during these infrequent but inevitable service issues.
Quelle: Azure
Deploying a Minecraft Docker Server to the cloud

One of the simplest examples that people have used over the years of demoing Docker is quickly standing up and running a Minecraft server. This shows the power of using Docker and has a pretty practical application!

Recently I wanted to set up a server but I wanted to persist one and as I have given away my last raspberry pi I needed to find a new way to do this. I decided that I would have a go at running this in Azure using the $200 free credits you get in your first month.

The first thing I decided to do was to check out the existing Docker Images for Minecraft servers to see if there were any that looked good to use, to do this I went to Docker Hub and searched for minecraft:

I liked the look of minecraft-server repo, so I clicked through to have a look at the image and link through to the Github repo.

To start I decide to just test out running this locally on my machine with the ‘simple get started’ Docker Run command:

$ docker run -d -p 25565:25565 –name mc -e EULA=TRUE
itzg/minecraft-server

In the Docker Desktop Dashboard, I can see I have the container running and check the server logs to make sure everything has been initialized properly:

If I load up Minecraft I can connect to my server using local host and my open port: 

From there, I can try to deploy this in Azure to just get my basic server running in the cloud. 

With the Docker ACI integration, I can log into Azure using: 

$ docker login azure

Once logged in, I can create a context that will let me deploy containers to an Azure resource group (this proposes to create a new azure resource group or use an existing one): 

$ docker context create aci acicontext
Using only available subscription : My subscription (xxx)
? Select a resource group [Use arrows to move, type to filter]
> create a new resource group
gtardif (westeurope)

I can then use this new context : 

$ docker context use acicontext

I will now try to deploy my minecraft server using the exact same command I ran previously locally :

$ docker run -d -p 25565:25565 –name mc -e EULA=TRUE itzg/minecraft-server
[+] Running 2/2
⠿ Group mc Created 4.6s
⠿ mc Done 36.4s
mc

Listing my azure containers, I’ll see the public IP that has been provided for my Minecraft server:

$ docker ps
CONTAINER ID IMAGE COMMAND STATUS PORTS
mc itzg/minecraft-server Running 51.105.116.56:25565->25565/tcp

However, if I follow the logs of the ACI container, the server seems to be stuck in the initialization, and I cannot connect to it from Minecraft. 

$ docker logs –follow mc

In the logs we see the Minecraft server reserves 1G of memory, which happens to be the default memory allocated to the entire container by ACI ; let’s increase a bit the ACI limit with the –memory option : 

$ docker run -d –memory 1.5G -p 25565:25565 –name mc -e EULA=TRUE
itzg/minecraft-server

The server logs from ACI now show that the server initialized properly. I can run $ docker ps again to get the public IP of my container, and connect to it from Minecraft and start playing ! 

This is great, but now I want to find a way to make sure my data persists and reduce the length of the command I need to use to run the server.

To do this I will use a Compose file to document the command I am using, and next I will add a volume to this that I can mount my data to. 

version: ‘3.7’
services:
minecraft:
image: itzg/minecraft-server
ports:
– "25565:25565"
environment:
EULA: "TRUE"
deploy:
resources:
limits:
memory: 1.5G

Looking at our command from before we have moved our image name into the image section, our -p for ports into the ports and added our EULA acceptance into the environment variables. We also ensure the server container has enough memory to start.

The command to start this locally is now much simpler:

$ docker-compose –project-name mc up

And to deploy to ACI, still using the ACI context I created previously: 

$ docker compose –project-name mc2 up
[+] Running 2/2
⠿ Group mc2 Created 6.7s
⠿ minecraft Done 51.7s

Of course with compose, this allows the compose application to include multiple containers (here we only have the “minecraft” one). The containers are visible in the progress display (here the “minecraft” line).And listing the containers shows the application name and the container name mc2_minecraft : 

$ docker ps
CONTAINER ID IMAGE COMMAND STATUS PORTS
mc itzg/minecraft-server Running 20.50.245.84:25565->25565/tcp
mc2_minecraft itzg/minecraft-server Running 40.74.20.143:25565->25565/tcp

Next we will want to add a volume to include our Minecraft data and where we can load in other maps if we want. To do this I need to know what folder has the Minecraft data in the Docker image, if I go and inspect our running container in the Docker Dashboard I can see that it is the /Data directory:

If I wanted to add this back in my command line I would need to extend my command with something like:

docker run -d -p 25565:25565 –v /path/on/host:/data –name mc -e
EULA=TRUE itzg/minecraft-server

I can add this under the volumes in my Compose file: 

version: ‘3.7’
services:
minecraft:
image: itzg/minecraft-server
ports:
– "25565:25565"
environment:
EULA: "TRUE"
deploy:
resources:
limits:
memory: 1.5G
volumes:
– "~/tmp/minecraft_data:/data"

Now when I do a docker compose up and come back to inspect I can see the /data folder in the container is now mounted to my local folder as expected. Navigating to this local folder I can see all Minecraft data.

Now let’s create an Azure File Share and deploy our application to mount /data to the Azure shared persistent folder so we can do the same thing in ACI. 

First I need to create an Azure storage account. We can do this using the Azure “az” command line, or through the Azure portal, I have decided to use the portal : 

I need to specify a name for the storage account, select the resource group to attach to it, then I let the other options default for this example. 

Once the ”minecraftdocker” storage account is created, I’ll create a file share that will hold all Minecraft files: 

I just need to specify a name for this file share and a size quota ; let’s call it “minecraft-volume”:

I’ll need to specify an access key to reference that in my compose file, I can get the storage account access key in the left hand side menu, Settings > Access keys. 

Then in my compose file, I’ll update the volume specification to point to this Azure File Share:

version: ‘3.7’
services:
minecraft:
image: itzg/minecraft-server
ports:
– "25565:25565"
environment:
EULA: "TRUE"
deploy:
resources:
limits:
memory: 1.5G
volumes:
– "minecraft:/data"
volumes:
minecraft:
driver: azure_file
driver_opts:
share_name: minecraftdocker
storage_account_name: minecraft-volume
storage_account_key: xxxxxxx

Note that the syntax for specifying ACI volumes in Compose files is likely to change in the future.

I can then redeploy my compose application to ACI, still with the same command line as before:

$ docker –context acitest compose –project-name minecraft up
[+] Running 2/2
⠿ Group minecraft Created 5.3s
⠿ minecraft Done 56.4s

And I can check it’s using the Azure File Share, just selecting the minecraft-volume Share in the Azure portal:

I can connect again to my server from Minecraft, share the server address and enjoy the game with friends!

To get started running your own Minecraft server you can download the latest Edge version of Docker Desktop. You can find the Minecraft image we used on Docker Hub, or start creating your own content from Dockers Official images.  Or if you want to create content like this to share, create a Docker account and start sharing your ideas in your public repos. 
The post Deploying a Minecraft Docker Server to the cloud appeared first on Docker Blog.
Quelle: https://blog.docker.com/feed/

10 Years of OpenStack – Fu Qiao at China Mobile

Storytelling is one of the most powerful means to influence, teach, and inspire the people around us. To celebrate OpenStack’s 10th anniversary, we are spotlighting stories from the individuals in various roles from the community who have helped to make OpenStack and the global Open Infrastructure community successful.  Here, we’re talking to Fu Qiao from… Read more »
Quelle: openstack.org






