High-resolution user-defined metrics in Cloud Monitoring

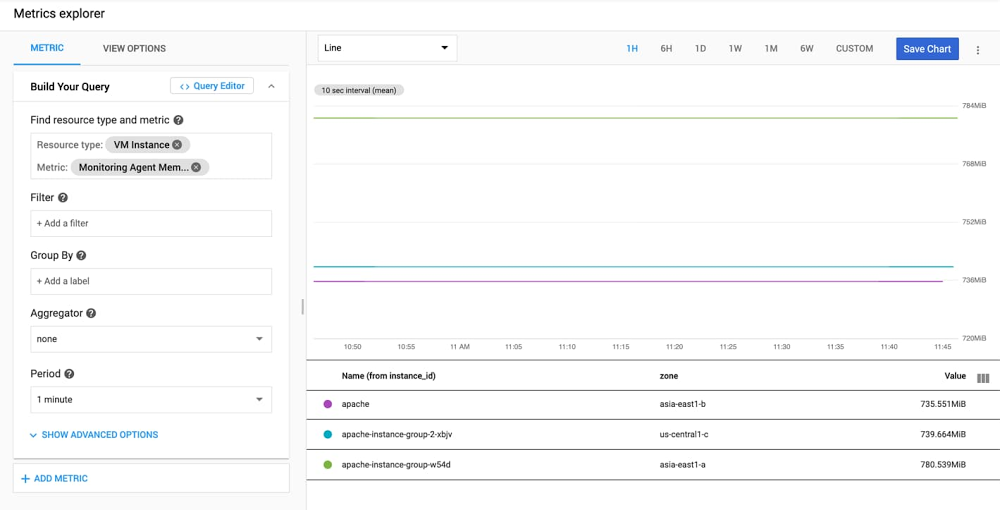
Higher resolution metrics are critical for monitoring dynamically changing environments and rapidly changing application metrics. Examples where high resolution metrics are critical include high volume e-commerce, live streaming, autoscaling bursty workloads on Kubernetes clusters, and more. Higher resolutioncustom, Prometheus, and agent metrics are now generally available, and can be written at a granularity of 10 seconds. Previously these metric types could only be written once every 60 seconds. How to write Monitoring agent metrics at 10-second resolutionThe Cloud Monitoring agent is a collectd-based daemon that collects system and application metrics from virtual machine instances and sends them to Cloud Monitoring. The Monitoring agent collects disk, CPU, network, and process metrics. By default, agent metrics are written at 60-second granularity. You can modify the agent collectd.conf configuration to send metrics at 10-second granularity by changing the Interval value to ‘10’ in the Monitoring agent’s collectd.conf file.After making this change, you will need to restart your agent (this may differ based on your operating system and distro):sudo service stackdriver-agent restartHigher resolution agent metrics require Monitoring agent version 6.0.1 or greater. You can find documentation for determining your agent version here.Now that your Monitoring agent is emitting metrics at 10-second granularity, you can view them in Metrics Explorer by searching for metrics with the prefix “agent.googleapis.com/agent/”.How to write custom metrics at 10-second resolutionCustom metrics allow you to define and collect metric data that built-in Google Cloud metrics cannot provide. These could be specific to your application, infrastructure, or business. For example: “Latency of the shopping cart service” or “Returning customer rate” in an e-commerce application.Custom metrics can be written in a variety of ways: via the Monitoring API, Cloud Monitoring client libraries, OpenCensus/OpenTelemetry libraries, or the Cloud Monitoring agent.We recommend using the OpenCensus libraries to write custom metrics for several reasons:It is open source and supports a wide range of languages and frameworks.OpenCensus provides vendor-agnostic support for the collection of metric and trace data.OpenCensus provides optimized collection of points and batching of Monitoring API calls. It also handles timing API calls for 10-second resolution and other time intervals, so that the Monitoring API won’t reject points for being written too frequently. It also handles retries, exponential backoff, and more, helping to ensure that your metric points make it to the monitoring system.OpenCensus allows you to export the collected data to a variety of backend applications and monitoring services, including Cloud Monitoring.Instrumenting your code to use OpenCensus for metrics involves three general steps:Import the OpenCensus stats and OpenCensus Stackdriver exporter packages.Initialize the Cloud Monitoring exporter.Use the OpenCensus API to instrument your code.The following is a minimal Go program that illustrates the instrumentation steps listed above by writing a counter metric to Cloud Monitoring.If you don’t have a working Go development environment, follow these steps in the Google Cloud Console and Cloud Shell to compile and run the demo program:Go to Cloud Monitoring. If you’re using Cloud Monitoring for the first time, you’ll be prompted to create a workspace (it will default to the same name as the GCP project you are currently in).Open up the Cloud Shell in the Cloud Console.Make sure to enable the Monitoring API by running gcloud services enable monitoringIf you don’t already have a working go environment, follow these steps:mkdir ~/goexport GOPATH=~/gomkdir -p ~/go/src/testCustomMetricscd ~/go/src/testCustomMetricsRun “go mod init”touch testCustomMetrics.goOpen testCustomMetrics.go in your text editor of choice and copy in the code belowRun “go mod tidy”. Note: “go mod tidy” finds all the packages transitively imported by packages in your moduleRun “go build testCustomMetrics.go”Run “./testCustomMetrics”The example program is as follows:This program writes a random star count every one second, for three minutes. As you may note from above, custom metrics can only be written with 10-second granularity. We are writing raw metric points more frequently, but we’ve set the OpenCensus exporter ‘ReportingInterval’ to be every 10 seconds, so the Exporter handles calling the ‘CreateTimeSeries endpoint’ of the Monitoring API correctly every 10 seconds. When you query your points, select an ‘aligner’ and ‘aggregation’ option from Metrics Explorer. This way, even if you have multiple points in a 10-second span, you’ll return a single point based on your aligner and aggregation options.After running the program, you can go to Metrics Explorer in Cloud Monitoring to see the “OpenCensus/star_count” metric, written against the “global” resource.How to write Prometheus metrics at 10-second resolutionThe Prometheus monitoring tool is often used with Kubernetes. If you configure Cloud Operations for GKE to include Prometheus support, then the metrics that are generated by services using the Prometheus exposition format can be exported from the cluster and made visible as external metrics in Cloud Monitoring.Installing and configuring Prometheus, including configuring export to Cloud Monitoring, involves a few steps, so we recommend you follow these instructions. OpenCensus also offers a guided codelab for configuring Prometheus instrumentation.To enable 10-second resolution for Prometheus metrics that are exported to Cloud Monitoring, set the “scrape_interval” parameter in “prometheus.yml” to:scrape_interval:     10sOnce Prometheus is properly configured to export metrics to Cloud Monitoring, you can go to Metrics Explorer in Cloud Monitoring and search for metrics with the prefix external.googleapis.com/prometheus/.Pricing for Cloud Monitoring metricsCloud Monitoring chargeable metrics are billed per megabyte of ingestion, with the first 150MB free, and reduced pricing tiers for customers that send larger volumes of metrics. There is no additional cost for sending higher resolution metrics other than the additional cost incurred from sending metric data more frequently. The frequency at which you write custom metrics (with 10 seconds as the lower bound) is up to you. GCP platform (system) metrics remain free and the granularity at which they are written is determined by each individual GCP service. Toward better observabilityWe hope you find the ability to write higher resolution custom, Prometheus, and Agent metrics useful and that it helps you build more observable applications and services. Higher resolution logs-based metrics at 10-second granularity are on our roadmap as well, so stay tuned for more information in an upcoming blog post.
Quelle: Google Cloud Platform

Prepare and certify your devices for IoT Plug and Play

Developing solutions with Azure IoT has never been faster, easier, or more secure. However, the tight coupling and integration between IoT device software and the software that matches it in the cloud can make it challenging to add different devices without spending hours writing device code.

IoT Plug and Play can solve this by enabling a seamless device-to-cloud integration experience. IoT Plug and Play from Microsoft is an open approach using Digital Twin Definition Language (based on JavaScript Object Notation for Linked Data (JSON-LD)) that allows IoT devices to declare their capabilities to cloud solutions. It enables hardware partners to build devices that can easily integrate with cloud solutions based on Azure IoT Central, as well as third-party solutions built on top of Azure IoT Hub or Azure Digital Twins.

As such, we are pleased to announce that the IoT Plug and Play device certification program is now available for companies to certify and drive awareness of their devices tailored for solutions, while also reducing time to market. In this blog post, we will explore the common ecosystem challenges and business motivations for using IoT Plug and Play, as well as why companies are choosing to pursue IoT Plug and Play certification and the requirements and process involved.

Addressing ecosystem challenges and business needs with IoT Plug and Play

Across our ecosystem of partners and customers, we continue to see opportunities to simplify IoT. Companies are using IoT devices to help them find valuable insights ranging from how customers are using their products, to how they can optimize operations and reduce energy consumption. Yet there are also challenges to enabling these scenarios across energy, agriculture, retail, healthcare, and other industries as integrating IoT devices into cloud solutions can often be a time-consuming process.

Windows solved a similar industry problem with Plug and Play, which at its core, was a capability model that devices could declare and present to Windows when they were connected. This capability model made it possible for thousands of different devices to connect to Windows and be used without any software having to be installed manually on Windows.

IoT Plug and Play—which was announced during Microsoft Build in May 2019—similarly addresses the ecosystem need to declare an open model language through an open approach. IoT Plug and Play is currently available in preview and offers numerous advantages for device builders, solution builders, and customers alike when it comes to reducing solution development time, cost, and complexity. By democratizing device integration, IoT Plug and Play helps remove entry barriers and opens new IoT device use cases. Since IoT Plug and Play-enabled solutions can understand the device model to start using devices without customization, the same interaction model can be used in any industry. For instance, cameras used on the factory floor for inspection can also be used in retail scenarios.

The IoT Plug and Play certification process validates that devices meet core capabilities and are enabled for secure device provisioning. The use of IoT Plug and Play certified devices is recommended in all IoT solutions, even those that do not currently leverage all the capabilities, as migration of IoT Plug and Play-enabled devices is a simple process.

IoT Plug and Play saves partners time and money

IoT Plug and Play-capable devices can become a major business differentiator for device and solution builders. Microsoft partner, myDevices, is already leveraging IoT Plug and Play in their commercial IoT solutions. According to Adrian Sanchez del Campo, Vice President of Engineering, “The main value in IoT Plug and Play is the ease of developing a device that will be used in a connected fashion. It's the easiest way to connect any hardware to the cloud, and it allows for any company to easily define telemetry and properties of a device without writing any embedded code.”

Sanchez del Campo also says it saves time and money. For devices that monitor or serve as a gateway at the edge, IoT Plug and Play enables myDevices to cut their development cycle by half or more, accelerating proofs of concept while also reducing development costs.

Olivier Pauzet, Vice President Product, IoT Solutions, from Sierra Wireless agrees that IoT Plug and Play is a definite time and money saver. “IoT Plug and Play comes on top of the existing partnership and joint value brought by Sierra Wireless’s Octave all-in-one-edge-to-cloud solution and Azure IoT services,” says Pauzet. “For customers using Digital Twins or IoT Central, being able to leverage IoT Plug and Play on both Octave and Azure will expand capabilities while making solution development even faster and easier.”

In addition to faster time to market, IoT Plug and Play also provides benefits for simplifying solution development. “As a full edge-to-cloud solution provider, Sierra Wireless sees benefits in making customer devices reported through Octave cloud connectors compatible with IoT Plug and Play applications,” says Pauzet. “Making it even simpler for customers and system integrators to build reliable, secure, and flexible end-to-end solutions is a key benefit for the whole ecosystem.”

Benefits of IoT Plug and Play device certification from Microsoft

Achieving IoT Plug and Play certification offers multiple advantages, but at its core, the benefits revolve around device builders having confidence that their tailored devices will be more discoverable, be more readily promoted to a broader audience, and have a reduced time to market.

Once a device is IoT Plug and Play-certified, it can easily be used in any IoT Plug and Play-enabled solution which increases the market opportunity for device builders. IoT Plug and Play-certified devices are also surfaced to a worldwide audience, helping solution builders discover devices with the capabilities they need at a previously unreachable scale.

It also provides device builders with the opportunity to easily partner with other providers who have adopted the same open approach to create true end-to-end solutions. Plus, devices can be deployed in various solutions without a direct relationship between the device builder and solution builder, increasing your addressable market.

Device builders gain additional audience exposure and potential co-sell opportunities by getting IoT Plug and Play-certified devices featured and promoted in the Certified for Azure IoT device catalog. The catalog provides expanded opportunities to reach solution developers and device buyers, who can search for compatible devices.

Finally, IoT Plug and Play-certified devices appeal to solution builders because they enable time to value by simplifying and reducing the solution development cycle. IoT Plug and Play also gives extensibility to IoT Plug and Play-enabled solutions by enabling the seamless addition of more devices.

Achieving IoT Plug and Play certification

To achieve IoT Plug and Play certification from Microsoft, devices must meet the following requirements:

Defined device models and compliance with the Digital Twin Definition Language (DTDL) version 2.
Support Device Provisioning Services (DPS).
Physical device review.

The certification process is comprised of three phases: develop, certify, and publish. Develop phase activities include modeling and developing the code, storing the device models, and then iterating and testing the code. The outcome is a finalized device code that is ready to go through the IoT Plug and Play certification phase.

Certify phase activities require Microsoft Partner Network membership and onboarding to the Azure Certified Device submission portal. To kick off the certification process, developers must submit their IoT Plug and Play device model to the portal, along with relevant marketing details. Once complete, developers can connect and test in the certification portal, which takes the device through an automated set of validation tests.

Upon IoT Plug and Play certification, the device becomes eligible for publication to the Certified for Azure IoT device catalog. Publish phase activities include submitting the test results, device metadata, and Get Started Guide, along with the desired publish date, to Microsoft. Microsoft will work with the device builder to coordinate additional physical device review after the device is published.

Get started on IoT Plug and Play certification

Now is the right time to get ahead of the coming groundswell for IoT Plug and Play certification and begin maximizing your business potential. Begin the certification process by watching this video on how to certify IoT Plug and Play devices. For questions, reach out to us via email at IoT Certification.

For those considering device certification beyond IoT Plug and Play, stay tuned for future enhancements that will be announced soon. In the meantime, be sure to explore Azure IoT resources, including technical guidance, how-to guides, Microsoft Tech Community, and more.

Additional resources include:

IoT Plug and Play preview blog.
IoT Plug and Play documentation.
Certification tools:

Command line.
Azure Certified Device submission portal.

Azure Certified for IoT device catalog.
IoT Show for IoT Plug and Play.
IoT Plug and Play certification tutorial.

Quelle: Azure






