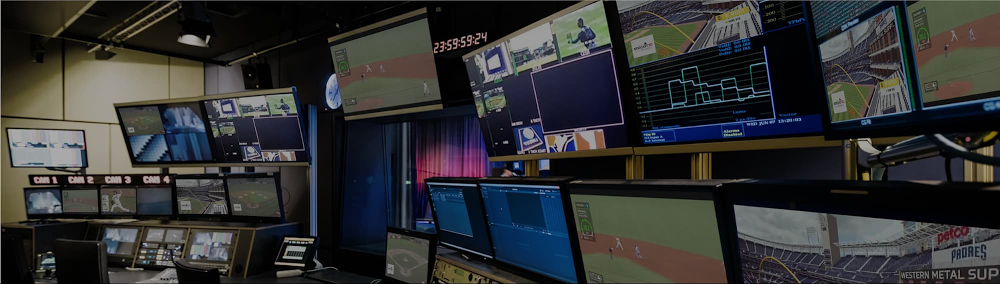
MLB uses Google Cloud Smart Analytics platform to scale data insights

Though 2020 has been a year like no other, many sports fans can take comfort in the fact that one of America’s fall traditions has continued: the World Series, baseball’s annual championship consumed by millions. This year, the Los Angeles Dodgers and Tampa Bay Rays have split the first two games, setting us up for an exciting three days of baseball beginning Friday night.In the first season of a multi-season partnership to drive innovation and fan engagement around baseball, Google Cloud and Major League Baseball (MLB) have collaborated to build a technical foundation in the midst of responding to numerous challenges presented by the COVID-19 pandemic. From a data perspective, one key piece of that foundation is Statcast, the league’s in-park data capture system that allows for collection and analysis of a massive amount of baseball data that’s not only changing the way games are viewed but also how and why decisions are made.This post focuses on how Google Cloud is helping MLB use the data from Statcast to derive insights that enable MLB broadcasters and content generators to determine relevant storylines and add richer context to games. As nearly every sport becomes increasingly data-driven, with baseball at the forefront (as it has been for decades), the ability to democratize access to analytics and insights like these for players, coaches, front-office decision makers, media, and fans will be critical to the future of sports.Going beyond sports, the technical workflow described here could be helpful to any business looking to scale up its processes for turning data into insights and improve its data-driven decision making. Across industries, there is tremendous upside to generating objective measurements, turning them into timely, contextual, succinct bits of valuable information, and doing so with vastly improved efficiency relying on automation.MLB Game NotesA “game note” can be thought of as a statistical insight related to players and teams involved in a particular matchup. Per MLB, more than two-thirds of broadcasters sometimes or often use game notes when preparing for a telecast. In addition, statistically-driven notes like these help clubs, digital media, writers, and researchers discover or support various storylines involving teams and players throughout the season.Below is a typical game note and accompanying table that the MLB content team prepared in advance of the World Series, highlighting how the Rays’ Randy Arozarena and two Dodgers players all ranked among the MLB Postseason leaders in “hard-hit balls” – i.e., the number of balls hit with an exit velocity above 95 miles per hour.Randy Arozarena leads all players with 26 hard-hit balls this postseason, with Corey Seager and Mookie Betts also ranking in the top 5.Most hard-hit balls, 2020 postseason1. Randy Arozarena (TB): 262-T. Corey Seager (LAD): 232-T. Freddie Freeman (ATL): 232-T. Michael Brantley (HOU): 235. Mookie Betts (LAD): 22Hard-hit: 95+ mph exit velocityBaseball fans know that Arozarena, Seager, and Betts have been crushing the ball the last few weeks. Statcast data helps quantify that (by measuring speed off the bat on every batted ball), and the note adds the context that they’ve done so with higher frequency than almost anyone else over the course of the playoffs.Traditionally, the league’s content researchers create interesting game notes manually, using baseball knowledge and flexible tools like Baseball Savant to look up leaderboards and trends. The time- and resource-intensive nature of this manual process limits the number and specificity of notes for each day, which can leave several games and teams uncovered during a typical regular season (30 teams playing 162 games each over six months).Taking a step back and looking at many of these notes, there are some repeatable patterns that are ripe for automation. For example, many notes highlight teams or players that rank in the top or bottom five across MLB in a particular statistic of interest (like the example above). With an automated process, we could more easily create similar leaderboards for many different stats and look across multiple historical time spans (e.g. this past regular season, the entire Statcast era, etc.). This provided motivation for our work to generate “automated” game notes, vastly increasing the scale and speed at which such notes are created on a daily basis.Data IngestionIn the Statcast world, baseball data generation begins when the players take the field. Optical tracking sensors provided by Hawk-Eye Innovations transmit player and ball motion data from each ballpark to the MLB PostgreSQL database hosted in Google Cloud. Over the six-year history of Statcast, the MLB Technology team has created dozens of derived metrics from this data, and makes event-level (pitch-by-pitch) data and associated metrics accessible to partners and clubs via the Stats API application (see here for more details.)In order to set up for large-scale data processing across several metrics for all teams and players across multiple time spans, we set up an ingestion process to store off event-level Statcast data from the MLB Stats API in relational database-style tables. MLB data for every game event over the last six seasons was read in and processed by Cloud Dataflow, Google Cloud’s fully managed, serverless, stream and batch data processing service, and stored in BigQuery, Google Cloud’s serverless, petabyte-scale data warehouse.Dataflow provided a platform where we could design a single job (see details in image below) that would both backfill the six seasons of data needed as well as pull in new data from each individual game as the 2020 MLB season progressed. When we needed to backfill, we scaled up to hundreds of machines processing almost 2.5TB of data in around 150 hours of vCPU processing time, taking 30 minutes of wall clock time. When we needed to pull in only two League Championship Series games, this could be done on a single machine in a matter of minutes.Click to enlargeThe result of this process was a number of tables in BigQuery containing all historical Statcast data, updated each day during the MLB season. In addition to a single table with millions of rows and dozens of columns with Statcast data on each event, BigQuery tables involved in game note generation include team schedules, rosters, and probable starters, among others.The daily orchestration of this data ingestion process was handled by Cloud Composer, Google’s fully managed workflow orchestration service built on Apache Airflow. Airflow is an open source platform used to programmatically build, schedule and monitor individual workflows. Once we had scripted a DAG (a collection of tasks to be run – one of Airflow’s core concepts), we could test it, run it, monitor performance and start debugging all in the Airflow UI, hosted by Cloud Composer. In the case of our daily ingest of MLB data, we have a 12-step process (see details in image below) that starts with pulling raw data from MLB API endpoints and finishes with notes like the example above.Click to enlargeUsing BigQuery to go from data to insightsWith data stored and updating in BigQuery, our next step was to turn that data into text-based insights that could form game notes. We could’ve created a large number of unique SQL queries that generate various stat leaderboards for use in game notes – e.g. one query for teams with the most hard-hit balls this regular season, one for pitchers with the highest average fastball velocity in the postseason, and so on. While that would work, we scaled up more robustly by making some generalizations across how many of these “stat leaderboard”-type notes are created, and by using some more advanced BigQuery features to reduce the amount of code complexity and redundancy required.Most statistics leaderboards used here can be thought of as compositions of a few elements:A statistic of interest, e.g. number of hard-hit balls or average fastball velocityA time span that the leaderboard covers, e.g. last 2 regular seasons or this postseasonAn “entity” of interest, usually either teams or playersA “facet” of the game, representing which “side” of the ball to calculate certain stats for, e.g. hitting or pitchingA ranking qualification criteria, which represents a minimum # of opportunities for a stat to be reasonable for ranking (mostly used for player “rate” stats where a small denominator can lead to outlier results, like a .700 batting average over 10 at-bats).Each of these composable elements can be separated out as different “ingredients” to be used in various combinations to generate leaderboards. We created a single BigQuery view for each time span of, filtering the Statcast events table by date and game type. Each stat has several pieces of info related to its calculation (numerator, denominator) and display (various names and abbreviations, decimals, etc.) stored in a few “support” tables. Another key table lays out the elements to compose for each leaderboard – one stat, one span, whether to aggregate by teams or players, from the hitting or pitching perspective, and with what qualifying stat.Our workhorse to process various combinations of those elements in a repeatable way is BigQuery’s scripting capability, which allowed us to chain together multiple SQL statements in one request, using variables and control statements. Stored procedures allow BigQuery statements in scripts to be modularized into separate pieces, as is often done in functional programming. BigQuery’s Dynamic SQL capabilities, which enable using SQL code to write SQL text to be subsequently executed by BigQuery, increase the scope of what can be done within those stored procedures.Without these BigQuery features, we would’ve likely had to create the SQL text and call it from outside of BigQuery, in a language like Python or R. Doing so in the BigQuery environment itself eliminates the potential need to move data or business logic outside the warehouse, and increases code simplicity and consistency for those comfortable with using SQL.We implemented a substantial amount of business logic in BigQuery to run hundreds of SQL statements to create more than 100 “parallel” stat leaderboards, add rankings (raw and percentile), and determine which players or teams deserve notes for each stat (usually, those at the extreme ends of a ranking). Another series of SQL manipulations turns individual leaderboard fields into the more actual text of a note – e.g. name “Randy Arozarena,” rank “1”, stat name “Hard-Hit Balls,” span “2020 Postseason,” entity type “Player,” and value “26” get combined into “Randy Arozarena ranks 1st in the 2020 postseason with 26 hard-hit balls (balls hit with 95+ mph exit velocity).”Next, we add current team and player context to each note. The table accompanying certain notes uses BigQuery’s arrays in subqueries to filter each underlying leaderboard down, tag players with their current teams, and highlight the specific player the note is about within the table text. Notes for active players and teams are attached to each team’s next scheduled game. The automated version of our example note looks like this:Very close to the original!Scaling up note generation for notes that fit this paradigm is relatively straightforward. After adding 2020 postseason stats, we were able to create 150 notes per game during the League Championship Series – a tremendous increase from what is feasible manually, saving many hours of time.We store all game notes in another BigQuery table with “metadata” fields for team, player, game, and more, allowing notes to be further filtered or manipulated in upstream processes. To facilitate consumption by MLB content and production personnel, game notes were surfaced in a more visually appealing and user-friendly Data Studio dashboard.Surfacing the best game notesOnce the number of automated notes reached a certain volume, we noticed a challenge that was almost the opposite of the initial one: too many game notes to consider. Broadcasters and production crews are only looking for a couple key contextual insights to include in a telecast and could be easily inundated with too much information.Being able to filter notes by the various fields mentioned above helps, but another feature we added was a “note score” that represented how “good” each note is. Since this is inherently subjective, our initial idea was to come up with various concepts related to how interesting or useful a specific game note might be, and figure out a data-driven way to measure each of them. The eight component scores that comprise the current note score metric are:Stat Interest, incorporating extremeness (impressiveness) and direction of ranking (positive or negative)Player Game Relevance, currently used to increase scores for notes on a team’s probable starting pitcherPlayer Relevance, using a player’s various MLB honors (rated by relative prestige and recency) to rate some players as more relevant than othersPlayer Popularity, based on YouGov’s list of most famous contemporary Baseball players in America, as of August 2020 Team Relevance, based on FiveThirtyEight’s Postseason projections (chances to make playoffs and win the World Series) during the regular season, the same for every remaining team in the PostseasonTeam Popularity, based on number of Facebook fans and Twitter followers of official team accounts (both per Statista), as of August 2020Stat Type, representing how some stats are more broadly interesting/applicable than othersStat Span, representing how stats involving more recent spans are likely more interesting/applicable than those involving older seasonsOur “final” note score is a weighted average of these component scores, with the highest weighting by far on Stat Interest, and then relatively high weights on Player Game Relevance, Player Relevance, and Stat Span. In the MLB-facing game notes dashboard, we took advantage of Data Studio parameters to allow users to enter their own weights to create a “custom” note score, enabling their own ranking of notes across games.There is admittedly a lot of subjectivity in the way each of the note score components are measured and how they are weighted. Without an objective way to measure note quality, we’ve in some sense put in placeholders for the purpose of prototyping the system. In the future, consumers of the notes could mark their perceived quality or even simply track if they were used on broadcasts or not. This “labeling” could then provide data for a supervised machine learning problem, where past notes could be used to predict the perceived quality or likelihood of usage of new notes, allowing for more actual result-driven note scoring.That said, the main takeaway is that having a note score, even in its current form, generally helps separate better game notes from worse ones. This helps the MLB production and content teams focus their limited time and attention to notes more likely to have impact.Putting it all together and building for the futureBy encapsulating the BigQuery pieces for leaderboard creation, note generation, note scoring, attachment to games, and preparation for the dashboard into a series of views and stored procedures, our daily note generation process is run with a few short SQL statements. As we mentioned, this code runs at the end of the Cloud Composer pipeline referenced above, so that game notes are generated right after Statcast data is updated in BigQuery each morning during the season.To recap, MLB uses Google Cloud’s suite of data analytics tools to create automated game notes at vastly increased speed and scale. Using Dataflow to capture Statcast event data from the last six seasons and daily going forward, BigQuery to compute statistics and add appropriate context to turn them into textual notes, and Cloud Composer to orchestrate the daily data ingestion and note creation pipeline, hundreds of insightful game notes are surfaced daily for consideration by the MLB content and event production teams.While stat leaderboard-based notes may represent the most readily scalable category of notes, there are of course many other types of game notes we could create automatically: player- or team-specific highs and lows, single outlier events, and matchup-specific notes involving players on two teams facing off. Another future direction of high interest is to create near-live in-game notes, providing context to events on the field seconds after they take place.For all that and more, stay tuned for more exciting collaboration from the MLB-Google Cloud partnership—we have plenty “on deck.” But for now, enjoy the 2020 World Series!Major League Baseball trademarks and copyrights are used with permission of Major League Baseball. Visit MLB.com.
Quelle: Google Cloud Platform

Improving security and governance in PostgreSQL with Cloud SQL

Ensuring databases are securely managed is a crucial part of every organization’s critical operations. When those organizations rely on a managed service like Cloud SQL, a key benefit is consistency of management, including security policies that extend beyond a single service. Cloud SQL has continued to enhance its security capabilities. We’ve introduced VPC Service Controls so you can securely connect to your database instance, and have added Customer Managed Encryption Keys as an option for meeting regulatory compliance. Now, we’re proud to announce Cloud Identity and Access Management (Cloud IAM) integration and the enablement of PostgreSQL Audit Extension (pgAudit), both available in preview for Cloud SQL for PostgreSQL.Enablement of pgAudit offers Cloud SQL users the flexibility to log statements at their needed level of granularity for future investigation or auditing purposes. With pgAudit, Cloud SQL users configure filters that log only the sensitive actions that are specific to their data, minimizing performance impacts to the database. Cloud SQL pgAudit logs contain the timestamp, username, database, command type, and the raw query to equip security teams with detailed information about database accesses. This extension can be configured to include which particular command sets should be audited and also allows for the creation of auditor roles, which can then be assigned to designated users. Once those logs are collected, users can analyze and monitor them from Cloud Logging, BigQuery, or their preferred third-party log management tool.The integration with Cloud IAM enables administrators to authorize users to log in to the PostgreSQL database using short-term access tokens instead of traditional database passwords. This simplifies the authentication workflow for users by removing the need for a separate set of credentials to access the database, as well as reducing identity management complexity. This centralized approach with Cloud IAM brings greater consistency to the authentication and authorization experience with other Google Cloud database services and is simple and straightforward to set up, as demonstrated below.Authorizing a Cloud IAM user for database loginCloud IAM integration can be enabled by an administrator for a database instance by updating a single flag, as seen in the following command:$ gcloud sql instances patch [INSTANCE­_NAME] –database-flag cloudsql.iam_authentication=onDatabase users can now be created by using the same email address as the one in use for Cloud IAM and then granted privileges with a normal grant command or by assigning roles to that user.$ gcloud beta sql users create [EMAIL] –instance=[INSTANCE­_NAME] –type=cloud_iam_user …To learn more about these new features, check our documentation here and here, and try it out with your own project. Cloud SQL continues to enhance its security and governance capabilities alongside advancements by the rest of Google Cloud and meet the needs of our customers. Stay tuned for additional investment and updates in this space across all of our database engines.
Quelle: Google Cloud Platform

Preparing for peak holiday shopping in 2020: War rooms go virtual

As retail gets ready for an unprecedented holiday 2020, it’s not just shoppers who are looking to go digital-first. Retail war rooms – traditionally a single large room where core IT and business teams gather together to ensure systems keep running, websites don’t crash and items stay in stock – are also looking different due to COVID-19. For many retailers, holiday war rooms in 2020 are going to be scattered across multiple living rooms, couches, garages, and kitchens as people are working remotely. Managing this type of large scale, high visibility event 100% virtually (remotely, digitally, it all means the same thing) is a first for many. This year many of our customers have elected to use our Black Friday/Cyber Monday (BFCM) white glove service. We are working with leading retailers such as Macy’s, The Home Depot, and Tokopedia as they take their war rooms 100% virtual.Implementing virtual war rooms has been a crucial part of our ability to respond to increased site traffic and sales allowing us to respond quickly and keep our more than 100 million monthly active users happy Tahir Hashmi, VP of Engineering (Technical Fellow) at TokopediaThe good news is this has been done before. Google has been running virtual war rooms for many years when conducting large product launches, incident responses, and our own Black Friday/Cyber Monday activities. We’ve created guidance for preparing, running, and evaluating Black Friday/Cyber Monday and an extended holiday season virtual war room. We want customers to make sure their response to such an important peak event is as responsive and efficient as it has been in past years. These best practices will help teams navigate consumer behavior uncertainty this season and the corresponding system demands to provide continuous uptime and exceptional customer experience.Step 1: Preparing for the eventGather important informationStart preparing to manage what is often the largest and most important event of the year for your business by ensuring that all information that may be necessary during the event is easily available, clearly documented, and quickly accessible by all members of the war room. Remember that any communications may incur delays – it won’t be possible to simply walk over to your teammate’s desk and ask them a question. CommunicationFirst, determine the exact communication tools and approaches you will use both during normal event management and when you shift to emergency or incident response. Specify both group- and team-wide communication expectations (i.e. chat channels, conference bridges, etc.) and how folks will be able to communicate one-on-one should direct escalation or clarification be necessary. These expectations should be as clear and straightforward as possible so that there is no confusion, especially if you have to manage an incident during an already stressful time. Consider backup plans for each – what will you do if your selected chat platform experiences an outage, for example?One specific recommendation is to standardize date/time formats in all communication – this is especially important if your team is distributed across multiple time zones. Communication should be as unambiguous as possible, and having to clarify that you were referring to your local time zone rather than the next oncaller’s when describing an event you’re handing over adds confusion and possible delays in response.Another critical component of communication is enabling people to get the information they need without having to ask others. To that end, consider using or creating a dedicated status page or Google Group that provides an overall health of the systems involved in the event and links to additional details, such as relevant monitoring and/or logging consoles. The objective is to allow those who need to know what’s happening to get that information at a glance and not require additional communication. A key recommendation is to designate a specific and known owner of this page to be responsible for updating it on a predetermined schedule.ExpectationsNext, ensure that there is a clear definition of staffing, roles, and expectations that includes both normal and emergency contact methods. Create a list of team members who will be involved in the event and how they may be reached directly (typically on their mobile phone or via pager) should the need arise. If you’ll be using a rotation system, document it clearly and create a prescriptive plan for how hand-offs of both normal operations and escalations will be handled during the event. In either case, be clear about each team’s or individual’s role in the event and about when the emergency method of contact should be used versus the normal one. It will be very helpful to create an explicit “chain of escalation” document, if you don’t have one already. This way the right level of attention is directed at a problem should one arise AND so that people don’t experience overload and burnout during the event, which will likely demand their attention over a prolonged period of time.This is also a great time to create an expected timeline for the event. As clearly as possible, document when the event will start, what activities will take place during the event itself, and when the event will end.Finally, consider creating a plan for handling common outage modes you may experience. Ensure your monitoring is ready to detect them and that you have a plan to respond. For example, confirm that the right people are available (e.g. what if you need to spend money quickly to bring up more capacity?) and ready to approve such decisions quickly if needed. EngagementIn the past, you may have run these events in a dedicated physical space and possibly provided food, entertainment, or other means to keep the team engaged. How will you continue to keep people engaged during their shifts in a virtual environment? Think about sending the team gift cards or treat baskets as a surprise to boost morale when going through this experience virtually.Do A Test RunThe best way to ensure preparedness is to run through simulations that will let you see how your virtual processes work under pressure. This will help you gauge their effectiveness in solving a situation when problems arise and allow you to handle anything that may come your way. To prepare for such an exercise, determine the exact scope of what you’d like to test and accomplish. If you’re looking to specifically exercise those aspects of your war room that have changed to virtual, you’re likely going to focus on how information is exchanged in a distributed team. Consider testing your communication tools – both primary and secondary – by using them for normal communication and escalation situations. This should help you determine whether the team has the tools configured appropriately and easily available to them, if there are any issues with useability or accessibility you need to address prior to the event, and whether your expectations of how communication takes place during the event are clear.Consider running an exercise to validate your timeline of events – both under “normal” operating conditions and during an incident, emergency, or escalation. The latter can be thought of as a Wheel of Misfortune tabletop exercise (template) where your objective is to practice your incident management and response techniques. While the former would be more focused on ensuring that the timeline you have created is realistic, your expectations are clear and well-understood, and that the team is able to act on their assigned responsibilities.Finally, you may choose to prepare for the event by running a “live” test – either using a DiRT-style or chaos engineering approach and introducing actual failures into your production systems or by running a large-scale load test against a non-production environment. In either case, you will want to treat the test as practice for the actual event and use all of the information you’ve collected in the previous section to respond.  Post Mortem of Preparations and TestsAfter preparations and testing have finished, evaluate what went well, what can be improved, and how you can strengthen the war room process itself. This is important to ensure your ability to adapt and keep the event running under any circumstances. However, do not simply focus on those things you need to do to prepare for this year’s event – also try to capture what you can improve long term to be in a better position for future events.Use the learnings from the tests to improve your plan and address any issues you discover as quickly as possible. Prioritize action items from the post mortem in your engineering work planning leading up to the event, paying special attention to issues of communication and information flow, as those can have a critical impact on the ability of your team to manage this event remotely.Step 2: During the eventWith preparations now complete, it is time for the big event. Due to the extensive planning that has happened already the goal is for things to go smoothly. However it is important to remember the key differentiators of communication, activity logging, and escalation management that affect virtual war rooms due to the remote collaboration.CommunicationThe importance of communication during a virtual war room cannot be overstated. A disciplined approach to preparation and following established rules may mean a difference of hours in outage resolution.Throughout the entire event make sure to have a single chat room that is at the core of your communication strategy. Be prepared, should an actual outage occur, to start additional chat rooms focused on specific issues. For example you might find that a dedicated chat room for the technical team is of great value.Appoint a single person to be the communications lead. As part of Google’s incident management training it is mandated that during large/huge outages, a communication lead is appointed. This is the person that everyone goes to with questions and provides all outgoing updates, allowing the rest of the team to focus on their specific roles. As stated previously, the communications lead may wish to keep a single Current Status of Event page updated so that anyone can know, at a glance, what’s happening.Finally, be especially vigilant about transferring information during shift handovers. With an up-to-date status page and logs, this may be trivial. However, always get an explicit acknowledgement from the party taking over the shift, especially when transferring roles like the communications lead and decision maker. During the preparation phase the contacts list that was created should reflect any team members due to come oncall during the virtual war room. Teams handing over should be prepared to perform handover duties which could include informing war room members on the chat who is about to come on call and who they replace.LoggingIn order to easily reconstruct what happened during the event later, when you are writing a retrospective or post-mortem, try to keep a log of everything that happens. Make sure your chat rooms have history turned on. Nominate dedicated note takers, but encourage everyone to keep a log of actions taken and events they’ve noticed. (Google Forms can be an easy solution here. Setup the simplest possible form with a single text field, and make sure it records the timestamp. Encourage everyone to enter information, you can deduplicate later.)Make sure to set a cadence for updating the status.  Even if nothing interesting happens, post an update anyway.EscalationBe prepared to handle expected and unexpected emergencies. Make sure you always have a single dedicated decision maker that makes the call on what should happen next. If multiple people feel empowered to make unilateral decisions and production changes at the same time, you are much more likely to exacerbate the situation and prolong the outage.Dealing with an outage is an important area to master in itself, whether in person or remote. Some good starting points to learn more about how to handle incidents include the Managing Incidents chapter in the SRE book and the followup Incident Response chapter in the SRE Workbook.Step 3: Post eventAfter the event concludes, you should conduct a post mortem of the entire process. The three pieces of information you want to collect are: what went well, what went wrong, and where did you get lucky.Note through all three of these sections, you want to keep the investigation blameless. Avoid statements like “X did something”, and instead use “thing was done”. If you want to make sure there is an audit trail, you can add a link to the code or an audit log, but the goal of this document is to highlight system issues and successes, not point to a person. The topic of this post mortem should focus on details about the virtual war room itself. We recommend that teams write two postmortems: one about the event (e.g. we made a million dollars!) and one about the virtual war room operations. When filling out the three sections, consider some of the following prompts:How did communications go? Did everyone know what was happening and when?If there was an outage, did it follow the normal flow?Did everyone have the correct permissions?Did everyone know what to do and when?Were conversations had in lots of different mediums, or were they all in one space?Did we communicate with our vendors well?Was the war room run for long or short enough?Did we learn things that we could apply to our normal operations?Make sure everyone involved in the event and war room has a chance to contribute, but one person should be the owner. After folks have had a chance to comment and expand it, publish it to the whole company so everyone can learn from how you ran your virtual war room!If you want to learn more about writing post mortems, check out the following resources:Fearless shared postmortemsGoogle SRE Book: Postmortem Culture Google SRE Book: Example PostmortemA collection of postmortem templates: dastergon/postmortem-templatesImproving Postmortem Practices with Steve McGheeThe approach above might look daunting, but by following it with the right methodology and organizational mindset you can execute a successful holiday season and lay the groundwork for a responsive and secure virtual war room. And remember, the Google Cloud team is here to help. To learn more about getting started on Black Friday / Cyber Monday, any other upcoming event preparations, or general best practices to manage risk reach out to your Technical Account Manager or contact a Google Cloud account team.A special thanks to Yuri Grinshteyn, Site Reliability Engineer / CRE;  Nat Welch, Site Reliability Engineer / CRE; Ahsan Khan, Program Manager; Dan Tulovsky, Site Reliability Engineer / CRE; Fabian Elliott, Technical Account Manager, for their contributions to this blog post.Related ArticleHelping retailers prepare for the 2020 holiday seasonCOVID-19’s impact on the retail industry means retailers everywhere are gearing up for an uncertain holiday season. We’re sharing our own…Read Article
Quelle: Google Cloud Platform