Freedom of choice: 9TB SSDs bring ultimate IOPS/$ to Compute Engine VMs

Applications that perform low-latency, I/O-intensive operations need to run on virtual machines with high-performance storage that’s tightly coupled with compute. This is especially important for applications built around real-time analytics, e-commerce, gaming, social media, and advertising platforms. Custom machine types in Compute Engine not only let you attach high-performance Local SSD, but give you the flexibility to customize your VMs to your workload’s exact needs.   Today, we are excited to announce that you can attach 6TB and 9TB Local SSD to second-generation general-purpose N2 Compute Engine VMs, for great IOPS per dollar. 9TB Local SSD delivers up to 2.4 million IOPS and 9.4 GB/s of throughput at direct-attach latencies, on any N2 VM with 24 or more vCPUs. And because you can attach these SSDs to any N2 VM shape (including custom shapes), you can define the exact VM that your application needs in terms of CPU, RAM, and SSD. You don’t need to attach more CPU and memory than what your I/O-intensive or storage-intensive workload demands, so you can optimize specifically for IOPS/$ or density/$—or a combination thereof.Disclaimer: Results are based on Google Cloud’s internal benchmarkingMaximum storage performance with fewer vCPUs6TB and 9TB Local SSDs have been available for N1 VMs, allowing you to achieve that maximum 2.4 million IOPS with 32 vCPUs or more. With N2 VMs, you need as few as 24 vCPUs to drive that same performance. This translates to a 7% better total cost of ownership for N2 VMs, relative to N1s. Some applications afford you the flexibility to optimize performance further, at different I/O queue depths or different block sizes. Using performance benchmarking tools like FIOcan help you make the optimal choice. As shown below, internal testing demonstrates that Local SSDs offer consistent performance across a broad range of configurations that your workloads might demand.Disclaimer: Results are based on Google Cloud’s internal benchmarkingMaximum throughputAttaching Local SSD to a VM is also a good strategy for workloads that demand high storage throughput. As you can see from the charts below, Local SSD can deliver close to maximum throughput at a wide range of block sizes (4K, 16K, 128K) and I/O depths, depending on the needs of your databases and applications.Disclaimer: Results are based on Google Cloud’s internal benchmarkingGet started todayLocal SSD are priced per-GB irrespective of the VM to which they are attached. Visit our pricing page for specific pricing in your region. 6TB and 9TB Local SSDs are now Generally Available on both N2 and N2D VMs. For more details, check out our documentation for Local SSDs. If you have questions or feedback, check out the Getting Help page.Related ArticleLocal SSDs + VMs = love at first (tera)byteIn Google Cloud Storage you can now attach 6TB and 9TB local SSDs to virtual machines (VMs) for higher throughput and IOPS per VM.Read Article
Quelle: Google Cloud Platform
How to trigger Cloud Run actions on BigQuery events

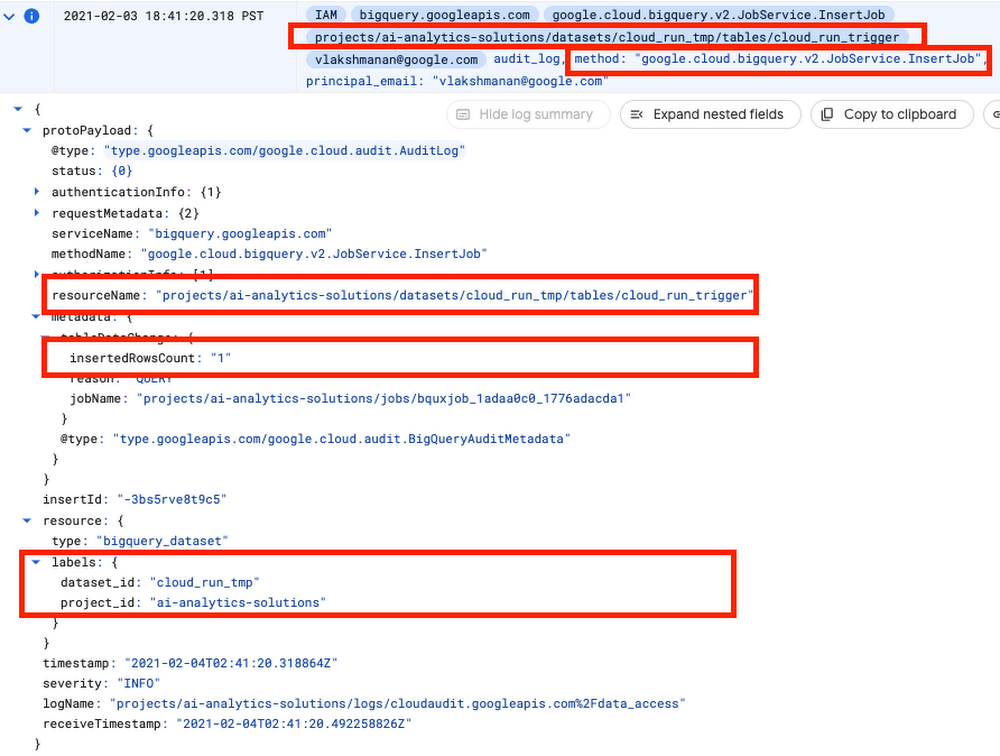
Many BigQuery users ask for database triggers—a way to run some procedural code in response to events on a particular BigQuery table, model, or dataset. Maybe you want to run an ELT job whenever a new table partition is created, or maybe you want to retrain your ML model whenever new rows are inserted into the table.In the general category of “Cloud gets easier”, this article will show how to quite simply and cleanly tie together BigQuery and Cloud Run. Because if you love BigQuery and you love Cloud Run, how can you not love when they get together?!Cloud Run will be triggered when BigQuery writes to its audit log. Every data access in BigQuery is logged (there is no way to turn it off), and so all that we need to do is to find out the exact log message that we are looking for.Follow along with me.Find the BigQuery eventI’m going to take a wild guess here and assume that you don’t want to muck up your actual datasets, so create a temporary dataset named cloud_run_tmp in your project in BigQuery.In that project, let’s create a table into which we will insert some rows to try things out. Grab some rows from a BigQuery public dataset to create this table:Then, run the insert query that we want to build a database trigger for:Now, in another Chrome tab, click on this link to filter for BigQuery audit events in Cloud Logging.I found this event:Note that there will be several audit logs for a given BigQuery action. In this case, for example, when we submit a query, a log will be generated immediately. But only after the query is parsed does BigQuery know which table(s) we want to interact with, so the initial log will not have the table name. Keep in mind that you don’t want any old audit log… make sure to look for a unique set of attributes that clearly identifies your action.In the case of inserting rows, this is the combination:The method is google.cloud.bigquery.v2.JobService.InsertJobThe name of the table being inserted to is the protoPayload.resourceNameThe dataset id is available as resource.labels.dataset_idThe number of inserted rows is protoPayload.metadata.tableDataChanged.insertedRowsCountWrite the Cloud Run ActionNow that we know the payload that we are looking for, we can write the Cloud Run action. Let’s do it in Python as a Flask App (full code is on GitHub).First, we make sure that this is the event we want to process:Once we have identified that this is the event we want, then we carry out the action that we want to do. Here, let’s do an aggregation and write out a new table:The Dockerfile for the container is simply a basic Python container into which we install Flask and the BigQuery client library:Deploy Cloud RunBuild the container and deploy it using a couple of gcloud commands:Setup Event TriggerIn order for the trigger to work, the service account for Cloud Run will need a couple of permissions:Finally create the event trigger:The important thing to note is that we are triggering on any Insert log created by BigQuery. That’s why, in the action, we had to filter these events based on the payload.What events are supported? An easy way to check is to look at the Web Console for Cloud Run. Here are a few to get your mind whirring:Try it outNow, try out the BigQuery -> Cloud Run trigger and action. Go to the BigQuery console and insert a row or two:Watch as a new table called created_by_trigger  gets created! You have successfully triggered a Cloud Run action on a database event in BigQuery. Enjoy!ResourcesAll the code, along with a README with instructions, is on GitHub.This blog post is an update to the book BigQuery: The Definitive Guide.  My goal is to update the book contents approximately once a year, and provide updates in the form of blogs like this.You can find previous such update blogs linked from the GitHub repository of the book.Thanks to Prashant Gulati.Related Article3 cool Cloud Run features that developers loveCloud Run developers enjoy pay-per-use pricing, multiple concurrency and secure event processing.Read Article
Quelle: Google Cloud Platform

Docker Index Shows Continued Massive Developer Adoption and Activity to Build and Share Apps with Docker

It’s been one year since we started publishing the Docker Index (stats, trends and analysis from developers and dev teams based on anonymized data from millions of Docker users). At that time we saw how Docker was being used at an incredible scale to power application building globally. Today we are excited to share the latest edition of the Docker Index, this time with some yearly and quarterly comparisons. 

Every time we pull these user stats, we are blown away by the sheer volume and continued growth in activity happening across the Docker developer community. It’s clear to see that collaborative application development platforms are the foundation for developers who want to build, share, and run modern apps. We are also thrilled to see this type of growth more than one year after refocusing Docker on making developers’ lives easier. The Docker community has stayed with us and continues to grow at a tremendous pace, giving us very encouraging signals about the path that Docker is taking. 

To begin, there has now been a total of 318 billion all time pulls on Docker Hub, an increase of 145% year-over-year. That’s right, the total number of pulls has increased by nearly 1.5x in the past year. In addition, there were nearly 30 billion Docker Hub pulls in our fourth quarter. This could very well be because essentially all businesses had to rapidly shift to digital, making the demand for great apps higher than ever.

Those large pull numbers were driven by an equally large number of Docker users. There are now 7.3 million total Docker Hub accounts, up approximately 45% year-over-year. It’s great to see more and more developers signing up for a Free, Pro or Team subscription, underscoring the value they find in new subscription features we have rolled out such as audit logs, vulnerability scanning and higher rate limits. 

There are approximately 8.3 million application container image repos on Hub, representing a nearly 40% year-over-year increase in the application components that developers rely on to build apps. Docker Hub remains the world’s largest library and community for trusted, high-quality images and we are so proud of its growth. This rich content is one of the reasons that JFrog decided to partner with us, as premium access to Docker Official Images was strategic to their customers. 

Installations of Docker Desktop have now reached 3.3 million, which is a year-over-year increase of approximately 38%. This underscores the importance of giving developers choice and meeting them where they are. Docker Desktop remains unique in the market as the leading platform for developers working locally on their desktop, accelerating inner loop development speed. 

Docker has been hard at work continuing to release features that make life easier for developers so that they can get back to the fun part of their work – building and sharing awesome apps. You can expect the next Docker Index to be released mid-year after DockerCon Live 2021 with a fresh set of usage and growth stats fueled by our amazing users! 

For further reading, check out Part 1 and Part 2 of the top Docker blog posts of 2020 and this post on 2021 developer trends and predictions by Docker CEO Scott Johnston.
The post Docker Index Shows Continued Massive Developer Adoption and Activity to Build and Share Apps with Docker appeared first on Docker Blog.
Quelle: https://blog.docker.com/feed/

AWS Graviton2 M6g-, C6g- und R6g-Instances jetzt in den Regionen Asien-Pazifik (Seoul, Hongkong) und M6gd-, C6gd- und R6gd-Instances jetzt in den Regionen EU (Frankfurt) und Asien-Pazifik (Singapur, Sydney) verfügbar

Ab heute sind Amazon EC2 M6g-, C6g- und R6g-Instances in den Regionen Asien-Pazifik (Seoul) und Asien-Pazifik (Hongkong) verfügbar. Zusätzlich sind Amazon EC2 M6gd-, C6gd- und R6gd-Instances mit lokalem NVMe-basiertem SSD-Speicher jetzt in den Regionen EU (Frankfurt), Asien-Pazifik (Singapur) und Asien-Pazifik (Sydney) verfügbar.
Quelle: aws.amazon.com

AWS Solutions Implementation – AWS Data Streaming Solution for Amazon MSK fügt eine Vorlage hinzu, mit der Sie aus einer Streaming-Anwendung Ereignisse lesen und Daten in Amazon S3 speichern können

Das AWS Solutions-Team hat kürzlich die
AWS Streaming Data Solution for Amazon MSK aktualisiert, eine AWS Solutions-Implementierung, die eine automatisierte Konfiguration der AWS-Services bietet, die für die einfache Erfassung, Speicherung, Verarbeitung und Bereitstellung von Streaming-Daten erforderlich sind. Dieses Update fügt eine Vorlage hinzu, die die Entwicklung von Streaming-Daten-Arbeitslasten beschleunigt, indem sie die Notwendigkeit reduziert, Ressourcen mit AWS CloudFormation zu modellieren und bereitzustellen, Amazon CloudWatch-Alarme, -Dashboards und -Protokolle einzurichten und bewährte Verfahren für Streaming-Daten in AWS manuell zu implementieren.

Quelle: aws.amazon.com

Application Load Balancer bietet jetzt Unterstützung für Application Cookie Stickiness

Application Load Balancer (ALB) bietet jetzt Unterstützung für anwendungsbasierte Cookie Stickiness Mit dieser neuen Funktion können Kunden sicherstellen, dass sich Clients für die Dauer ihrer Sitzung mithilfe von Anwendungs-Cookies mit demselben Load-Balancer-Ziel verbinden. Auf diese Weise können Kunden ein konsistentes Client-Server-Erlebnis mit umfassenderen Kontrollmöglichkeiten erzielen, z. B. die Flexibilität, benutzerdefinierte Cookie-Namen und Kriterien für die Client-Ziel-Stickiness innerhalb einer Zielgruppe festzulegen.
Quelle: aws.amazon.com

Sie können PartiQL mit DynamoDB zum Abrufen, Einsetzen, Aktualisieren und Löschen von Tabellendaten in Amazon DynamoDB verwenden

DynamoDB lokal unterstützt jetzt PartiQL (eine SQL-kompatible Abfragesprache), sodass Sie DynamoDB-Tabellendaten abfragen, einfügen, aktualisieren und löschen können. PartiQL wird für alle Operationen auf der DynamoDB-Datenebene unterstützt und kann so dazu beitragen, die Produktivität von Entwicklern dank Verwendung einer vertrauten, strukturierten Abfragesprache zur Durchführung dieser Operationen zu verbessern. Entwickler können PartiQL verwenden, um Anwendungen zu entwickeln und sie offline zu testen, bevor sie der Produktion bereitgestellt werden.
Quelle: aws.amazon.com