What’s new in Kubernetes 1.20?
sysdig.com – Kubernetes 1.20 is about to be released! And it comes packed with novelties. Here is the detailed list of what’s new in Kubernetes 1.20.
Quelle: news.kubernauts.io
sysdig.com – Kubernetes 1.20 is about to be released! And it comes packed with novelties. Here is the detailed list of what’s new in Kubernetes 1.20.
Quelle: news.kubernauts.io
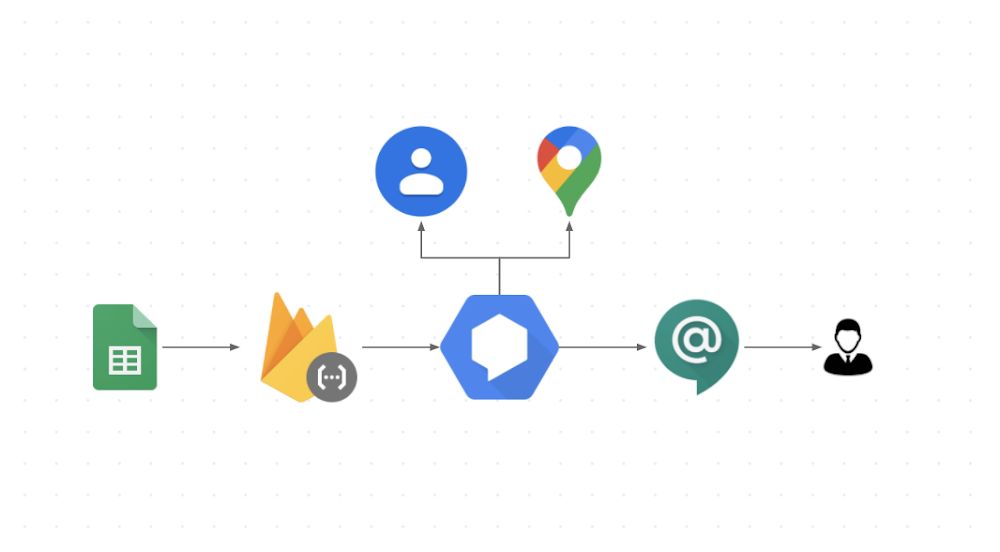
In today’s world, where online collaborative work is crucial and maintaining productivity is key, chatbots have an important role to play. Why chatbots? Workers frequently need to incorporate information from external sources in their communications, and chatbots can help them find that information all in one place. In this post we’ll walk you through a bot that was inspired by a real use case here at Google. In large companies such as Google, it can be difficult to find out which person is responsible for a specific product area. When customer teams have a question they often have to go through many ad hoc trackers such as the one here in Sheets (sample scrubbed data) to find answers. When you are on the go a lot, this gets even harder, especially if you don’t remember the Sheets URL and how to use it to find your answer. Instead of sifting through a spreadsheet, what if you could just send a chat message to see who to contact for networking or security expertise? That’s where the integration between Dialogflow and Google Chat comes in! It helps reduce context switching for users, because they can ask their questions right within Google Chat, addressing a bot built in Dialogflow that integrates with the Sheets API to find answers. Let’s see how it works!If you’d rather watch than read, we share the entire process in this video:How does it work?When a user asks a question in Google Chat, the bot that is initiated integrates with Dialogflow to facilitate natural conversations. Dialogflow, in turn, integrates with a backend database or Sheets (as shown in the image) via a Cloud Functions fulfillment. Extracting the information from Google SheetsTo extract the information from Sheets we first need to know exactly what information is relevant to fulfill a request. After identifying the pieces of information we need, we use the Sheets API to extract them. Defining the input phrasesWhile it would be easier to write a basic bot that requires the input to be formatted in a predetermined order, such a bot would be difficult to use. Users would have to remember the order and always spell everything correctly. And if a tool is too hard to use, people aren’t going to use it.The key to chatbot adoption is usability, and that means the ability to handle phrases that occur in natural conversation, like these: “Who is on Gmail for data management?””I would like to know the data management guru “”Tell me who is the data management specialist”This is where Dialogflow comes in. Dialogflow is a natural language understanding platform that simplifies the design and integration of conversational user experiences for mobile apps, web apps, bots, and more. We built our bot in three easy steps, which should look familiar to you if you’ve completed the Deconstructing Chatbots video series. Step 1: Define the entitiesDialogflow uses models trained on natural conversation. Before we can use these models, however, our bot needs to know the key phrases in our context, such as the role types, skills, and account names (e.g., Account Specialist, Gmail, and Security).Step 2: Configure the intentsAn intent is essentially the user’s question. This is where we define how to use the entities we just created by defining Actions and Parameters. When we add the bot to a room, the intent is where the response comes from.Actions and ParametersThe entities you define are used in configuring your actions and parameters. In this case, Roles, Skills, and Accounts are all required parameters for this intent to be fulfilled (and the user can provide these in any order they like). If a user forgets one, we define a prompt to get it from the user. Training phrases Because different people talk differently, we use training phrases to provide different examples of user requests. Dialogflow uses a pretrained NLP model, and these training phrases are the realistic questions that help train a specific model for our use case.Step 3: Set up fulfillment codeFulfillment is where we glue everything together, connecting all the APIs in a Node.js Firebase function. In this case, we use the Sheets API but you can connect to any backend you choose. Refer to the sample code for details.One-click integration Dialogflow integrates with many popular conversation platforms like Google Chat, Google Assistant, Slack, and more. Direct end-user interactions are handled for you, so you can focus on building your agent. Each integration handles end-user interactions in a platform-specific way, so see the documentation for your integration platform for details. ConclusionBuilding a chatbot that integrates Google Chat, Dialogflow, and Sheets (or another data source) is straightforward. For more details, watch our Integrate Dialogflow with Google Chat video, where we talk in more depth about the process, and check out the full source code on GitHub. Want to learn more about building chat and voice applications using Dialogflow? We’ve created an entire video series on Deconstructing Chatbots that will take you from zero to hero in no time!For more cloud content follow us on Twitter @pvergadia and @srivas_dev.Related ArticleConversational AI drives better customer experiencesConversational AI takes contact centers into a new era of customer service.Read Article
Quelle: Google Cloud Platform

Toyota will ein E-SUV auf den Markt bringen, das auf der neuen e-TNGA-Plattform basiert, die die Japaner für viele Autos einsetzen wollen. (Toyota, Technologie)
Quelle: Golem

Als IT-Trainee (m/w/d) mit Fokus IT oder IT-Beratung haben Berufseinsteiger die Möglichkeit, den Weg in eine digitale und agile Allianz mitzugestalten. (Ausbildung)
Quelle: Golem

Playstation 5, XBox Series X/S oder Nintendo Switch? Golem.de hat sich mit Konsolen und Ökosystemen auseinandergesetzt und bietet Beratung für die Weihnachtseinkäufe. Von Peter Steinlechner (Playstation 5, Microsoft)
Quelle: Golem

Google stellt die selbst entwickelte Fuzzing-Engine Atheris als Open Source zur Verfügung. (Softwareentwicklung, Google)
Quelle: Golem

Es eignet sich zur 2D-Darstellung oder zur Videowiedergabe in Servern per VGA-Anschluss. (PC-Hardware, Grafikhardware)
Quelle: Golem
The post Lens 4.0 Kubernetes IDE is here appeared first on Mirantis | Pure Play Open Cloud.
There’s been a lot of excitement around here about Lens lately. And why not? With more than 1.3 million downloads and close to 10,000 stars on Github since its inception in March 2020, Lens has quickly become the world’s most popular IDE for Kubernetes, and with release of Lens 4.0, that’s likely to not just continue, but accelerate.
In particular, large enterprises are beginning to see the true value of Lens. Many of them feel the complexity of Kubernetes is slowing down adoption, preventing them from seeing the container ROI they were expecting.
Lens is a user-friendly desktop application for all your kubernetes platforms. It enables users to easily onboard and operate their applications in Kubernetes, improving time to market and productivity, and increasing ROI. It is a standalone application for MacOS, Windows, and Linux operating systems, and an open source project that dramatically simplifies application development for Amazon EKS, Google GKE, Microsoft AKS, Mirantis Container Cloud, Red Hat Openshift, and other CNCF-certified Kubernetes distributions.
In fact, we’re so excited about the quality and value of Lens that we’ve added it to the lineup of products for which we provide commercial support and services.
Enterprise Support, Training and Services for Lens
Mirantis is the biggest contributor to, and in the driver’s seat of, the Lens open source project, and with all our know-how and insights into the Lens IDE user base, we have designed a suite of value-added services to help enterprises in their journey towards adopting, integrating, and unlocking the full potential of Lens at scale. With these value-added services, enterprises using Lens will enjoy faster time to market, productivity and ROI for their container infrastructure investments. These value-added services include:
Technical Support: Just like for any other enterprise-grade solution, you’ll be able to get professional technical support to help you through any problems that you encounter, whether you’re running on Windows, MacOS, or Linux, with a first response time of 4 business hours.
Professional Services: We’ve seen how powerful Lens can be in remaking the way your developers create the software that runs your business, but as they say, “with great power comes great responsibility.” Mirantis provides professional services to ensure that your Lens deployments comply with any IT governance or guardrails you have in place, and we can help you create your own custom extensions to help Lens give you even more of a leg up over the competition.
Training: Mirantis Training provides private operator or developer track courses, and even training in extensions development.
Have we piqued your curiosity? Schedule a demo to see what Lens can do.
Lens 4.0 New Features
The strength of the Lens Kubernetes IDE is in the way in which it takes managing Kubernetes clusters and workloads and the many, many, MANY objects and settings they involve and makes it not just straightforward, but simple. As Miska Kaipiainen, senior director of engineering and principal of the Lens open source project says in the community’s blog announcing the new release, “These users are using Lens because it provides the full situational awareness for everything that runs in Kubernetes. It’s lowering the barrier of entry for people just getting started and radically improving productivity for people with more experience.”
Lens 4.0, which was released a few days ago, takes that utility to the next level with the addition of the Extensions API. The Extensions API means that any company, vendor, or individual developer can create plugins for Lens, enabling a seamless experience between their products and Kubernetes clusters.
We have been working with our partners and friends in the cloud native ecosystem to refine Lens 4.0 extension API capabilities. Some of these vendors have already made their first extensions available for public use, while others are still iterating. In the near future, you can look forward to extensions from companies such as:
Ambassador Labs (formerly Datawire)
Aqua Security
Carbon Relay
Carbonetes
Clastix
Eagle AI
Kong
nCipher
Nu Skin International
StackRox
Wohlig Transformation
You can also create a Lens extension of your own or become a partner. To learn more, join us next Tuesday, December 15, when the Lens Kubernetes IDE User Group is hosting a virtual workshop, How to Build a Lens Extension.
Meanwhile, we want to congratulate the Lens community on this milestone, and remind you to watch this space for more information on creating extensions of your own!
If you haven’t tried Lens yet, check out the Getting Started with Lens blog.
The post Lens 4.0 Kubernetes IDE is here appeared first on Mirantis | Pure Play Open Cloud.
Quelle: Mirantis
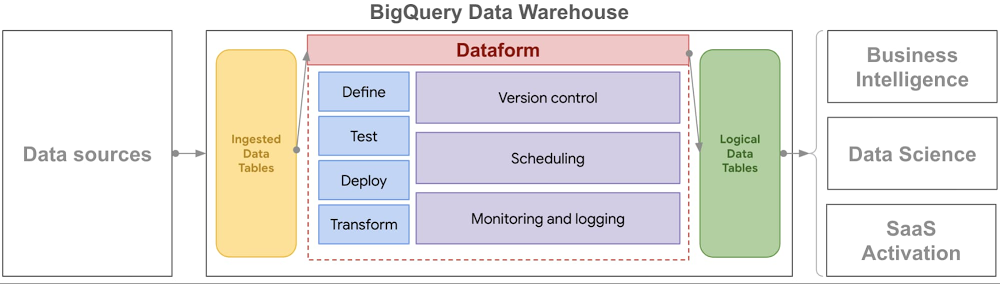
The value of data—and the insights it contains—only continues to grow, and Google has invested in technologies to empower teams to do more with that data for more than a decade. We were honored to be named a Leader in Gartner’s first-ever Magic Quadrant for Cloud Database Management Systems (DBMS). BigQuery, our cloud data warehouse, continues to be a place where an increasing number of enterprises across every industry turn to make sense of all this growing data.Today, we’re making this work even easier for our customers with our acquisition of Dataform. Dataform leverages BigQuery’s innovative architecture, allowing for practically unlimited scale, to enable analysts and engineers to manage all their data processes within BigQuery. This combination means you can leverage software development best practices to define, document, test and deploy data transformations using SQL executed within BigQuery. There’s no need to learn new programming languages or deploy and manage entirely new applications in your data stack. You can now create and manage your data transformations all within your comfortable, secure and reliable data warehouse.Click to enlargeDataform brings a software engineering approach to data modeling and pipelines making data transformations more accessible and reliable:Collaborate and create data pipelines—Develop data workflows in SQL and collaborate with others via Git. Include data documentation that is automatically visible to others.Deploy data pipelines—Keep logical data up-to-date by scheduling data workflows which incrementally update downstream datasets, reducing cost and latency.Ensure data quality—Define data quality checks in SQL and automatically receive alerts when those checks fail. View logs, version history and dependency graphs to understand changes in data.We’re excited to welcome Dataform to Google Cloud as we continue to deliver on our mission to democratize insights across organizations. Today, we are making Dataform free to all users and moving forward we are looking forward to bringing the best of Dataform and BigQuery together. You can learn more by visiting dataform.co.Gartner, Magic Quadrant for Cloud Database Management Systems, November 23, 2020, Donald Feinberg, Adam Ronthal, Merv Adrian, Henry Cook, Rick Greenwald. Gartner does not endorse any vendor, product or service depicted in its research publications and does not advise technology users to select only those vendors with the highest ratings or other designation. Gartner research publications consist of the opinions of Gartner’s research organization and should not be construed as statements of fact. Gartner disclaims all warranties, expressed or implied, with respect to this research, including any warranties of merchantability or fitness for a particular purpose.
Quelle: Google Cloud Platform

While working on the Project Delta team, an early stage moonshot at X that was exploring new technologies to solve the pervasive problems of food waste and food insecurity, we worked closely with Kroger and Feeding America to transform and analyze datasets using Google Cloud.In this blog, we’ll talk about the technical effort of data un-siloing. (Check out this post for more on the overall project.) Before data can tell powerful stories, it needs to be made accessible, transformed and formatted so data sets can be joined, then reviewed with industry experts to surface underlying industry-specific relationships. Getting to the data: Automating flows into a shared data archipelagoMuch of the food system in the U.S. still operates on paper printouts and spreadsheets. While these ways of capturing, analyzing and communicating data have increased the pace and scale of business over time, they do bring limits. As disparate organizations look to work together and share vast amounts of data in real time, emailing spreadsheets back and forth no longer suffices. Kroger is a longtime historic partner of Feeding America—the two organizations have worked together for four decades. As part of a nationwide retail donation program, Kroger stores regularly set aside food to be donated and Feeding America member food banks coordinate pickups and distribute the food in their communities through pantries.As part of their company-wide Zero Hunger, Zero Waste initiative, Kroger sought to make more of their vast donation and waste database. Leading the industry, in 2017 Kroger publicly committed to donating 3 billion meals by 2025 and were keen to find as many donation opportunities as possible across their network of 2,700-plus stores nationwide. To do so, they wanted to find deeper patterns in their own store data and also in the food charity data of their food banking partners pertaining to Kroger’s donation patterns. As the first retail organization in this data-unsiloing partnership, Kroger offered to share their shrink data on a daily basis. Shrink is the loss of grocery store inventory due to imperfection, spoilage, and other factors. Any item not sold to a customer is denoted as shrink and earmarked for donation, animal feed, compost, or landfill. Scan loss data represents the subset of shrink that is formally logged. While Kroger uses this information extensively across divisions internally, this was the first time they worked with two external partners. Collaborating closely with Kroger’s business intelligence and IT teams, the Kroger Zero Hunger, Zero Waste leadership team navigated Kroger’s hybrid multi-cloud system. The path of least organizational and technical resistance to get the X team a daily data snapshot was to send an automated nightly email with an attached data file from each of their 20 operating store divisions. Processing incoming dataWith all those emails containing data files coming in, the team needed a way to process and load the data for shaping and analysis. The X team chose BigQuery, Google Cloud’s enterprise data warehouse, for its scalability and speed. To hold and process incoming emails automatically, the team set up a Cloud Storage bucket. When a new file is added to the bucket, a Pub/Sub notification triggers a Cloud Function to load the data into BigQuery automatically. Processed files in the root bucket are then archived into a “completed” folder if successfully loaded into BigQuery or into an “error” folder if incomplete for any reason.Flow chart for ingesting and organizing incoming data every day.The team did this in two steps:1. Set up triggers and notifications: Pub/Sub notifications can be set up directly from the Pub/Sub section of the cloud console. An appropriate topic was created. Then, the team configured the Cloud Storage bucket to call the Pub/Sub topic when a new data file is added to the bucket. This can be done via the command line in Cloud Shell.2. Set up Cloud Function: The Pub/Sub will trigger the Cloud Function to be invoked and move the data to BigQuery. The function’s code is stored in Cloud Source Repositories and was written in Python with accompanying SQL templates. The code processes spreadsheet files into a dataframe using Pandas, then writes the dataframe into BigQuery using the BigQuery Python Client library. Making data consistent: Getting to a common languageThe food system lacks a common standardized language, an ontological and semantic infrastructure that everyone can baseline to and build from. Professor Matt Lange of UC Davis, who’s leading efforts toward an “Internet of Food,” often references the healthcare system, where conditions and diseases are clearly classified and coded, with a structure that drives, informs and supports all financial and operational activity in the sector. Nothing close to that exists for food.After building data pipelines to Feeding America and Kroger, the X team’s first task was to confront disparities in food descriptors head on. How does one name a tomato, describe it, quantify it, and locate it? How do we represent a clamshell container of tomatoes consistently across all datasets from all parties? Even within one organization, there were dialects and different ways of talking about and representing the same thing. Feeding America is a nationwide network of 200 independent food banks, all with their own origin stories, practices, and non-corresponding IT systems. The X team, as humans, could understand what a data record from a food bank represented, but accurately linking those records across food banks was very difficult. As an example, even something as simple as the name of the state of Texas was logged in 27 different ways! This was common throughout the data: for storage facilities, for example, one food bank may refer to their refrigerators as REFR, while another might use REFER. Pinpointing food locationsWith a vision of matching excess food supplies to where they are most needed, the partnership prioritized standardizing the geolocation of all data records. Where a particular quantity of food originated directly impacted the recommendation of where it could go, since transporting perishable food requires time, money and in certain cases, temperature control. Many records from Feeding America member food banks were filled with descriptive titles for their staff and useful for manual operations, but that was difficult for a computer to understand. For example, a retail donation from “Kroger on Main St.” makes sense to a tenured driver who has been picking up from that store for a decade, but this descriptor needed to be decoded and matched with Kroger’s description in its own donation data record that lists the same store as Store #123.Using Google Maps Platform, the first step was to identify the Place ID for each of Kroger’s approximately 2,700 stores, given a list of addresses. Google Maps Platform includes Place IDs, which uniquely identify a location, for more than 200 million places around the world. In parallel, food bank location descriptors like “Kroger on Main St. Frisco, AZ” were also converted into Place IDs using the Maps API search-based querying function. Beyond this, the food banks participating in the initial phase of this data effort serve over 18,000 pantries collectively. The partnership was keen to fully explore geospatial opportunities in the entire system, and agreed to include these locations as well. This enabled the team to not only map the flow of food from a Kroger store to the local food bank and then to the pantry, but also explore network route optimization opportunities broadly. Using these Place IDs helped give us a common language.When working with the food bank data, however, normalizing places was not always as straightforward as querying Maps API. While different food banks might get food from the same suppliers, these suppliers were often represented in each food bank’s database differently. Because of typos or incomplete addresses, the Maps API could return the wrong place or not be able to find a result. To reconcile these entries, the team built an algorithm to determine the confidence that two places were the same before assigning a unique ID to the location. This extensive effort resulted in a comprehensive picture of suppliers and pantries in the charitable food network.Seen in isolation, three pantries pick up food from a local Fry’s (Kroger) store.Those same three pantries also reach many other stores across the community.Finally, the partnership recognized that food insecurity is shaped by poverty, employment, and various demographic variables and sought to include this in the analysis. To bring in these variables, the team used the US Census API to find the block groups, statistical divisions of census tracts containing about 600 to 3,000 people, for each food bank and pantry location. This opened the door to easily bring in thousands of state and federal datasets, helping tell a richer story to stakeholders about the needs of specific communities. Shared maps bring humans and things together in the right place. In the case of mapping in the food system, they enable the more effective use of food and the associated transportation and labor resources. Mapping all the nodes in our food system has never been more important in these pandemic times, where there is still an abundance of food—just unevenly distributed. Knowing where that food is located is step number one. Visualizing data: Show and tell the storyAs part of a network of 200 independent food banks, each with its own network of hundreds of pantries, each Feeding America member food bank can speak to their work, but there is no way yet to see real-time food flows in the network nationwide. This is a common theme for industry groups and organizational networks; focusing closely on specific trees can make it easy to lose sight of the forest as a whole.One of the team’s first visuals was simply to show where food banks were getting their food from on a map. Food banks can find donated food anywhere and they do sometimes purchase food to supplement what they have received. This can mean that, if the right opportunity comes, they can acquire food from far away. There has been talk among food banks for many years about how routing might be made more efficient, but each can only see their part of the story; none is equipped to optimize a national logistics network. After moving the data from multiple food banks out of their silos, the Feeding America and X team worked together to plot the flows in Looker. The network is quite complex even with just a few food banks (see below). While this visual is easy to create and shows data that each food bank already had, the impact is in seeing the forest. There are tremendous opportunities to make more of every food bank dollar by pooling purchasing and optimizing routing. This visual is messy and not necessarily immediately actionable, but it was a powerful tool for gaining buy-in for building a national data warehouse at Feeding America. Leaders at the national office and food banking executives saw this visualization and immediately understood the purpose and potential benefits.Supplier flows into seven participating food banks.Tracking physical flows over timeWhile Kroger and Feeding America have partnered for more than 40 years, Kroger does not see where their donated food goes after it is picked up from a store. The store may receive confirmation from their food bank partner that 100 pounds was picked up a few weeks later, but Kroger did not have a way to track individual food items all the way through the food chain.To visualize these flows, the team first reconciled all of Kroger’s stores with the food bank representation of these stores. This made it possible to track inventory records in Store 123 from Kroger’s data and compare them to donation records the food bank recorded from Store 123. Next, the food received into the food banks was traced as it moved through their inventory. Food banks, particularly in grocery rescue and food drive programs, will verify food is safe to eat and then likely aggregate it to make more useful shipments. For example, 20 different cans of mixed vegetables that came in from different stores may be combined into a case of food for a local pantry. From this work, Kroger was able to see for the first time the ways that their donations help touch entire communities. When volunteers picked up food at Kroger stores, they broke the donation up, recombined it with others, and then sent it out to hundreds of small pantries. Even fairly small donations were coming together with others from across the community to make a huge impact, reaching hundreds of pantries and distribution points.Food flows from a Kroger store in Arizona through a food bank and to pantries.Solving enormous, large-scale problems like hunger starts with exploring data in new ways and visualizing for stakeholders the current state of flows geospatially and with respect to time. No single Kroger store was going to solve hunger in its community; no single organization was going to solve hunger across the country. Each contribution comes together to make a collective positive impact. Data, visualized well, tells the story of the work already underway, and invites others to join the mission, inspiring action in the right time and place. Putting data siloing into practiceWhen starting on a large multi-stakeholder data un-siloing initiative, be prepared for a journey with unexpected twists and turns. It is rarely straightforward to go from raw, disparate, datasets to integrated and impactful analytics. As you persist through obstacles—getting data out of silos, making it consistent, and visualizing it to tell stories—remember that this effort can fundamentally reshape your business and industry in positive ways. If you’d like to learn more and donate to these efforts, check out:Kroger’s Zero Hunger Zero Waste FoundationFeeding AmericaSt. Mary’s Food BankThe X and Google team would like to thank Kroger, Feeding America, its member food banks, and St. Mary’s Food Bank for their contributions to this article.Related ArticleThe democratization of insights: Empowering data analysts and business usersWe explore how what it means to be “data-driven” has changed over time, and how Google Cloud is helping customers push those boundaries t…Read Article
Quelle: Google Cloud Platform






