Extensions for connectivity and new data types now available in Cloud SQL for PostgreSQL

Open source database PostgreSQL is designed to be easily extensible through its support of extensions. When an extension is loaded into a database, it can function just like features that are built-in. This adds additional functionality to your PostgreSQL instances, allowing you to use enhanced features in your database on top of the existing PostgreSQL capabilities.Cloud SQL for PostgreSQL has added support for more than ten extensions this year, allowing our customers to leverage the benefits of Cloud SQL managed databases along with the extensions built by the PostgreSQL community.We introduced support for these new extensions to enable access to foreign tables across instances using postgres_fdw, remove bloat from tables and indexes and optionally restore the physical order of clustered indexes (pg_repack), manage pages in memory from PostgreSQL (pgfincore), inspect the contents of database pages at a low level (pageinspect), examine the free space map, the visibility map and page-level visibility info using pg_freespacemap and pg_visibility, use a procedural language handler (PL/proxy) to allow remote procedural calls among PostgreSQL databases, and support postgresql-hll data type.Now, we’re adding extensions to support connectivity within databases and to support new data types that make it easier to store and query IP addresses and phone numbers.New extension: dblinkdblink functionality is complementary to the cross-database connectivity capabilities we introduced earlier this year as PL/Proxy and postgres_fdw extensions. Depending on your database architecture, you might come across situations when you need to query data outside of your application’s database or query the same database with an independent transaction (autonomous) within a local transaction. Dblink allows you to query remote databases and provide you more flexibility and better connectivity in your environment.You can use dblink as part of a SELECT statement for every SQL statement that returns results. For repetitive queries and future use, we recommend creating a view to avoid multiple code modifications in case of changes in connection string or name info.With dblink available now, we still recommend in most use cases to keep the data you need to query under the same database and leverage schemas as possible due to complexity and performance overheads. Another alternative is to use the postgres_fdw extension for more transparency, standards compliance, and better performance.New data types: Ip4r and prefixInternet protocols IPv4 and IPv6 are both commonly used today; IPv4 is Internet Protocol Version 4, while IPv6 is the next generation of Internet Protocol allowing a broader range of IP addresses. IPv6 was introduced in 1998 with the purpose of replacing IPv4.Ip4r allows you to use six data types to store IPv4 and IPv6 addresses and address ranges. These data types provide better functionality and performance than the built-in inet and cidr data types. These data types can leverage PostgreSQL’s capabilities such as primary key, unique key, b-tree index, constraints, etc.prefix data type supports phone number prefixes, allowing customers with call centers and phone systems who are interested in routing calls and matching phone numbers and operators to store prefix data easily and perform operations efficiently. With prefix extension available, you can use prefix_range data type for table and index creation, cast function and query the table with the following operators: <=, <, =, <>, >=, >, @>, <@, &&, |, &Try out the new extensionsdblink, Ip4r and prefix extensions are now available for you to use along with the eight other supported extensions on Cloud SQL for PostgreSQL. Learn more about PostgreSQL extensions and what’s available.Related ArticlePreparing your MySQL database for migration with Database Migration ServiceRecently, we announced the new Database Migration Service (DMS) to make it easier to migrate databases to Google Cloud. DMS is an easy-to…Read Article
Quelle: Google Cloud Platform

Most popular public datasets to enrich your BigQuery analyses

From rice genomes to historical hurricane data, Google Cloud Public Datasets offer a world of exploration and insight. The more than 20 PB across 200+ datasets in our Public Dataset Program helps you explore big data and data analytics without a lot of cost, setup, or overhead. You can explore up to 1 TB per month at no cost, and you don’t even need a billing account to start using BigQuery sandbox. Joining public datasets with your own data gets you insights right away, such as adding location data for better transportation management or incorporating NOAA’s climate data into forecasting models. Retailers can use census demographics for market analysis, and analysts at those companies can map users with census block, zip code, and county boundary geometries.These datasets can help you start exploring and layering data points, and they also make data analytics a lot easier for enterprise customers. These utility datasets let you start with a set of valid, clean data, rather than having to start from scratch.You can access Google Cloud’s public datasets through BigQuery and Cloud Storage using either legacy or standard SQL queries. Researchers can also use BigQuery MLto train advanced machine learning models with this data right inside BigQuery at no additional cost. BigQuery GIS provides convenient, built-in capabilities to ingest, process, and analyze geospatial data when you want a location component in your data analysis.Here, we’ll explore some common datasets and how they’re used. Expanding access to data for healthcare and research. This year, COVID-19 public datasets have been incredibly important to researchers looking to understand and combat the virus. As the pandemic began in March, we announced an initial set of free public datasets to help researchers, data scientists, and analysts combat the coronavirus. These include the COVID-19 Open Data dataset, the Global Health Data from the World Bank, and OpenStreetMap data. The COVID-19 datasets are free to access and query through September 15, 2021. Looker customers can also install the COVID-19 block, which includes the Community Mobility Data Block, from the Marketplace, where they can accelerate their analyses of the public datasets using curated explore environments and purposeful dashboards. Anyone can go ahead and access the dashboards and explore environments here. The Looker Demographic data block contains demographic information from the American Community Survey.Building the right tools to bring COVID-19 data to all. Google Cloud and partner SADA also collaborated earlier this year on building the National Response Portal, an open data platform that combines multiple datasets for an on-the-ground view of the pandemic. The Oklahoma State Department of Health and governor’s office used COVID-19 public datasets and Looker data blocks to build a dashboard on the state website to monitor cases and update residents.Layering weather, climate, and GIS datasets for a better understanding of nature. Weather and climate are popular datasets to explore. Within BigQuery, you can explore climate simulation data from a collaboration with the Lamont-Doherty Earth Observatory of Columbia University and the Pangeo Project. In addition, the World Climate Research Programme released the Coupled Model Intercomparison Project Phase 6 (CMIP6) data archive. This dataset will be continuously updated and may eventually contain 20 PB of data. Other climate-related datasets include those from NOAA on lightning and hurricanes, and Looker’s Weather data block that contains daily weather reporting in the United States at the zip code level from 1920 until now. You can see how GlideFinder built a platform that ingests satellite data to monitor wildfires, using data characteristics like temperature. And here’s how to use a Colab notebook to analyze data on daily temperature readings from around the world. In Looker, users can leverage the weather block to analyze weather data and join it back onto their own data sources to get an entire picture of how climate may be impacting their business.Using genomics data to improve food security. Our rice genome dataset derives from the Rice 3K dataset, which analyzes genetic variation, population structure, and diversity among more than 3,000 diverse Asian cultivated rice genomes. Our researchers then used DeepVariant to re-analyze that dataset with the goal of improving food security by speeding up genetic enhancement to increase rice crop yield. Get to know cryptocurrencies using blockchain datasets. Our Public Datasets Program includes a set of cryptocurrency blockchain datasets, so you can start to better understand this modern concept. The datasets consist of the blockchain transaction history of Bitcoin and Ethereum, plus others, and you’ll also find a set of queries and views to enable multi-chain meta analysis and integration with conventional financial record processing systems. Putting public datasets to useWe’re always interested to hear all the ways that analysts and researchers use public datasets to further understanding of so many different causes and topics. 2020 has brought fascinating, hopeful stories of how data has helped fight COVID-19, including our COVID-specific datasets and other public health datasets. Google Cloud has been able to help with COVID-19 academic research by offering high-performance compute and other technology resources along with public datasets. One important note is that the contents of these datasets are provided to the public strictly for educational and research purposes only. We are not onboarding or managing PHI or PII data as part of our COVID-19 public datasets. Google has practices and policies in place to ensure that data is handled in accordance with widely recognized patient privacy and data security policies.What will you do with public datasets on BigQuery? Dive into the BigQuery sandbox to get started. Have an idea for a dataset? Add it to our request tracker.Learn more: Get started with geospatial data exploration in this beginner’s guide to BigQuery GIS.Explore Looker’s blocks here and request a demo to learn moreSee how a cross-industry team of AI practitioners ramped up data use to fight COVID.Check out the latest Kaggle competitions to test your skills.Related ArticleCOVID-19 public dataset program: Making data freely accessible for better public outcomesExplore valuable public health data related to COVID-19 with free public datasets, available in Google Cloud’s BigQueryRead Article
Quelle: Google Cloud Platform

Introducing a new dashboard creation experience in Cloud Monitoring

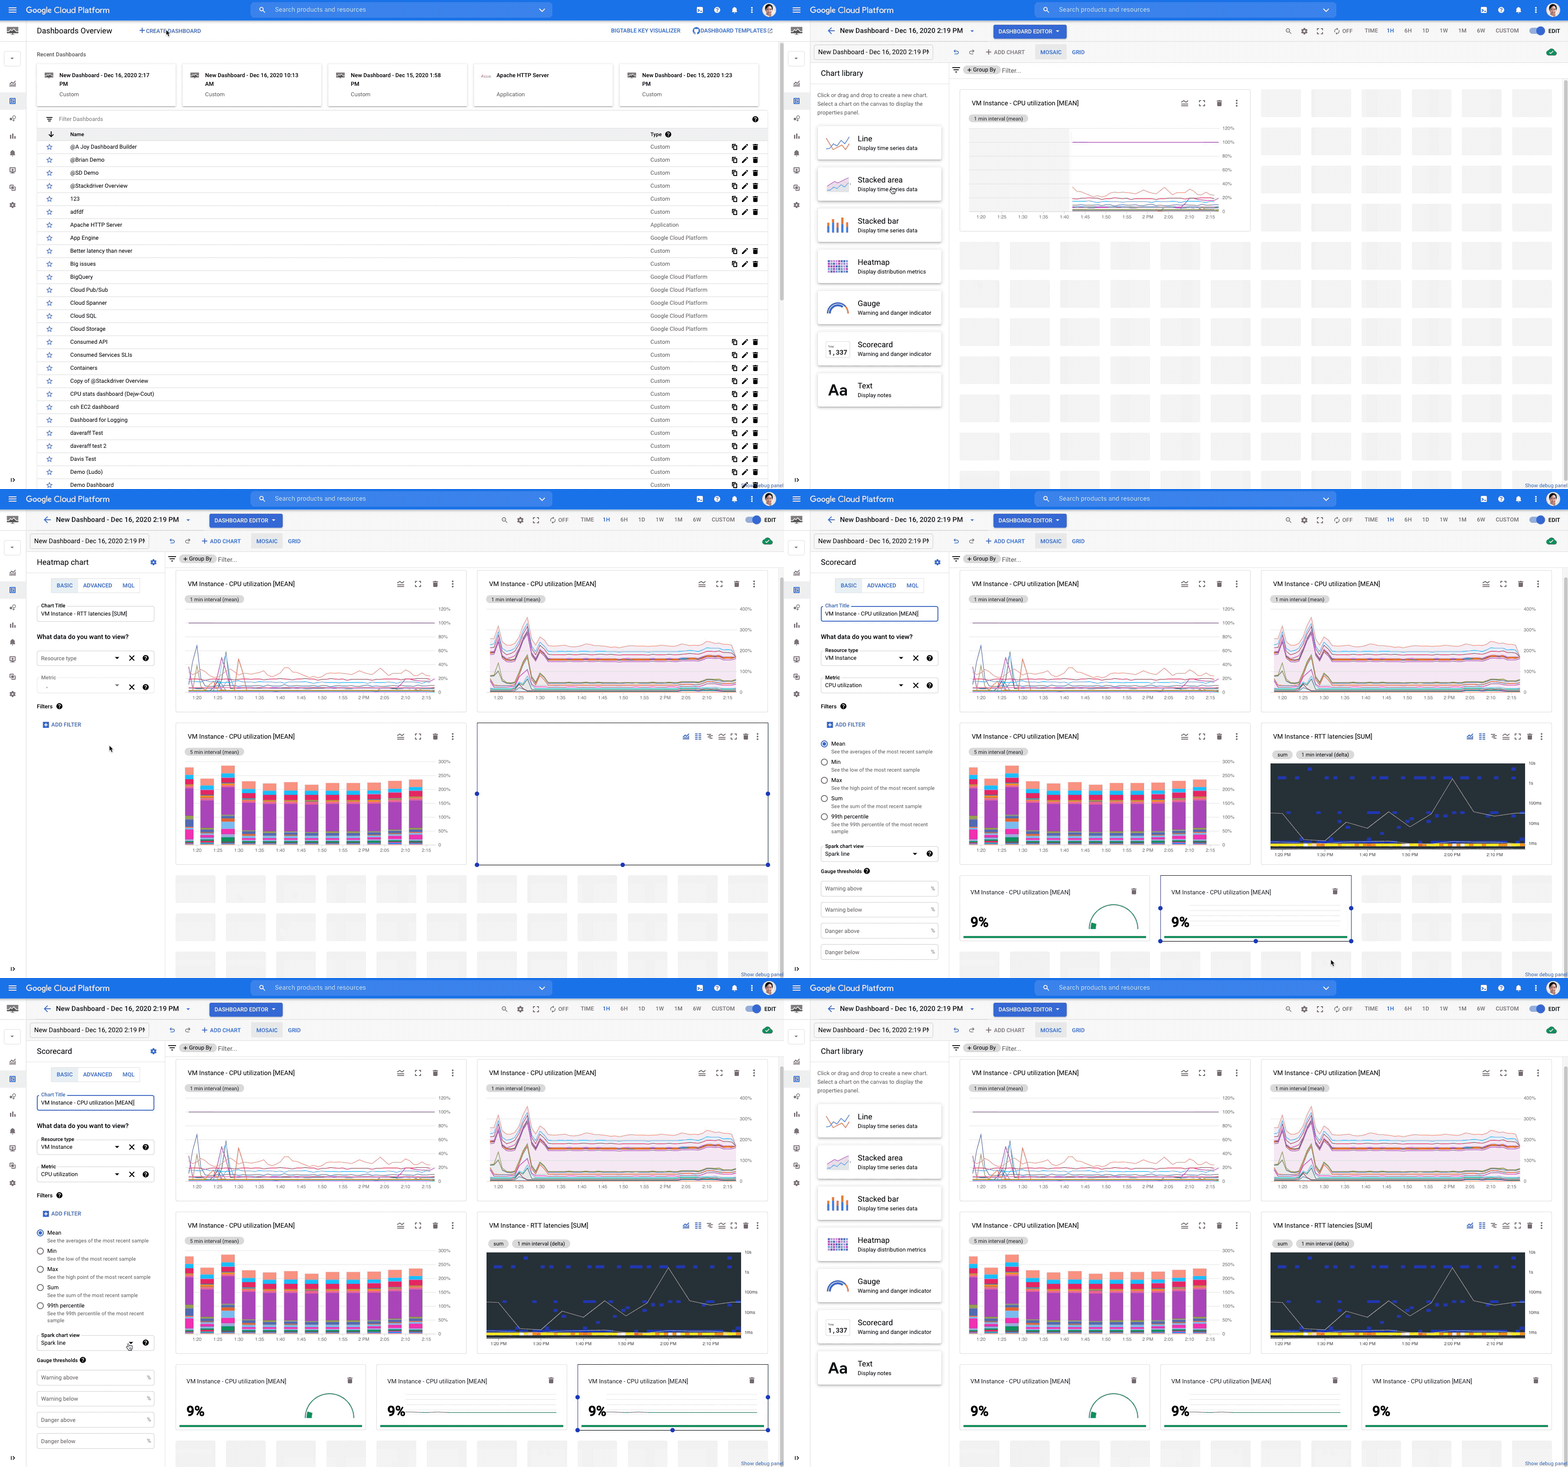
Having good observability is vital to the health of your cloud infrastructure and applications, and a key element to using that information effectively is being able to create dashboards with relevant metrics.Today we are announcing a new dashboard creation experience from Cloud Monitoring that allows you to generate a greater variety of visualization types, introduces better flexibility for dashboard layouts, and makes data manipulation easier so you can create dashboards that better fit your needs.So, what’s new with the dashboard?More flexibilityWith this update Cloud Monitoring now supports a mosaic layout with drag-n-drop charts that are easier to resize. Charts can be arranged in whatever position is most convenient for you with just a few clicks of your mouse. We also increased the total number of charts from 25 to 40 per dashboard.New component typesThree new component types are now available in the dashboard creation UI: gauge, scorecard and text. These new types join the existing four: line, stacked area, stacked bar, and heatmap.On a gauge chart you can display a single value for time-series data to assess the performance of that value. For example, the chart below displays how much of the CPU is being utilized by all VMs averaged across the entire project. You can use other aggregation types like Min and Max. You can also specify the warning or danger threshold ranges for the chart to change colors.The scorecard chart also allows you to display a single value. However, unlike a gauge chart, it tracks the value over time:In a text component, you can use markdown to link to another dashboard, a playbook, an incident page or a specific instance ID so you can get yourself around faster. For example, to add a link to the Google Cloud Console, the markdown is [Google Cloud Platform] (https://console.cloud.google.com/) as in the screenshot below. You can also place multiple text charts as line breaks to separate sections on your dashboard.Advanced visualization configurationsIn addition to these new features, we are introducing an advanced configuration capability and adding Monitoring Query Language (MQL) support for almost all visualization types. Cloud Monitoring’s basic mode has settings that should capture most of your needs so you can visualize your time series without requiring any complex configuration. If your data visualization requires more than a basic configuration, you can use advanced mode, which supports custom aggregations and multiple time series on one chart. Using MQL, you can perform calculations between metrics to generate a ratio of time-series or apply other advanced queries to reveal deeper insights from your data.Backwards compatibilityWith all these updates, you may be wondering if you’ll still be able to view and edit all your previous dashboards with the new editor? The answer is yes. Additionally, the new editor allows you to perform much more advanced data processing, for example preprocessing metrics of the distribution value type (a bucket of numeric values) into a single numeric value within one simple click.These exciting new dashboard creation features are available by default today. Just go to the Google Cloud Console,  navigate to the monitoring dashboard section and try it out! We can’t wait to hear from you about your experience and feedback!Related ArticleHigh-resolution user-defined metrics in Cloud MonitoringNow you can write custom and Prometheus metrics for Cloud Monitoring every 10 secondsRead Article
Quelle: Google Cloud Platform

How to automatically scale your machine learning predictions

Historically, one of the biggest challenges in the data science field is that many models don’t make it past the experimental stage. As the field has matured, we’ve seen MLOps processes and tooling emerge that have increased project velocity and reproducibility. While we’ve got a ways to go, more models than ever before are crossing the finish line into production.That leads to the next question for data scientists: how will my model scale in production? In this blog post, we will discuss how to use a managed prediction service, Google Cloud’s AI Platform Prediction, to address the challenges of scaling inference workloads.Inference WorkloadsIn a machine learning project, there are two primary workloads: training and inference. Training is the process of building a model by learning from data samples, and inference is the process of using that model to make a prediction with new data.Typically, training workloads are not only long-running, but also sporadic. If you’re using a feed-forward neural network, a training workload will include multiple forward and backward passes through the data, updating weights and biases to minimize errors. In some cases, the model created from this process will be used in production for quite some time, and in others, new training workloads might be triggered frequently to retrain the model with new data.On the other hand, an inference workload consists of a high volume of smaller transactions. An inference operation essentially is a forward pass through a neural network: starting with the inputs, perform matrix multiplication through each layer and produce an output. The workload characteristics will be highly correlated with how the inference is used in a production application. For example, in an e-commerce site, each request to the product catalog could trigger an inference operation to provide product recommendations, and the traffic served will peak and lull with the e-commerce traffic.Balancing Cost and LatencyThe primary challenge for inference workloads is balancing cost with latency. It’s a common requirement for production workloads to have latency < 100 milliseconds for a smooth user experience. On top of that, application usage can be spiky and unpredictable, but the latency requirements don’t go away during times of intense use.To ensure that latency requirements are always met, it might be tempting to provision an abundance of nodes. The downside of overprovisioning is that many nodes will not be fully utilized, leading to unnecessarily high costs.On the other hand, underprovisioning will reduce cost but lead to missing latency targets due to servers being overloaded. Even worse, users may experience errors if timeouts or dropped packets occur.It gets even trickier when we consider that many organizations are using machine learning in multiple applications. Each application has a different usage profile, and each application might be using a different model with unique performance characteristics. For example, in this paper, Facebook describes the diverse resource requirements of models they are serving for natural language, recommendation, and computer vision.AI Platform Prediction ServiceThe AI Platform Prediction service allows you to easily host your trained machine learning models in the cloud and automatically scale them. Your users can make predictions using the hosted models with input data. The service supports both online prediction, when timely inference is required, and batch prediction, for processing large jobs in bulk.To deploy your trained model, you start by creating a “model”, which is essentially a package for related model artifacts. Within that model, you then create a “version”, which consists of the model file and configuration options such as the machine type, framework, region, scaling, and more. You can even use a custom container with the service for more control over the framework, data processing, and dependencies.To make predictions with the service, you can use the REST API, command line, or a client library. For online prediction, you specify the project, model, and version, and then pass in a formatted set of instances as described in the documentation.Introduction to scaling optionsWhen defining a version, you can specify the number of prediction nodes to use with the manualScaling.nodes option. By manually setting the number of nodes, the nodes will always be running, whether or not they are serving predictions. You can adjust this number by creating a new model version with a different configuration.You can also configure the service to automatically scale. The service will increase nodes as traffic increases, and remove them as it decreases. Auto-scaling can be turned on with the autoScaling.minNodes option. You can also set a maximum number of nodes with autoScaling.maxNodes.  These settings are key to improving utilization and reducing costs, enabling the number of nodes to adjust within the constraints that you specify.Continuous availability across zones can be achieved with multi-zone scaling, to address potential outages in one of the zones. Nodes will be distributed across zones in the specified region automatically when using auto-scaling with at least 1 node or manual scaling with at least 2 nodes.GPU SupportWhen defining a model version, you need to specify a machine type and a GPU accelerator, which is optional. Each virtual machine instance can offload operations to the attached GPU, which can significantly improve performance. For more information on supported GPUs in Google Cloud, see this blog post: Reduce costs and increase throughput with NVIDIA T4s, P100s, V100s.The AI Platform Prediction service has recently introduced GPU support for the auto-scaling feature. The service will look at both CPU and GPU utilization to determine if scaling up or down is required.How does auto-scaling work?The online prediction service scales the number of nodes it uses, to maximize the number of requests it can handle without introducing too much latency.  To do that, the service:Allocates some nodes (the number can be configured by setting the minNodes option on your model version) the first time you request predictions. Automatically scales up the model version’s deployment as soon as you need it (traffic goes up).Automatically scales it back down to save cost when you don’t (traffic goes down).Keeps at least a minimum number of nodes (by setting the minNodes option on your model version) ready to handle requests even when there are none to handle.Today, the prediction service supports auto-scaling based on two metrics: CPU utilization and GPU duty cycle. Both metrics are measured by taking the average utilization of each model. The user can specify the target value of these two metrics in the CreateVersion API (see examples below);  the target fields specify the target value for the given metric; once the real metric deviates from the target by a certain amount of time, the node count adjusts up or down to match.How to enable CPU auto-scaling in a new modelBelow is an example of creating a version with auto-scaling based on a CPU metric. In this example, the CPU usage target is set to 60% with the minimum nodes set to 1 and maximum nodes set to 3. Once the real CPU usage exceeds 60%, the node count will increase (to a maximum of 3).  Once the real CPU usage goes below 60% for a certain amount of time, the node count will decrease (to a minimum of 1).  If no target value is set for a metric, it will be set to the default value of 60%.REGION=us-central1using gcloud: gcloud beta ai-platform versions create v1 –model ${MODEL}  –region ${REGION}  –accelerator=count=1,type=nvidia-tesla-t4   –metric-targets cpu-usage=60  –min-nodes 1 –max-nodes 3  –runtime-version 2.3 –origin gs://<your model path> –machine-type n1-standard-4 –framework tensorflowcurl example:curl -k -H Content-Type:application/json -H “Authorization: Bearer $(gcloud auth print-access-token)” https://$REGION-ml.googleapis.com/v1/projects/$PROJECT/models/${MODEL}/versions -d@./version.jsonversion.jsonUsing GPUs Today, the online prediction service supports GPU-based prediction, which can significantly accelerate the speed of prediction. Previously, the user needed to manually specify the number of GPUs for each model. This configuration had several limitations:To give an accurate estimate of the GPU number, users would need to know the maximum throughput one GPU could process for certain machine types. The traffic pattern for models may change over time, so the original GPU number may not be optimal. For example, high traffic volume may cause resources to be exhausted, leading to timeouts and dropped requests, while low traffic volume may lead to idle resources and increased costs.To address these limitations, the AI Platform Prediction Service has introduced GPU based auto-scaling.Below is an example of creating a version with auto-scaling based on both GPU and CPU metrics. In this example, the CPU usage target is set to 50%, GPU duty cycle is 60%, minimum nodes are 1, and maximum nodes are 3. When the real CPU usage exceeds 60% or the GPU duty cycle exceeds 60% for a certain amount of time, the node count will increase (to a maximum of 3). When the real CPU usage stays below 50% or GPU duty cycle stays below 60% for a certain amount of time, the node count will decrease (to a minimum of 1).  If no target value is set for a metric, it will be set to the default value of 60%. acceleratorConfig.count is the number of GPUs per node. REGION=us-central1gcloud Example:gcloud beta ai-platform versions create v1 –model ${MODEL}  –region ${REGION}  –accelerator=count=1,type=nvidia-tesla-t4   –metric-targets cpu-usage=50  –metric-targets gpu-duty-cycle=60  –min-nodes 1 –max-nodes 3  –runtime-version 2.3 –origin gs://<your model path> –machine-type n1-standard-4 –framework tensorflowCurl Example: curl -k -H Content-Type:application/json -H “Authorization: Bearer $(gcloud auth print-access-token)” https://$REGION-ml.googleapis.com/v1/projects/$PROJECT/models/${MODEL}/versions -d@./version.jsonversion.jsonConsiderations when using automatic scalingAutomatic scaling for online prediction can help you serve varying rates of prediction requests while minimizing costs. However, it is not ideal for all situations. The service may not be able to bring nodes online fast enough to keep up with large spikes of request traffic. If you’ve configured the service to use GPUs, also keep in mind that provisioning new GPU nodes takes much longer than CPU nodes. If your traffic regularly has steep spikes, and if reliably low latency is important to your application, you may want to consider setting a low threshold to spin up new machines early, setting minNodes to a sufficiently high value, or using manual scaling.It is recommended to load test your model before putting it in production. Using the load test can help tune the minimum number of nodes and threshold values to ensure your model can scale to your load. The minimum number of nodes must be at least 2 for the model version to be covered by the AI Platform Training and Prediction SLA.The AI Platform Prediction Service has default quotas enabled for service requests, such as the number of predictions within a given period, as well as CPU and GPU resource utilization. You can find more details on the specific limits in the documentation. If you need to update these limits, you can apply for a quota increase online or through your support channel.Wrapping upIn this blog post, we’ve shown how the AI Platform Prediction service can simply and cost-effectively scale to match your workloads. You can now configure auto-scaling for GPUs to accelerate inference without overprovisioning.If you’d like to try out the service yourself, we have a sample notebook which demonstrates how to deploy a model and configure auto-scaling settings. The AI Platform Prediction documentation also provides a thorough walkthrough of how to use the service and its configuration options.Related ArticleAI Platform Prediction goes GA with improved reliability & ML workflow integrationAI Platform Prediction goes GA with enhanced reliability & ML workflow integration.Read Article
Quelle: Google Cloud Platform

Connecting with the Docker Community– Recap of Our First Community All Hands

Last week, we held our first Community All Hands and the response was phenomenal. A huge thank you to all 1,100+ people who joined. If you missed it, you can watch the recording here. You can also find answers to those questions that came in towards the end that we didn’t have time to answer here.

This all-hands was an effort to further deepen our engagement with the community and bring users, contributors and staff together on a quarterly basis to share updates on what we’re working on and what our priorities are for 2021 and beyond. The event was also an opportunity to give the community direct access to Docker’s leadership and provide a platform to submit questions and upvote those that are most relevant and important to people. 

The overwhelming piece of feedback we got from attendees was that the event was too short and people would have loved to see more demos. We certainly had a packed agenda and we did our best to squeeze in as much into an hour. For our next one (in February 2021!), we’ll aim to extend the event by 30 minutes and include more live demos. We’ll also try to make it more interactive and give additional time to answer more questions. If you have any other ideas on how we can improve the all-hands and make it more engaging, don’t hesitate to send me a note on our community slack (@William). 

Community events are a key pillar of our community-building strategy and we look forward to experimenting with new types of events like this one to continue pushing for more participation, openness and engagement. Onwards!
The post Connecting with the Docker Community– Recap of Our First Community All Hands appeared first on Docker Blog.
Quelle: https://blog.docker.com/feed/