Die AWS Snow Family-Konsole vereinfacht die Übertragung von Snow-Daten sowie die Erstellung und Verwaltung von Rechenaufgaben weiter

Die AWS Snow Family-Konsole wurde erweitert, um Ihnen das Erstellen und Überwachen Ihrer Snow-Datenübertragungs- und Rechenaufgaben zu erleichtern. Neben einer verbesserten Benutzererfahrung können Sie mit der AWS Snow Family-Konsole leichter nachvollziehen, welches Snow-Gerät je nach Größe und Art Ihrer Workloads für Ihren Anwendungsfall besser geeignet ist. Sie können jetzt auch ein Gerät der AWS Snow-Familie mit nur wenigen Klicks in der AWS Snow Family-Konsole bestellen.
Quelle: aws.amazon.com

Amazon Fraud Detector bietet die Möglichkeit, laufende Modelltrainings abzubrechen

Amazon Fraud Detector ist ein vollständig verwalteter Service, der es einfach macht, potenziell betrügerische Online-Aktivitäten wie Online-Zahlungsbetrug und die Erstellung gefälschter Konten zu identifizieren, mit benutzerdefinierten Machine Learning (ML)-Modellen. Mit nur wenigen Klicks können Sie ein Betrugserkennungsmodell erstellen und trainieren, ohne dass zuvor Machine Learning erforderlich ist.
Quelle: aws.amazon.com

Cloud Profiler provides app performance insights, without the overhead

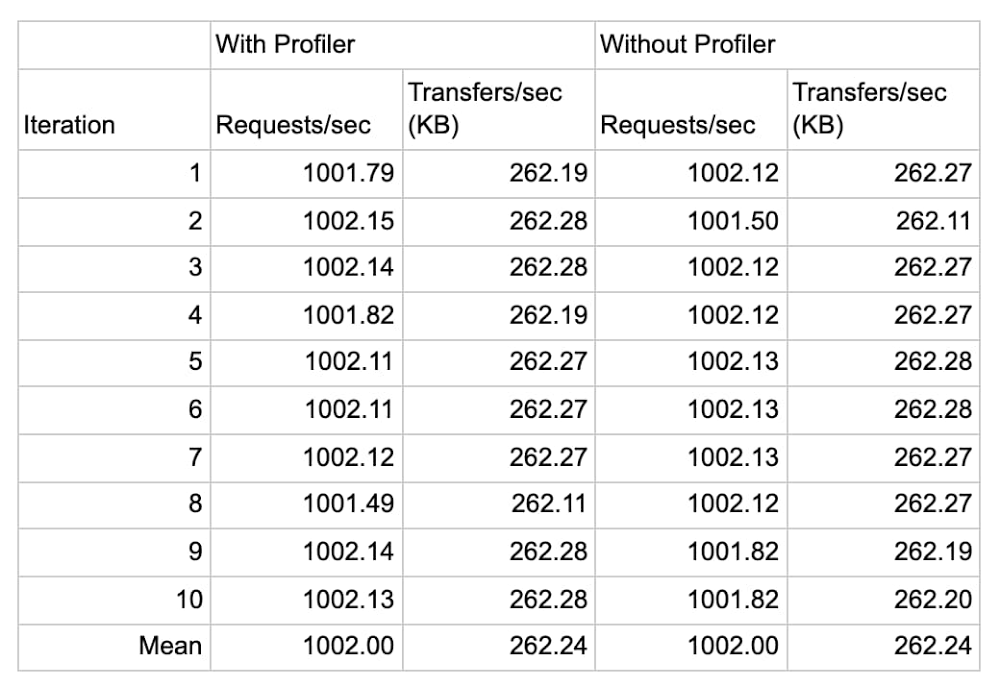
Do you have an application that’s a little… sluggish? Cloud Profiler, Google Cloud’s continuous application profiling tool, can quickly find poor performing code that slows your app performance and drives up your compute bill. In fact, by helping you find the source of memory leaks and other errors, Profiler has helped some of Google Cloud’s largest accounts reduce their CPU consumption by double-digit percentage points. What makes Profiler so useful is that it aggregates production performance data over time from all instances of an application, while placing a negligible performance penalty on the application that you are examining—typically less than 1% CPU and RAM overhead on a single profiled instance, and practically zero when it’s amortized over the full collection duration and all instances of the service!In this blog post, we look at elements of Profiler’s architecture that help it achieve its light touch. Then, we demonstrate the negligible effect of Profiler on an application in action by using DeathStarBench, a sample hotel reservation application that’s popular for testing loosely coupled microservices-based applications. Equipped with this understanding, you’ll have the knowledge you need to enable Profiler on those applications that could use a little boost. Profiler vs. other APM toolsTraditionally, application profiling tools have imposed a heavy load on the application, limiting the tools’ usefulness. Profiler, on the other hand, uses several mechanisms to ensure that it doesn’t hurt application performance. Sampling and analyzing aggregate performanceTo set up Profiler, you need to link a provided language-specific library to your application. Profiler uses this library to capture relevant telemetry from your applications that can then be analyzed using the user interface of the tool. Cloud Profiler supports applications written in Java, Go, Node.js and Python.Cloud Profiler’s libraries sample application performance, meaning that they periodically capture stack traces that represent the CPU and heap consumption of each function. This behavior is different from an event-tracing profiler, which intercepts and briefly halts every single function call to record performance information. To ensure your service’s performance is not impacted, Profiler carefully orchestrates the interval and duration of the profile collection process. By aggregating data across all of the instances of your application over a period of time, Profiler can provide a complete view into production code performance with negligible overhead.Roaming across instancesThe more instances of each service from which you capture profiles, the more accurately Cloud Profiler can analyze your codebase. While each Profiler library / agent uses sampling to reduce the performance impact on a running instance, Profiler also ensures that only one task in a deployment is being profiled at a given time. This ensures that your application is never in a state where all instances are being sampled at the same time.Profiler in actionTo measure the effect of Profiler on an application, we used it with an application with known performance characteristics, the DeathStarBench hotel reservation sample application. The DeathStarBench services were designed to test the performance characteristics of different kinds of infrastructure, service topologies, RPC mechanisms, and service architecture on overall application performance, making them an ideal candidate for these tests. While this particular benchmark is written in Go and uses the Go profiling agent, we expect results for other languages to be similar, since Profiler’s approach to sampling frequency and profiling is similar for all languages that it supports.In this example, we ran the eight services that compose the hotel reservation application on a GCE c2-standard-4 (4 vCPUs, 16 GB memory) VM instance running Ubuntu 18.04.4 LTS Linux and configured the load generator for two series of tests: one at 1,000 queries per second, and one at 10,000. We then performed each test 10 times with Profiler attached to each service and 10 times without it, and recorded the service’s throughput and the CPU and memory consumption in Cloud Monitoring. Each iteration ran for about 5 minutes, for a total of about 50 minutes for 10 iterations.The following data shows the result of the 1,000 QPS run:In the first test we observe that Profiler introduces a negligible increase in CPU (less than 0.5%) consumption and a minor increase in memory consumption, averaging to roughly 32 MB (3.7%) of additional RAM usage across eight services, or just under 4 MB per service. The following data shows the result of the 10,000 QPS run:In the second test, we see that Profiler’s only impact on application is in line with the previous observations that the increase in memory consumption is roughly 23 MB (2.8%) of memory, or 3MB per service, and a negligible increase in CPU (less than 0.5%) consumption.In both tests, the increase in memory usage can be attributed to the increase in the application’s binary size after linking with the Profiler agent.In exchange, you gain deep insight into code performance, down to each function call, as shown here for the hotel reservation application:Here we use Profiler to analyze the memory usage of the benchmark’s “frontend” service. We utilize Profiler’s weight filter and weight comparison features to determine the functions that increased their memory usage while the application scaled from 1,000 QPS to 10,000 QPS, which are highlighted in orange.ConclusionIn short, Profiler introduces no discernible impact on an application’s performance, and a negligible impact on CPU and memory consumption. And in exchange, it lets you continuously monitor the production performance of your services without affecting their performance or incurring any additional costs! That’s a win-win, in our book. To learn more about Profiler, be sure to read this Introduction to Profiler, and this blog about its advanced features. Related ArticleSee how your code actually executes with Stackdriver Profiler, now GACloud monitoring is now even better, as Stackdriver Profiler is now generally available from Google Cloud Platform (GCP).Read Article
Quelle: Google Cloud Platform

Eventarc: A unified eventing experience in Google Cloud

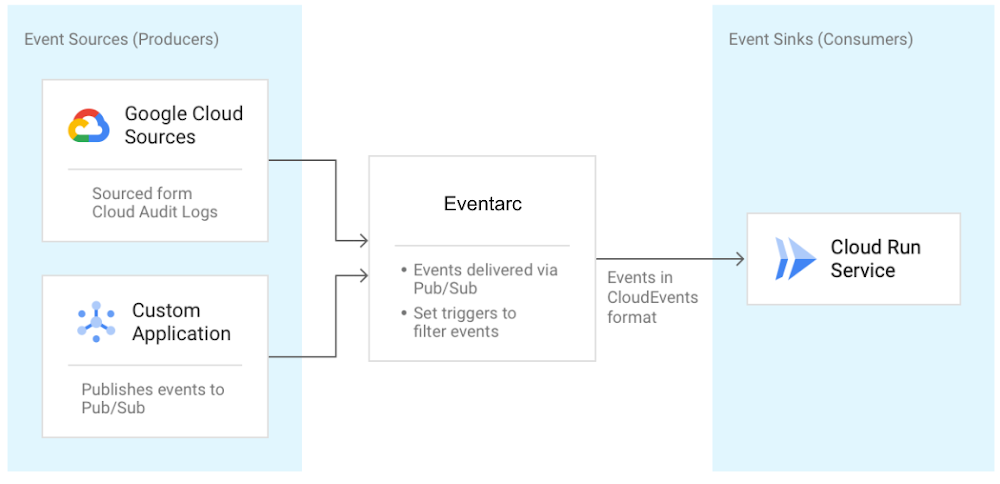
I recently talked about orchestration versus choreography in connecting microservices and introduced Workflows for use cases that can benefit from a central orchestrator. I also mentioned Eventarc and Pub/Sub in the choreography camp for more loosely coupled event-driven architectures. In this blog post, I talk more about the unified eventing experience by Eventarc. What is Eventarc?We announced Eventarc back in October as a new eventing functionality that enables you to send events to Cloud Run from more than 60 Google Cloud sources. It works by reading Audit Logs from various sources and sending them to Cloud Run services as events in CloudEvents format. It can also read events from Pub/Sub topics for custom applications.Getting events to Cloud RunThere are already other ways to get events to Cloud Run, so you might wonder what’s special about Eventarc? I’ll get to this question, but let’s first explore one of those ways, Pub/Sub.As shown in this Using Pub/Sub with Cloud Run tutorial, Cloud Run services can receive messages pushed from a Pub/Sub topic. This works if the event source can directly publish messages to a Pub/Sub topic. It can also work for services that have integration with Pub/Sub and publish their events through that integration. For example, Cloud Storage is one of those services and in this tutorial, I show how to receive updates from a Cloud Storage bucket using a Pub/Sub topic in the middle. For other services with no integration to Pub/Sub, you have to either integrate them with Pub/Sub and configure Pub/Sub to route messages to Cloud Run or you need to find another way of sourcing those events. It’s possible but definitely not trivial. That’s where Eventarc comes into play. Immediate benefits of Eventarc Eventarc provides an easier path to receive events not only from Pub/Sub topics but from a number of Google Cloud sources with its Audit Log and Pub/Sub integration. Any service with Audit Log integration or any application that can send a message to a Pub/Sub topic can be event sources for Eventarc. You don’t have to worry about the underlying infrastructure with Eventarc. It is a managed service with no clusters to set up or maintain. It also has some concrete benefits beyond the easy integration. It provides consistency and structure to how events are generated, routed, and consumed. Let’s explore those benefits next.Simplified and centralized routingEventarc introduces the notion of a trigger. A trigger specifies routing rules from event sources to event sinks. For example, one can listen for new object creation events in Cloud Storage and route them to a Cloud Run service by simply creating an Audit Log trigger as follows:If you want to listen for messages from Pub/Sub instead, that’s another trigger:This trigger creates a Pub/Sub topic under the covers. Applications can send messages to that topic and those messages are routed to the specified Cloud Run service by Eventarc. Users can also create triggers from Google Cloud Console under the triggers section of Cloud Run:By having event routing defined as triggers, users can list and manage all their triggers in one central place in Eventarc. Here’s the command to see all created triggers:gcloud beta eventarc triggers listConsistency with eventing format and librariesIn Eventarc, different events from different sources are converted to CloudEvents compliant events. CloudEvents is a specification for describing event data in a common way with the goal of consistency, accessibility and portability. A CloudEvent includes context and data about the event: Event consumers can read these events directly. We also try to make it easier in various languages (Node.js, Python, Go, Java, C# and more) with CloudEvents SDKs to read the event and Google Events libraries to parse the date field.Going back to our Cloud Storage example earlier, this is how you’d read Cloud Storage events via AuditLogs in Node.js using the two mentioned libraries:Similarly, this is how you’d read messages from a Pub/Sub trigger in C#: Long term visionThe long term vision of Eventarc is to be the hub of events from more sources and sinks, enabling a unified eventing story in Google Cloud and beyond.In the future, you can expect to read events directly (without having to go through Audit Logs) from more Google Cloud sources (eg. Firestore, BigQuery, Storage), Google sources (eg. Gmail, Hangouts, Chat), 3rd party sources (eg. Datadog, PagerDuty) and send these events to more Google Cloud sinks (eg. Cloud Functions, Compute Engine, Pub/Sub) and custom sinks (any HTTP target).  Now that you have a better overall picture of the current state and future vision for Eventarc:Check out Trigger Cloud Run with events from Eventarc for a hands-on codelab. Send us feedback on Eventarc and which sources and sinks you would value the most.As always, feel free to reach out to me on Twitter @meteatamel for questions.Related ArticleTrigger Cloud Run with events from more than 60 Google Cloud sourcesNow, you can invoke applications running on Cloud Run with events generated by over 60 Google Cloud services.Read Article
Quelle: Google Cloud Platform