Never forget there's a human behind every financial services product

With brand experience increasingly online and digital-native players entering the market, financial services institutions (FSIs) will need to adopt a human-centric design philosophy to remain relevant and build stronger ties with their customers. Financial services providers must keep the customer in mind as they design their product offerings. This is especially critical in Asia-Pacific, where more consumers are coming online and online sectors are seeing robust growth.In Southeast Asia alone, at least 40 million people connected to the internet for the first time in 2020 and one in three digital services are consumed by new users, according to the2020 eConomy SEA report released by Temasek Holdings, Google, and Bain & Company. The region’s online population has hit 400 million, and seven internet economy sectors, including digital financial services and e-commerce, will clock more than $100 billion in gross merchandise volume.Fuelled in part by the COVID-19 outbreak, the growth momentum is expected to continue with 90% of new online consumers indicating plans to continue using such services post-pandemic. In Southeast Asia, digital payments are expected to surpass US$1.2 trillion in gross transaction value by 2025, according to the e-Conomy SEA 2020 report. Adoption of online remittance services also climbed two-fold since safe distancing measures kicked into place, with online value predicted to account for up to 40% of the total value of these payment services by 2025.What customers expect from their financial services providersWith customers heading toward online platforms, traditional FSIs in the region that fail to transform quickly to ride the wave will be left behind and risk losing their foothold against their digital-savvy neobank competitors. As it is, 71% of Singapore consumers experience at least one pain point with their bank today. And amongst those with three or more pain points, 77% express an interest in opening a digital bank account, according to aPwC survey.Consumers want personalized, real-time engagements and FSIs need to understand their customers’ requirements to differentiate their brand experience and build loyalty.This can be particularly challenging in Asia, where customer segments are widely diverse. Online users speak multiple languages, live in developed or developing nations, and reside in communities that are either largely unbanked or highly tapped financially.FSIs will have to identify their targeted customer segments and figure out solutions they should offer to address these consumers’ different requirements, such as those living in rural areas versus those living in urbanized cities.It means they will require tools powered by artificial intelligence (AI) and data analysis to understand their customers’ needs and improve service experience accordingly. At the same time, they will need to drive down operational costs.Chatting up to better customer satisfactionThese shifts in consumer needs prompted insurance companyFWD Group to develop an AI chatbot with the aim to enhance customer service delivery, reduce operational spend, and drive its Asian expansion. It was critical that the chatbot, dubbed Enzo, had the ability to establish a more sophisticated understanding of human intent—the customers’ main objective when they key in a question or request.To achieve this, FWD tapped Google’s AI-powered contact center solutionDialogflow as well as machine learning text analysis toolNatural Language to create Enzo.Dialogflow, in particular, proved essential as it could interpret human intent in several languages, including slang. This was important since FWD had plans to expand its presence across Southeast Asia and the versatile language support would enable the company to do so more rapidly.Within two months of Enzo’s introduction in the Philippines, the chatbot had handled queries from more than 4,000 customers, bumping up FWD’s previous response capacity by 7%. Enzo also registered a customer rating of 4.5 stars out of 5, which was equivalent to the company’s live chat service rating. In addition, the insurance company is using Google’s Cloud Vision AI andAutoML to power its KYC (Know Your Customer) identity verification, enabling it to quickly determine the validity of a customer’s ID. The AI tools have improved FWD’s operational efficiencies by 20% and reduced identity verification costs by half.Forward-looking FSIs such as FWD have achieved strong business results primarily because they realize customers should be at the center of everything they do. For FWD, the ability to dynamically translate and analyze their customer interactions as well as understand the context of what they actually need, regardless of language, has proven especially valuable in this region.This type of customer understanding will go a long way towards creating stronger brand awareness and loyalty, particularly as digital transactions mean less human contact, and FSI customers increasingly use multiple service providers for their daily banking needs.Adopting human-centric design thinking ensures products and services will actually be relevant and beneficial to the customers they are designed to serve. It also empowers banks to differentiate the human experience in every interaction they facilitate.When an individual applies for a home loan, they do not simply want a loan; their ultimate objective here is to own a home. So rather than focus on providing a home loan, banks instead need to think about how to build their loan offerings around the customer’s desire to buy a house. And technology offerings are already emerging to make this easy for financial institutions, such as Google Cloud’s Lending DocAI. By tapping data and infusing machine learning to understand context, as well as adopting more agile practices, FSIs not only ensure they remain competitive against their digital-native counterparts and amid changing consumer expectations, but create more genuine and enduring bonds with customers.Learn more about Google Cloud for financial services.Related ArticleNew white paper: Strengthening operational resilience in financial services by migrating to Google CloudLearn how migrating to Google Cloud can play a critical role in strengthening operational resilience in the financial services sector.Read Article
Quelle: Google Cloud Platform
Churn prediction for game developers using Google Analytics 4 (GA4) and BigQuery ML

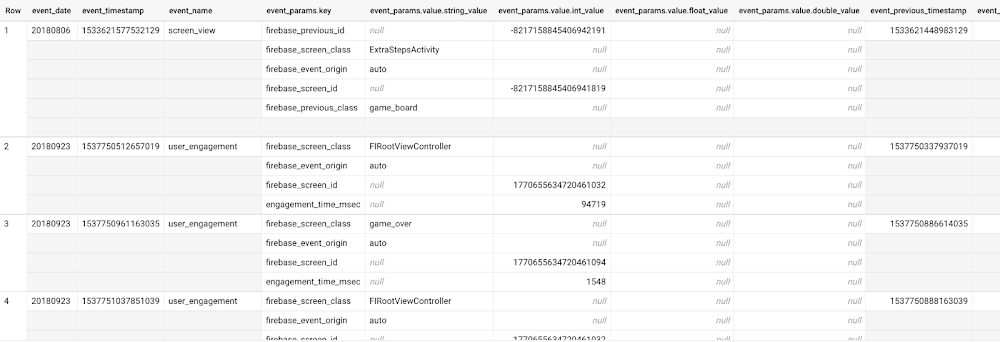
User retention can be a major challenge for mobile game developers. According to the Mobile Gaming Industry Analysis in 2019, most mobile games only see a 25% retention rate for users after the first day. To retain a larger percentage of users after their first use of an app, developers can take steps to motivate and incentivize certain users to return. But to do so, developers need to identify the propensity of any specific user returning after the first 24 hours. In this blog post, we will discuss how you can use BigQuery ML to run propensity models on Google Analytics 4 data from your gaming app to determine the likelihood of specific users returning to your app.You can also use the same end-to-end solution approach in other types of apps using Google Analytics for Firebase as well as apps and websites using Google Analytics 4. To try out the steps in this blogpost or to implement the solution for your own data, you can use this Jupyter Notebook. Using this blog post and the accompanying Jupyter Notebook, you’ll learn how to:Explore the BigQuery export dataset for Google Analytics 4Prepare the training data using demographic and behavioural attributesTrain propensity models using BigQuery MLEvaluate BigQuery ML modelsMake predictions using the BigQuery ML modelsImplement model insights in practical implementationsGoogle Analytics 4 (GA4) properties unify app and website measurement on a single platform and are now default in Google Analytics. Any business that wants to measure their website, app, or both, can use GA4 for a more complete view of how customers engage with their business. With the launch of Google Analytics 4, BigQuery export of Google Analytics data is now available to all users. If you are already using a Google Analytics 4 property, you can follow this guide to set up exporting your GA data to BigQuery.Once you have set up the BigQuery export, you can explore the data in BigQuery. Google Analytics 4 uses an event-based measurement model. Each row in the data is an event with additional parameters and properties. The Schema for BigQuery Export can help you to understand the structure of the data.  In this blogpost, we use the public sample export data from an actual mobile game app called “Flood It!” (Android, iOS) to build a churn prediction model. But you can use data from your own app or website. Here’s what the data looks like. Each row in the dataset is a unique event, which can contain nested fields for event parameters.This dataset contains 5.7M events from over 15k users.Our goal is to use BigQuery ML on the sample app dataset to predict propensity to user churn or not churn based on users’ demographics and activities within the first 24 hours of app installation.In the following sections, we’ll cover how to:Pre-process the raw event data from GA4Identify users & the label featureProcess demographic featuresProcess behavioral featuresTrain classification model using BigQuery MLEvaluate the model using BigQueryMLMake predictions using BigQuery MLUtilize predictions for activationPre-process the raw event dataYou cannot simply use raw event data to train a machine learning model as it would not be in the right shape and format to use as training data. So in this section, we’ll go through how to pre-process the raw data into an appropriate format to use as training data for classification models.This is what the training data should look like for our use case at the end of this section:Notice that in this training data, each row represents a unique user with a distinct user ID (user_pseudo_id). Identify users & the label featureWe first filtered the dataset to remove users who were unlikely to return the app anyway. We defined these ‘bounced’ users as ones who spent less than 10 mins with the app. Then we labeled all remaining users:churned: No event data for the user after 24 hours of first engaging with the app.returned: The user has at least one event record after 24 hours of first engaging with the app.For your use case, you can have a different definition of bounce and churning. Also you can even try to predict something else other than churning, e.g.:whether a user is likely to spend money on in-game currency likelihood of completing n-number of game levelslikelihood of spending n amount of time in-game etc.In such cases, label each record accordingly so that whatever you are trying to predict can be identified from the label column.From our dataset, we found that ~41% users (5,557) bounced. However, from the remaining users (8,031),  ~23% (1,883) churned after 24 hours:To create these bounced and churned columns, we used the following snippet of SQL code. You can view the Jupyter Notebook for the full query used for materializing the bounced and churned labels. Process demographic featuresNext, we added features both for demographic data and for behavioral data spanning across multiple columns. Having a combination of both demographic data and behavioral data helps to create a more predictive model. We used the following fields for each user as demographic features:geo.countrydevice.operating_systemdevice.languageA user might have multiple unique values in these fields — for example if a user uses the app from two different devices. To simplify, we used the values from the very first user engagement event.Process behavioral featuresThere is additional demographic information present in the GA4 export dataset, e.g. app_info, device, event_params, geo etc. You may also send demographic information to Google Analytics through each hit via user_properties. Furthermore, if you have first-party data on your own system, you can join that with the GA4 export data based on user_ids. To extract user behavior from the data, we looked into the user’s activities within the first 24 hours of first user engagement. In addition to the events automatically collected by Google Analytics, there are also the recommended events for games that can be explored to analyze user behavior. For our use case, to predict user churn, we counted the number of times the follow events were collected for a user within 24 hours of first user engagement: user_engagementlevel_start_quickplaylevel_end_quickplaylevel_complete_quickplaylevel_reset_quickplaypost_scorespend_virtual_currencyad_rewardchallenge_a_friendcompleted_5_levelsuse_extra_stepsThe following query shows how these features were calculated:View the notebook for the query used to aggregate and extract the behavioral data. You can use different sets of events for your use case. To view the complete list of events, use the following query:After this we combined the features to ensure our training dataset reflects the intended structure. We had the following columns in our table:User ID:user_pseudo_idLabel:churnedDemographic featurescountrydevice_osdevice_languageBehavioral featurescnt_user_engagementcnt_level_start_quickplaycnt_level_end_quickplaycnt_level_complete_quickplaycnt_level_reset_quickplaycnt_post_scorecnt_spend_virtual_currencycnt_ad_rewardcnt_challenge_a_friendcnt_completed_5_levelscnt_use_extra_stepsuser_first_engagementAt this point, the dataset was ready to train the classification machine learning model in BigQuery ML. Once trained, the model will output a propensity score between churn (churned=1) or return (churned=0) indicating the probability of a user churning based on the training data.Train classification model When using the CREATE MODEL statement, BigQuery ML automatically splits the data between training and test. Thus the model can be evaluated immediately after training (see the documentation for more information).For the ML model, we can choose among the following classification algorithms where each type has its own pros and cons:Often logistic regression is used as a starting point because it is the fastest to train. The query below shows how we trained the logistic regression classification models in BigQuery ML.We extracted month, julianday, and dayofweek  from datetimes/timestamps as one simple example of additional feature preprocessing before training. Using TRANSFORM() in your CREATE MODEL query allows the model to remember the extracted values. Thus, when making predictions using the model later on, these values won’t have to be extracted again. View the notebook for the example queries to train other types of models (XGBoost, deep neural network, AutoML Tables).Evaluate modelOnce the model finished training, we ran ML.EVALUATE to generate precision, recall, accuracy and f1_score for the model:The optional THRESHOLD parameter can be used to modify the default classification threshold of 0.5. For more information on these metrics, you can read through the definitions on precision and recall, accuracy, f1-score, log_loss and roc_auc. Comparing the resulting evaluation metrics can help to decide among multiple models.Furthermore, we used a confusion matrix to inspect how well the model predicted the labels, compared to the actual labels. The confusion matrix is created using the default threshold of 0.5, which you may want to adjust to optimize for recall, precision, or a balance (more information here).This table can be interpreted in the following way:Make predictions using BigQuery MLOnce the ideal model was available, we ran ML.PREDICT to make predictions. For propensity modeling, the most important output is the probability of a behavior occurring. The following query returns the probability that the user will return after 24 hrs. The higher the probability and closer it is to 1, the more likely the user is predicted to return, and the closer it is to 0, the more likely the user is predicted to churn.Utilize predictions for activationOnce the model predictions are available for your users, you can activate this insight in different ways. In our analysis, we used user_pseudo_id as the user identifier. However, ideally, your app should send back the user_id from your app to Google Analytics. In addition to using first-party data for model predictions, this will also let you join back the predictions from the model into your own data.You can import the model predictions back into Google Analytics as a user attribute. This can be done using the Data Import feature for Google Analytics 4. Based on the prediction values you can Create and edit audiences and also do Audience targeting. For example, an audience can be users with prediction probability between 0.4 and 0.7, to represent users who are predicted to be “on the fence” between churning and returning.For Firebase Apps, you can use the Import segments feature. You can tailor user experience by targeting your identified users through Firebase services such as Remote Config, Cloud Messaging, and In-App Messaging. This will involve importing the segment data from BigQuery into Firebase. After that you can send notifications to the users, configure the app for them, or follow the user journeys across devices.Run targeted marketing campaigns via CRMs like Salesforce, e.g. send out reminder emails.You can find all of the code used in this blogpost in the Github repository:https://github.com/GoogleCloudPlatform/analytics-componentized-patterns/tree/master/gaming/propensity-model/bqmlWhat’s next? Continuous model evaluation and re-trainingAs you collect more data from your users, you may want to regularly evaluate your model on fresh data and re-train the model if you notice that the model quality is decaying.Continuous evaluation—the process of ensuring a production machine learning model is still performing well on new data—is an essential part in any ML workflow. Performing continuous evaluation can help you catch model drift, a phenomenon that occurs when the data used to train your model no longer reflects the current environment. To learn more about how to do continuous model evaluation and re-train models, you can read the blogpost: Continuous model evaluation with BigQuery ML, Stored Procedures, and Cloud SchedulerMore resourcesIf you’d like to learn more about any of the topics covered in this post, check out these resources:BigQuery export of Google Analytics dataBigQuery ML quickstartEvents automatically collected by Google Analytics 4Qwiklabs: Create ML models with BigQuery MLOr learn more about how you can use BigQuery ML to easily build other machine learning solutions:How to build demand forecasting models with BigQuery MLHow to build a recommendation system on e-commerce data using BigQuery MLLet us know what you thought of this post, and if you have topics you’d like to see covered in the future! You can find us on Twitter at @polonglin and @_mkazi_.Thanks to reviewers: Abhishek Kashyap, Breen Baker, David Sabater Dinter.Related ArticleHow to build demand forecasting models with BigQuery MLWith BigQuery ML, you can train and deploy machine learning models using SQL. With the fully managed, scalable infrastructure of BigQuery…Read Article
Quelle: Google Cloud Platform

Captain Take 5 – Nuno do Carmo

Captain Take 5 – Nuno do Carmo

Docker Captains are select members of the community that are both experts in their field and are passionate about sharing their Docker knowledge with others. “Docker Captains Take 5” is a regular blog series where we get a closer look at our Captains and ask them the same broad set of questions ranging from what their best Docker tip is to whether they prefer cats or dogs (personally, we like whales and turtles over here). Today, we’re interviewing Nuno do Carmo who has been a Docker Captain since 2019. He is a Sr System Analyst for a pharmaceutical company based in Switzerland and he is based in Montreux.

How/when did you first discover Docker?

Back in 2015, I was hanging with friends and we would meet once a week to check on technologies and we found out a training on Pluralsight, given by a certain Nigel Poulton, and we decided to “temporarily” download it, **cough**.

Both the training method from Nigel and the technology of Docker were an instant hit for us. We started to learn as hobbyists and fast forward, I guess I took it more at heart than my friends, haha.

What is your favorite Docker command?

`docker run`, everything starts with a `docker run`. That first time that we launch “something”, we don’t know exactly what, it’s not VM and yet an instance with another OS is running.

Also, the power of simplicity from `docker run`, if the container image, network or volume do not exist, it creates it for us. We can start small from a `docker run -it alpine` to a way more complex command with ports, secrets, privileges.

Special mention to `docker app` and the whole CNAB community as it was the first time I contributed back to a project which used Docker (read below)

What is your top tip you think other people don’t know for working with Docker?

For the ones who know me, I’m a huge fan(boy) of Windows Subsystem for Linux (WSL) and while I do use Docker Desktop for Windows, I keep on reminding people who ask for help, that Docker on WSL2 can be installed like we would do in a native Linux OS.

Therefore we can have Docker Desktop running, let’s say with Windows Containers, and the Docker WSL2 running in parallel.

And special mention (yes, again) to `docker context` that makes it even easier to manage the whole setup.

What’s the coolest Docker demo you have done/seen?

Done, without hesitation, is the Docker to WSL2 distribution, which since then I have remixed a lot of times.

The demo consists in running a Docker container with almost any Linux based OS, export it as a compressed file and re-import it into WSL2 as a new distro.

I could automate it with a CNAB tool, called Porter.sh, and the community was so surprised (as it was not a use case initially intended for), that I got my first KubeCon invite to showcase it during a Day0 CNAB event led by another amazing Captain, Scott Coulton.

A massive thank you to the CNAB team and especially Carolyn Van Slyck, Ralf Squillace and Jeremy Rickard.

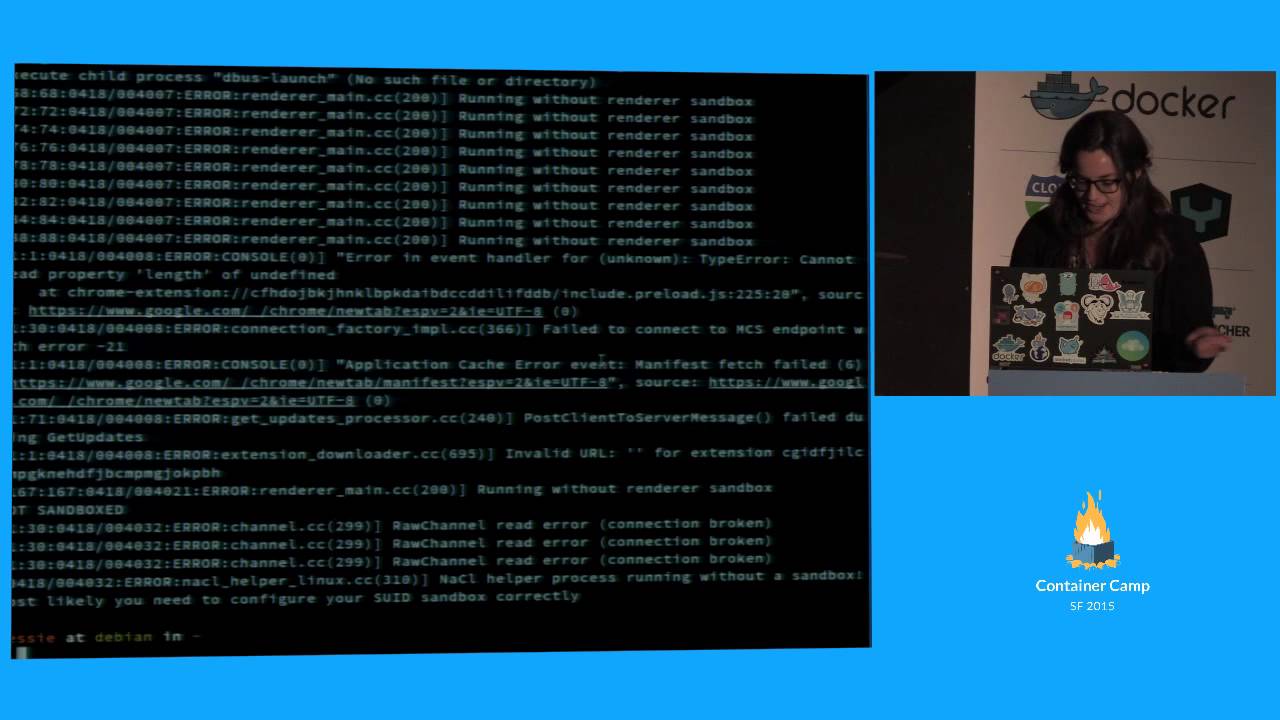
Seen, again without hesitation, it’s the demo from Jessie Frazelle called “Willy Wonka of Containers” (https://youtu.be/GsLZz8cZCzc).

This demo had such a huge impact on me and since then, 6 years later, I finally will be able to “mimic” it 100% in WSL2. That’s how much “in the future”, this demo was and Jessie is just incredible.

What have you worked on in the past six months that you’re particularly proud of?

Being a hobbyist (read: I do not work with Docker in my daily job), I can definitively say that I’m proud to have helped community members as a Captain and overall fan.

As for the technical part, I’m hard at work bringing rootless containers to WSL2 where, once again, I adapt the existing work of the great Akihiro Suda.

What do you anticipate will be Docker’s biggest announcement this year?

Docker Desktop for Linux, what else?

What do you think is going to be Docker’s biggest challenge this year?

These past years, Docker Inc (the company), needed to find its place in a Cloud Native world led by Kubernetes and associated projects.

I really think Scott Johnston has a very good vision, refocusing on what Docker does and speaks to best: the Developers.

Still, the road is not an easy one and this year I think Docker will be cementing its “new” position within the Cloud Native ecosystem.

What are some personal goals for the next year with respect to the Docker community?

Being a “new generation” of Captain, it’s always hard for me to believe I am in the same group as Legends that motivate me, still to this day, to use and enjoy Docker.

Being the “WSL Corsair”, I found my niche, and I simply would love to see more adoption of Docker Desktop for Windows with WSL2 backend.

Another point is to keep helping the Docker Windows containers side too. It’s there and my own impression is that it lacks some momentum right now. So bringing back the fire with the help of the community will be lots of fun.

What talk would you most love to see at DockerCon 2021?

Docker Desktop for Linux, what else? (bis)

But also, a lot of community members coming together and having fun, and maybe, why not, someone doing a crazy demo and motivating at least 1 person to become a Captain too in the future.

Looking to the distant future, what is the technology that you’re most excited about and that you think holds a lot of promise?

WSL2, and that’s not just the fanboy talking right now. Having the possibility to have a mix of two worlds, not colliding but merging, it’s just mind blowing.

In terms of hardware, even if ARM devices have existed for a long time, the Apple M1 really shook the world and the speed at which Software makers are porting their applications really opens a new ecosystem.

Rapid fire questions…

What new skill have you mastered during the pandemic?

Cooking new recipes

Cats or Dogs?

4 cats at home…

Salty, sour or sweet?

Salty

Beach or mountains?

I’m Portuguese living in Switzerland: both

Your most often used emoji?

  and

DockerCon Live 2021

Join us for DockerCon LIVE 2021 on Thursday, May 27. DockerCon Live is a free, one day virtual event that is a unique experience for developers and development teams who are building the next generation of modern applications. If you want to learn about how to go from code to cloud fast and how to solve your development challenges, DockerCon 2021 offers engaging live content to help you build, share and run your applications. Register today at https://dockr.ly/2PSJ7vn
The post Captain Take 5 – Nuno do Carmo appeared first on Docker Blog.
Quelle: https://blog.docker.com/feed/