Black History Month: Celebrating the success of Black founders with Google Cloud

February is Black History Month—a time for us to come together to celebrate and remember the important people and history of the African heritage. Over the next four weeks, we will highlight four Black-led startups and how they use Google Cloud to grow their businesses. Our first feature highlights TQIntelligence and its founder, Yared.As a psychologist, administrator, educator, and researcher, I’ve always wondered how we could use data to better serve children and adolescents who are being treated for trauma-related mental health disorders. Inspired by 20 years of experience focusing on poverty and trauma, I sought to rethink mental health services in low-income communities. This inspired me to found my startup TQIntelligence, which uses artificial intelligence and voice recognition technology to enable therapists to make more accurate diagnoses faster. Poverty and trauma—A double whammy for low-income communitiesPoverty and trauma are twofold blows. They go hand in hand, and quite often, one compounds the other. Children and adolescents in marginalized communities are at the highest risk for Adverse Childhood Experiences (ACE): traumatic events in childhood like abuse, neglect or violence, which lead to severe mental health disorders. These disorders impact children’s ability to learn and function on par with their peers. Severe ACEs can lead to mental impairments and an increased risk for suicide, and may inflict long-term adverse effects on children’s health and well-being into adulthood.Furthermore, a lack of quality health care exacerbates the trauma that low-income communities face, despite more than $500 billion in funding—the equivalent of nearly 4% of GDP per year on Medicare/Medicaid, Child Protective Services, and legal fees. This occurs primarily because therapists in low-income communities tend to be the least experienced in treating the most severe youth. Addressing these disparities in treatment outcomes requires innovation in the assessment and measurement of mental health disorder severity.TQIntelligence—Adding intelligence to mental healthcare with Clarity AIAt TQIntelligence, our goal is to enable therapists serving at-risk youth to make more accurate diagnoses, faster. Our proprietary Clarity AI technology uses scientifically-validated diagnostic tools, Artificial Intelligence, and voice recognition technology to bring a data-driven approach that has long been standard in physical medical practices to the mental health arena. Similar to other medical practices, where the diagnosis is based on a variety of tests and calibrations such as blood tests, x-rays, or MRIs to gain a holistic understanding of a patient’s problem, Clarity AI uses the science of Speech Emotion Recognition (SER) and AI to identify trauma biomarkers in a patient’s voice. These technologies give therapists the tools they need to better support and provide services to children and adolescents from low-income families. Google for Startups: Black Founders Fund—Google Cloud technology transforming behavioral health care  TQIntelligence relies on data and Cloud technology to drive accurate mental health diagnostics. Google has provided us with a wealth of resources and products to help us along this journey. Our Clarity AI tool utilizes Google’s Cloud Healthcare API, supporting HIPAA compliance and ensuring the safety of patient data. Google Cloud allowed us to collaborate with their voice analytics team, including giving access to Cloud AutoML tools to advance our speech emotion recognition technology. Once fully developed, this algorithm will help us identify a patient’s level of emotional distress and help therapists establish the patient’s baseline and track patient progress over time, monitoring for improvement, stagnation, or deterioration. So far, we have successfully collected and analyzed more than 800 voice samples as part of our ML model training. These audio clips go through a manual voice labeling process by four mental health professionals since there is no open-source youth clinical voice sample to help us train our model. With the help from Google Cloud, we have been able to scale our data collection process while providing data-driven solutions to our pilot site collaborators. We also leverage Cloud Functions, Firebase and Cloud SQL to create a highly scalable serverless application. Firebase offers seamless integration of data collected to our smartphone applications. The data to be used for our machine learning model training is collected on the mobile platforms and then moved into Cloud Storage using Cloud Functions for storing in buckets. Cloud Functions also is used to retrieve data in the web portal. The tabular data is then stored as databases in Cloud SQL.Black-led startups—Innovating for the futureOver the past year, there has been lot of noise surrounding the topic of social justice. I see many organizations using current conversations as a branding gimmick without any quantifiable commitment; others only offer reactionary or temporary responses. By showing up and putting their money where their mouth is, Google is leading the way for corporations, investors, and foundations looking for ways to start to address the dismal gap in funding for BIPOC and women founders. Google is empowering underrepresented founders like myself. For us, that came through our participation in the Google for Startups Founders Academy (apply here by February 9th!) and the Google for Startups Accelerator: Black Founders. These programs connected us to industry leaders and subject matter experts—relationships that converted into progress, and have proven to be a tremendous advantage in a space where Black-led startups have been excluded from developing AI technology. Receiving $100K in non-dilutive capital from the Google for Startups: Black Founders Fund truly changed the game for us. In addition to financial support, the Black Founders Fund provided us with product support, including 1:1 mentorship from Google Cloud’s engineering team as well as access to Google Cloud credits. Furthermore, we were able to secure an additional $1 million grant from the National Science Foundation. But most importantly, it is fostering meaningful change toward equitable funding. Despite being one of the fastest-growing groups of entrepreneurs, Black founders receive less than 1% of venture capital in the U.S. Excluding founders of color from access to funding isn’t just bad business; it reflects the legacy of white supremacy and racism in this country. At this pivotal point in our country’s history, we need more investors and decision-makers recognizing that diversity drives innovation. Part of this change requires organizations fearlessly and courageously examine their role in perpetuating the legacy of white supremacy, followed by intentional and well-thought actions on how they can contribute to social equity. As someone who grew up with limited resources, I know firsthand the consequences of scarcity to individuals’ emotional, psychological and spiritual development. Founders of color like me are the most appropriate change agents to address the ills of poverty and the psychological impact of scarcity. Going forward, the TQIntelligence team will continue our work with low-income communities and strive to help therapists in these communities make the most of their limited resources to provide effective psychotherapeutic intervention; effective therapy has the most significant impact on future generations. With the support of Google for Startups Black Founders Fund and our mentors at Google—such as Josh Belanich, Jason Scott, Jewel Burks Solomon, and many others—we’ve been able to positively impact the lives of young people from low-income communities. I look forward to continuing this journey with the Google team and changing the world for the better, one diagnosis at a time!If you want to learn more about how Google Cloud can help your startup, visit our startup page here and sign up for our monthly startup newsletter to get a peek at our community activities, digital events, special offers, and more.
Quelle: Google Cloud Platform

A primer on Cloud Bigtable cost optimization

To serve the various workloads that you might have, Google Cloud offers a selection of managed databases. In addition to partner-managed services, including MongoDB, Cassandra by Datastax, Redis Labs, and Neo4j, Google Cloud provide a series of managed database options: CloudSQL and Cloud Spanner for relational use cases, Firestore and Firebase for document data, Memorystore for in-memory data management, and Cloud Bigtable, a wide-column, key-value database that can scales horizontally to support millions of requests per second with low latency. Fully managed cloud computing databases such as Cloud Bigtable enable organizations to store, analyze, and manage petabytes of data without the operational overhead of traditional self-managed databases. Even with all the cost efficiencies that cloud databases offer, as these systems continue to grow and support your applications, there are additional opportunities to optimize costs. This blog post reviews the billable components of Cloud Bigtable, discusses the impact various resource changes can have on cost, and introduces several high-level best practices that may help manage resource consumption for your most demanding workloads. (In later posts, we’ll discuss optimizing costs while balancing performance trade-offs using methods and best practices that apply to organizations of all sizes.) Understand the resources that contribute to Cloud Bigtable costsThe cost of your Bigtable instance is directly correlated to the quantity of consumed resources. Compute resources are charged according to the amount of time the resources are provisioned, whereas for network traffic and storage, you are charged by the quantity consumed.More specifically, when you use Cloud Bigtable, you are charged according to the following:NodesIn Cloud Bigtable, a node is a compute resource unit. As the node count increases, the instance is able to respond to a progressively higher request (writes and reads) load, as well as serve an increasingly larger quantity of data. Node charges are the same for instances regardless if its clusters store data on solid-state drives (SSD) or hard disk drives (HDD). Bigtable keeps track of how many nodes exist in your instance clusters during each hour. You are charged for the maximum number of nodes during that hour, according to the regional rates for each cluster. Nodes are priced in hours per node; the nodal unit price is determined by the cluster region.Data storageWhen you create a Cloud Bigtable instance, you choose the storage type: SSD or HDD; this cannot be changed afterward. The average used storage over a one-month period is utilized to calculate the monthly rate. Since data storage costs are region-dependent, there will be a separate line item on your bill for each region where an instance cluster has been provisioned. The underlying storage format of Cloud Bigtable is the SSTable; and you are billed only for the compressed disk storage consumed by this internal representation. This means that you are charged for the data as it is compressed on disk by the Bigtable service. Further, all data in Google Cloud is persisted in the Colossus file storage system for improved durability. Data Storage is priced in binary gigabytes (GiB)/month; the storage unit price is determined according to the deployment region and the storage type, either SSD or HDD.Network trafficIngress traffic, or the quantity of bytes sent to Bigtable, is free. Egress traffic, or the quantity of bytes sent from Bigtable, is priced according to the destination. Egress to the same zone and egress between zones in the same region are free, whereas cross-region egress and inter-continent egress incur progressively increasing costs based on the total quantity of bytes transferred during the billing period. Egress traffic is priced in GiB sent.Backup storage Cloud Bigtable users can readily initiate, within the bounds of project quota, managed table backups to protect against data corruption or operator error. Backups are stored in the zone of the cluster from which they are taken, and will never be larger than the size of the archived table. You are billed according to the storage used and the duration of the backup between backup creation and removal, via either manual deletion or assigned time-to-live (TTL.) Backup storage is priced in GiB/month; the storage unit price is dependent on the deployment region but is the same regardless of the instance storage type.Understand what you can adjust to affect Bigtable cost As discussed, the billable costs of Cloud Bigtable are directly correlated to the compute nodes provisioned as well as the storage and network resources consumed over the billing period. Thus, it is intuitive that consuming fewer resources will result in reduced operational costs.  At the same time, there are performance and functional implications of resource consumption rate reductions that require consideration. Any effort to reduce operational cost of a running database-dependent production system is best undertaken with a concurrent assessment of the necessary development or administrative effort, while also evaluating potential performance tradeoffs. Certain resource consumption rates can be easily changed, while other types of resource consumption rate changes require application or policy changes, and the remaining type can only be achieved upon the completion of a data migration.Node countDepending on your application or workload, any of the resources consumed by your instance might represent the most significant portion of your bill, but it is very possible that the provisioned node count constitutes the largest single line item (we know, for example, that Cloud Bigtable nodes generally represent 50-80% of costs depending on the workload). Thus it is likely that a reduction in the number of nodes might offer the best opportunity for expeditious cost reduction with the most impact. As one would expect, cluster CPU load is the direct result of the database operations served by the cluster nodes. At a high level, this load is generated by a combination of the database operation complexity, the rate of read or write operations per second, and the rate of data throughput required by your workload.  The operation composition of your workload may be cyclical and change over time, providing you the opportunity to shape your node count to the needs of the workload. When running a Cloud Bigtable cluster, there are two inflexible maximum metric upper bounds: the maximum available CPU (i.e., 100% average CPU utilization) and the maximum average quantity of stored data that can be managed by a node. At the time of writing, nodes of SSD and HDD clusters are limited to manage no more than 2.5 TiB and 8 TiB data per node respectively.If your workload attempts to exceed these limits, your cluster performance may be severely degraded. If available CPU utilization is exhausted, your database operations will increasingly experience undesirable results: high request latency, and an elevated service error rate. If the amount of storage per node exceeds the hard limit in any instance cluster, writes to all clusters in that instance will fail until you add nodes to each cluster that is over the limit.As a result, you are recommended to choose a node count for your cluster such that some headroom is maintained below the respective metric upper bounds. In the event of an increase in database operations, the database can continue to serve requests with optimal latency, and the database will have room to support spikes in load before hitting the hard serving limits.  Alternatively, if your workload is more data-intensive than compute-intensive, it might be possible to reduce the amount of data stored in your cluster such that the minimum required node count is lowered.Data storage volumeSome applications, or workloads, generate and store a significant amount of data. If this evokes the behavior of your workload, there might be an opportunity to reduce costs by storing, or retaining, less data in Cloud Bigtable.  As discussed, data storage costs are correlated to the amount of data stored over time: if less data is stored in an instance, the incurred storage costs will be lower. Depending on the storage volume, the structure of your data and the retention policies, an opportunity for cost savings could exist for either instances of the SSD or HDD storage types.As noted above, since there is a minimum node requirement based on the total data stored, there is a possibility that reducing the data stored might reduce both data storage costs as well as provide an opportunity for reduced node costs.Backup storage volume Each table backup performed will incur additional cost for the duration of the backup storage retention. If you can determine an acceptable backup strategy that retains fewer copies of your data for less time, you will be able to reduce this portion of your bill. Storage typeDepending on the performance needs of your application, or workload, there is a possibility that both node and data storage costs can be reduced if your database is migrated from SSD to HDD.  This is due to the fact that HDD nodes can manage more data than SSD nodes, and the storage costs for HHD are an order of magnitude lower than SSD storage. However, the performance characteristics are different for HDD: read and write latencies are higher, supported reads per second are lower, and throughput is lower. Therefore, it is essential that you assess the suitability of HDD for the needs of your particular workload before choosing this storage type.Instance topology At the time of writing, a Cloud Bigtable instance can contain up to four clusters provisioned in the available Google Cloud zones of your choice. In case your instance topology encompasses more than one cluster, there are several potential opportunities for reducing your resource consumption costs.  Take a moment to assess the number and the locations of clusters in your instance.  It is understandable that each additional cluster results in additional node and data storage costs, but there is also a network cost implication. When there is more than one cluster in your instance, data is automatically replicated between all of the clusters in your instance topology.If instance clusters are located in different regions, the instance will accrue network egress costs for inter-region data replication. If an application workload issues database operations to a cluster in a different region, there will be network egress costs for both the calls originating from the application and the responses from Cloud Bigtable.There are strong business rationales, such as system availability requirements, for creating more than one cluster in your instance. For instance, a single cluster provides three nines, or 99.9% availability, and a replicated instance with two or more clusters provides four nines, or 99.99%, availability when a multi-cluster routing policy is used. These options should be taken into account when evaluating the needs for your instance topology.When choosing the locations for additional clusters in a Cloud Bigtable instance, you can choose to place replicas in geo-disparate locations such that data serving and persistence capacity are close to your distributed application endpoints. While this can provide various benefits to your application, it is also useful to weigh the cost implications of the additional nodes, the location of the clusters, and the data replication costs that can result from instances that span the globe. Finally, while limited to a minimum node count by the amount of data managed, clusters are not required to have a symmetric node count. The result is that you could asymmetrically size your clusters according to the expected load from application traffic expected for each cluster.High-level best practices for cost optimizationNow that you have had a chance to review how costs are apportioned for Cloud Bigtable instance resources, and you have been introduced to the resource consumption adjustments available that affect billing cost, check out  some strategies available to realize cost savings that will balance the tradeoffs relative to your performance goals. (We’ll discuss techniques and recommendations to follow these best practices in the next post.). Options to reduce node costsIf your database is overprovisioned, meaning that your database has more nodes than needed to serve database operations from your workloads, there is an opportunity to save costs by reducing the number of nodes.  Manually optimize node count If the load generated by your workload is reasonably uniform, and your node count is not constrained by the quantity of managed data, it may be possible to gradually decrease the number of nodes using a manual process to find your minimum required count.Deploy autoscalerIf the database demand of your application workload is cyclical in nature, or undergoes short-term periods of elevated load, bookended by significantly lower amounts, your infrastructure may benefit from an autoscaler that can automatically increase and decrease the number of nodes according to a schedule or metric thresholds.Optimize database performance As discussed earlier, your Cloud Bigtable cluster should be sized to accommodate the load generated by database operations originating from your application workloads with a sufficient amount of headroom to absorb any spikes in load. Since there is this direct correlation between the minimum required node count and the amount of work performed by the databases, an opportunity may exist to improve the performance of your cluster so the minimum number of required nodes is reduced.Possible changes in your database schema or application logic that can be considered include rowkey design modifications, filtering logic adjustments, column naming standards, and column value design. In each of these cases, the goal is to reduce the amount of computation needed to respond to your application requests.Store many columns in a serialized data structure Cloud Bigtable organizes data in a wide-column format. This structure significantly reduces the amount of computational effort required to serve sparse data. On the other hand, if your data is relatively dense, meaning that most columns are populated for most rows, and your application retrieves most columns for each request, you might benefit from combining the columnar values into fields in a single data structure. A protocol buffer is one such serialization structure.Assess architectural alternativesCloud Bigtable provides the highest level of performance when reads are uniformly distributed across the rowkey space. While such an access pattern is ideal, as serving load will be shared evenly across the compute resources, it is likely that some applications will interact with data in a less uniformly distributed manner.For example, for certain workload patterns, there may be an opportunity to utilize Cloud Memorystore to provide a read-through, or capacity cache. The additional infrastructure would add an additional cost, however certain system behavior may precipitate a larger decrease in Bigtable node cost. This option would most likely benefit cases when your workload queries data according to a power law distribution, such as theZipf distribution, where a small percentage of keys accounts for a large percentage of the requests, and your application requires extremely low P99 latency. The tradeoff is that the cache will be eventually consistent, consequently your application must be able tolerate some data latency.Such an architectural change would potentially allow for you to serve requests with greater efficiency, while also allowing you to decrease the number of nodes in your cluster. Options to reduce data storage costsDepending on the data volume of your workload, your data storage costs might account for a large portion of your Cloud Bigtable cost. Data storage costs can be reduced in one of two ways: store less data in Cloud Bigtable, or choose a lower-cost storage type. Developing a strategy for offloading data for longer-term data to either Cloud Storage or BigQuery may provide a viable alternative to keeping infrequently accessed data in Cloud Bigtable without eschewing the opportunity for comprehensive analytics use cases. Assess data retention policies One straightforward method to reduce the volume of data stored is to amend your data retention policies so that older data can be removed from the database after a certain age threshold. While writing an automated process to periodically remove data outside the retention policy limits would accomplish this goal, Cloud Bigtable has a built-in feature that allows for garbage collection to be applied to columns according to policies assigned to their column family. It is possible to set policies that will limit the number of cell versions, or define a maximum age, or a time-to-live (TTL), for each cell based on its version timestamp. With garbage collection policies in place, you are given the tools to safeguard against unbounded Cloud Bigtable data volume growth for applications that have established data retention requirements. Offload larger data structuresCloud Bigtable performs well with rows up to 100 binary megabytes (MiB) in total size, and can support rows up to 256 MiB, which gives you quite a bit of flexibility about what your application can store in each row. Yet, if you are using all of that available space in every row, the size of your database might grow to be quite large.For some datasets, it might be possible to split the data structures into multiple parts: one, optimally smaller part in Cloud Bigtable and another, optimally larger, part in Google Cloud Storage. While this would require your application to manage the two data stores, it could provide the opportunity to decrease the size of the data stored in Cloud Bigtable, which could in turn lower storage costs.Migrate from instance storage from SSD to HDDA final option that may be considered to reduce storage cost for certain applications is a migration of your storage type to HHD from SSD. Per-gigabyte storage costs for HDD storage are an order of magnitude less expensive than SSD. Thus, if you need to have a large volume of data online, you might assess this type of migration.That said, this path should not be embarked upon without serious consideration. Only once you have comprehensively evaluated the performance tradeoffs, and you have allotted the operational capacity to conduct a data migration, might this be chosen as a viable path forward.  Options to reduce backup storage costs At the time of writing, you can create up to 50 backups of each table and retain each for up to 30 days. If left unchecked, this can add up quickly.Take a moment to assess the frequency of your backups and the retention policies you have in place. If there are not established business or technical requirements for the current quantity of archives that you currently retain, there might be an opportunity for cost reduction. What’s next Cloud Bigtable is an incredibly powerful database that provides low latency database operations and linear scalability for both data storage and data processing. As with any provisioned component in your infrastructure stack, the cost of operating Cloud Bigtable is directly proportional to the resources consumed by its operation. Understanding the resource costs, the adjustments available, and some of the cost optimization best practices is your first step toward finding a balance between your application performance requirements and your monthly spend. In the next post in this series, you will learn about some of the observations you can make of your application to better understand the options available for cost optimization.  Until then, you can:Learn more about Cloud Bigtable pricing Review the recommendations about choosing between SSD and HDD storageUnderstand more about the various aspects of Cloud Bigtable performance
Quelle: Google Cloud Platform
Search and browse Google Cloud code samples

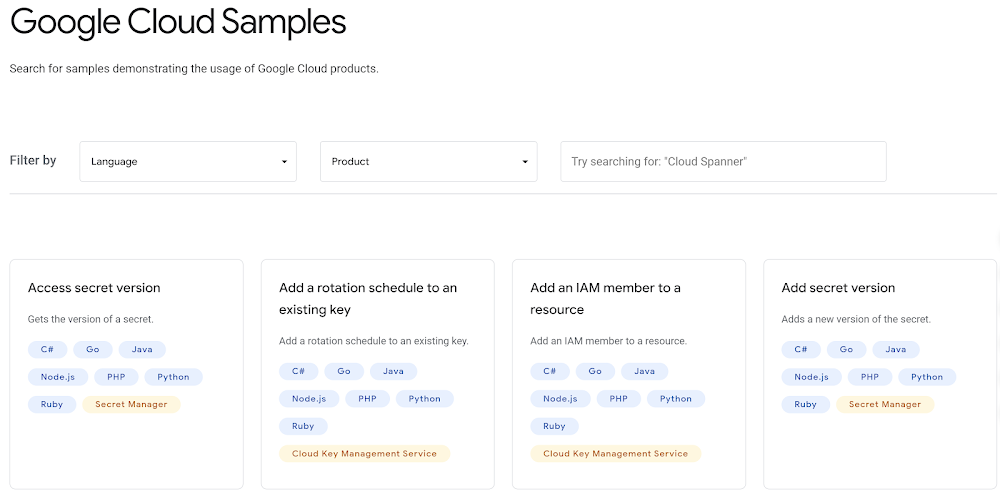
We’ve added new features to our documentation to provide quick and easy ways to search and browse all code samples that are available for Google Cloud. When getting started with a new technology, are you the type of developer who immediately looks for code samples? If so, you’ll be happy to check out these new features.  All code samples search pageThe first new feature is the all code samples search page. On this page, you can browse through 1200+ code sample “tiles”, each of which includes a list of programming languages that the code sample is available in, along with the relevant Google Cloud product. At the top of the page are two filters: the first provides a quick way to filter the code samples listed by programming language, and the second lets you filter the list of code samples by one or more Google Cloud products. Next to the filters is a text search box where you can search the titles and descriptions of code samples.All code samples page for a specific Google Cloud productThe next feature provides new pages that contain all code samples for a specific Google Cloud product, integrated into the product’s existing documentation. Use these pages to see all the code samples for a product like BigQuery. The code samples listed on this page include a View in documentation section, which lists all of the documentation pages that include the code sample.Individual code sample pagesIf you click the “View Sample” button from one of the new code sample pages, you open an individual page for that code sample. This page displays the code sample along with a list of documentation pages that include the code sample. You can click the View on GitHub button to see the complete code sample on Github.As we add new code samples to the Google Cloud open source Github repositories, we automatically create new standalone code sample pages in our documentation to feature these new additions.Try searching and browsing our new code sample pages. We hope they help you get started quicker. Or, if your development is already well underway, we hope that these improvements speed up your coding efforts by getting you right to the code samples that you’re looking for.Related ArticleIntroducing interactive code samples in Google Cloud documentationWith interactive code samples in Google Cloud documentation, you can replace the variables inline, before you even copy the snippet.Read Article
Quelle: Google Cloud Platform

Can machine learning make you a better athlete?

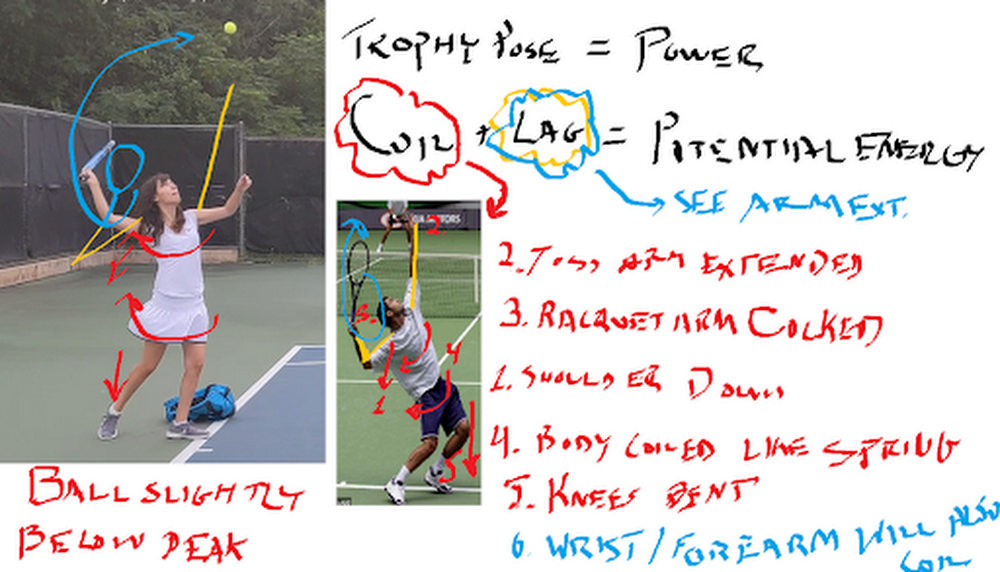
Ah, the Super Bowl. Or, as I prefer to say, the Superb Owl—that oh-so-American Sunday defined by infinite nachos, high-budget commercials, and memes that can last us half a decade. As an uncoordinated math geek, I can’t say I’ve ever had much connection to the “Football” part of the Super Bowl. That said, sports, data analytics, and machine learning make a powerful trio: most professional teams use this technology in one way or another, from tracking players’ moves to detecting injuries to reading numbers off players’ jerseys. And, for the less athletic of us, machine learning may even be able to help us improve our own skills.Which is what we’ll attempt today. In this post, I’ll show you how to use machine learning to analyze your performance in your sport of choice (as an example, I’ll use my tennis serve, but you can easily adopt the technique to other games). We’ll use the Video Intelligence API to track posture, AutoML Vision to track tennis balls, and some math to tie everything together in Python.Want to try this project for yourself? Follow along in the Qwiklab.I give full credit for this idea from my fellow Googler Zack Akil, who used the same technique to analyze penalty kicks in soccer (sorry, “football”).Using machine learning to analyze my tennis serveTo get started, I set out to capture some video data of my tennis serve. I went to a tennis court, set up a tripod, and captured some footage. Then I sent the clips to my tennis coach friend, who gave me some feedback that looked like this:These diagrams were great because they analyzed key parts of my serve that differed from those of professional athletes. I decided to use this to hone in on what my machine learning app would analyze:Were my knees bent as I served?Was my arm straight when I hit the ball?How fast did the ball actually travel after I hit it? (This one was just for my personal interest)Analyzing posture with pose detectionTo compute the angle of my knees and arms, I decided to use pose detection—a machine learning technique that analyzes photos or videos of humans and tries to locate their body parts. There are lots of tools you can use to do pose detection (like TensorFlow.js), but for this project, I wanted to try out the new Person Detection feature of the Google Cloud Video Intelligence API. (You might recognize this API from my AI-Powered Video Archive, where I used it to analyze objects, text, and speech in my family videos.) The Person Detection feature recognizes a whole bunch of body parts, facial features, and clothing. From the docs:To start, I clipped the video of my tennis serves down to just the sections where I was serving. Since I only caught 17 serves on camera, this took me about a minute. Next, I uploaded the video to Google Cloud Storage and ran it through the Video Intelligence API. In code, that looks like: To call the API, you pass the location in Cloud Storage where your video is stored as well as a destination in cloud storage where the Video Intelligence API can write the results.When the Video Intelligence API finished analyzing my video, I visualized the results using this neat tool built by @wbobeirne. It spits out neat visualization videos like this:Pose detection makes a great pre-processing step for training machine learning models. For example, I could use the output of the API (the position of my joints over time) as input features to a second machine learning model that tries to predict (for example) whether or not I’m serving, or whether or not my serve will go over the net. But for now, I wanted to do something much simpler: analyze my serve with high school math!For starters, I plotted the y position of my left and right wrists over time:It might look messy, but that data actually shows pretty clearly the lifetime of a serve. The blue line shows the position of my left wrist, which peaks as I throw the tennis ball a few seconds before I hit it with my racket (the peak in the right wrist, or orange line).Using this data, I can tell pretty accurately at what points in time I’m throwing the ball and hitting it. I’d like to align that with the angle my elbow is making as I hit the ball. To do that, I’ll have to convert the output of the Video Intelligence API–raw pixel locations–to angles. How do you do that? Obviously using the Law of Cosines, duh! (Just kidding, I definitely forgot this and had to look it up. Here’s a great explanation of the Law of Cosines and some Python code.)The Law of Cosines is the key to converting points in space to angles. In code, that looks something like:Using these formulae, I plotted the angle of my elbow over time:By aligning the height of my wrist and the angle of my elbow, I was able to determine the angle was around 120 degrees (not straight!). If my friend hadn’t told me what to look for, it would have been nice for an app to catch that my arm angle was different from professionals and let me know.I used the same formula to calculate the angles of my knees and shoulders. (You can find all the details in the code.)Computing the speed of my servePose detection let me compute the angles of my body, but I also wanted to compute the speed of the ball after I hit it with my racket. To do that, I had to be able to track the tiny, speedy little tennis ball over time.As you can see here, the tennis ball was sort of hard to identify because it was blurry and far away.I handled this the same way Zack did in his Football Pier project: I trained a custom AutoML Vision model.If you’re not familiar with AutoML Vision, it’s a no-code way to build computer vision models using deep neural networks. The best part is, you don’t have to know anything about ML to use it.AutoML Vision lets you upload your own labeled data (i.e. with labeled tennis balls) and trains a model for you.Training an object detection model with AutoML VisionTo get started, I took a thirty second clip of me serving and split it into individual pictures I could use as training data to a vision model:ffmpeg -i filename.mp4 -vf fps=10 -ss 00:00:01 -t 00:00:30 tmp/snapshots/%03d.jpgYou can run that command from within the notebook I provided, or from the command line if you have ffmpeg installed. It takes an mp4 and creates a bunch of snapshots (here at fps=20, i.e. 20 frames per second) as jpgs. The -ss flag controls how far into the video the snapshots should start (i.e. start “seeking” at 1 second) and the flag -t controls how many seconds should be included (30 in this case).Once you’ve got all your snapshots created, you can upload them to Google Cloud storage with the command:gsutil mb gs://my_neat_bucket  # create a new bucketgsutil cp tmp/snapshots/* gs://my_neat_bucket/snapshotsNext, navigate to the Google Cloud console and select Vision from the left hand menu:Create a new AutoML Vision Model and import your photos.Quick recap: what’s a machine learning classifier? It’s a type of model that learns how to label things from example. So to train our own AutoML Vision model, we’ll need to provide some labeled training data for the model to learn from.Once your data has been uploaded, you should see it in the AutoML Vision “IMAGES” tab:Here, you can start applying labels. Click into an image. In the editing view (below), you’ll be able to click and drag a little bounding box:For my model, I hand-labeled about 300 images which took me ~30 minutes. Once you’re done labeling data, it’s just one click to train a model with AutoML–just click the “Train New Model” button and wait.When your model is done training, you’ll be able to evaluate its quality in the “Evaluate” tab below.As you can see, my model was pretty darn accurate, with about 96% precision and recall.This was more than enough to be able to track the position of the ball in my pictures, and therefore calculate its speed:Once you’ve trained your model, you can use the code in this Jupyter notebook to make a cute little video like the one I plotted above.You can then use this to plot the position of the ball over time, to calculate speed:Unfortunately, I realized too late I’d made a grave mistake here. What is speed? Change in distance over time, right? But because I didn’t actually know the distance between me, the player, and the camera, I couldn’t compute distance in miles or meters–only pixels! So I learned I serve the ball at approximately 200 pixels per second. Nice.So there you have it–some techniques you can use to build your own sports machine learning trainer app. And if you do build your own sports analyzer, let me know!Related ArticleBaking recipes made by AIIn this post, we’ll show you how to build an explainable machine learning model that analyzes baking recipes, and we’ll even use it to co…Read Article
Quelle: Google Cloud Platform

Why a leader at Twitter thinks Google Cloud training is a must for IT execs and employees

Editor’s note: Today we’re hearing from Kathleen Vignos, Director of Platform Engineering at Twitter. Kathleen shares how Google Cloud training and certifications help Twitter leaders and employees increase business impact, stay up to date with the latest technologies, and grow their careers. One of Twitter’s core values is having a growth mindset, and as a director in Twitter’s Platform Engineering organization, I believe it’s important for engineering leaders like me to stay up to date on technical training and ensure our teams also have the training they need. I lead our infrastructure automation group which includes our cloud acceleration team. As part of our hybrid cloud strategy, our cloud acceleration engineers focus on enabling Twitter developers to use cloud services such as Google Cloud. To ensure we promote best practices in the cloud, I helped organize and participated in a 6 day-long Google Cloud training session at Twitter. This training gave us all an opportunity to better understand how we could use the latest cloud technologies as well as learn new skills and ways of thinking. During the sessions, we focused on how to design and plan secure cloud architecture solutions as well as manage and provision cloud infrastructure. We also learned how to analyze and optimize technical and business processes. On top of that, the training helped us prepare for Google Cloud’s Professional Cloud Architect certification. Why IT leaders should take Google Cloud trainingCloud architecture training is important for technical leaders because it helps you further your cloud architecture expertise and understand which business decisions to make and the trade-offs involved as you assess your cloud strategy. The training can also help you improve your on-prem strategy. I see the way Google Cloud groups their products together as a type of organizational framework which helped me gain a fresh perspective on how I should structure teams who support our on-prem environment. I’ve also been able to improve our on-prem strategy by considering some of the cloud best practices taught in the sessions. The hands-on experience provided during Google Cloud’s training is valuable as well. As engineering leaders progress in their careers, they get further away from the hands-on experience of coding every day and digging into consoles and features. This type of training provides a unique opportunity for us to keep learning, which is vital as our industry continues to rapidly evolve. We need to have a strong understanding of the technologies we’re already managing and the emerging innovations we need to invest in. For example, running gcloud commands in training labs helps demonstrate how to do things like spin up instances, along with options to do that on the command line, through the console, or via the Cloud API. Creating a networking subnet during the sessions helps mimic the problems that arise for our teams when they need to troubleshoot while setting up networking between services. Simple queries against Bigtable show the power and ease of being able to manipulate large datasets.Moreover, taking the training allowed me to assess the value of the coursework to decide what kind of training to continue providing for my teams.Why IT leaders should invest in Google Cloud training and certifications for their teamsTo earn a Google Cloud certification, individuals need to take Google Cloud training and pass a comprehensive certification exam. The certifications are valuable credentials which help your team validate their expertise and grow their careers as well as help organizations retain top talent. When members of my team became certified, it signaled to others at Twitter that my team includes cloud experts. Certified individuals can also help others at Twitter grow their cloud skills. Developers and engineers highly value the ability to work with new technologies and continue learning new skills at their jobs. In fact, given Twitter’s commitment to learning and growth, our developers and engineers have an expectation that they’re going to be able to work with the most interesting, complex, challenging scale problems and have access to the newest technologies to solve those problems. Providing training and certification opportunities along with the ability to train during work hours signals to employees that a company is invested in their careers and growth. Employees feel more engaged in their work and are more likely to stay at an organization when it’s clear they can move their careers forward within the company with strong support from leadership. Interested in learning more about Google Cloud certifications? Watch this on-demandwebinarfor an overview of available certifications and receive learning paths with recommended training courses, tips, and tools you can use to prepare for certification exams.Related Article2021 resolutions: Kick off the new year with free Google Cloud trainingTackle your New Year’s resolutions with our new skills challenges which will provide you with no cost training to build cloud knowledge i…Read Article
Quelle: Google Cloud Platform