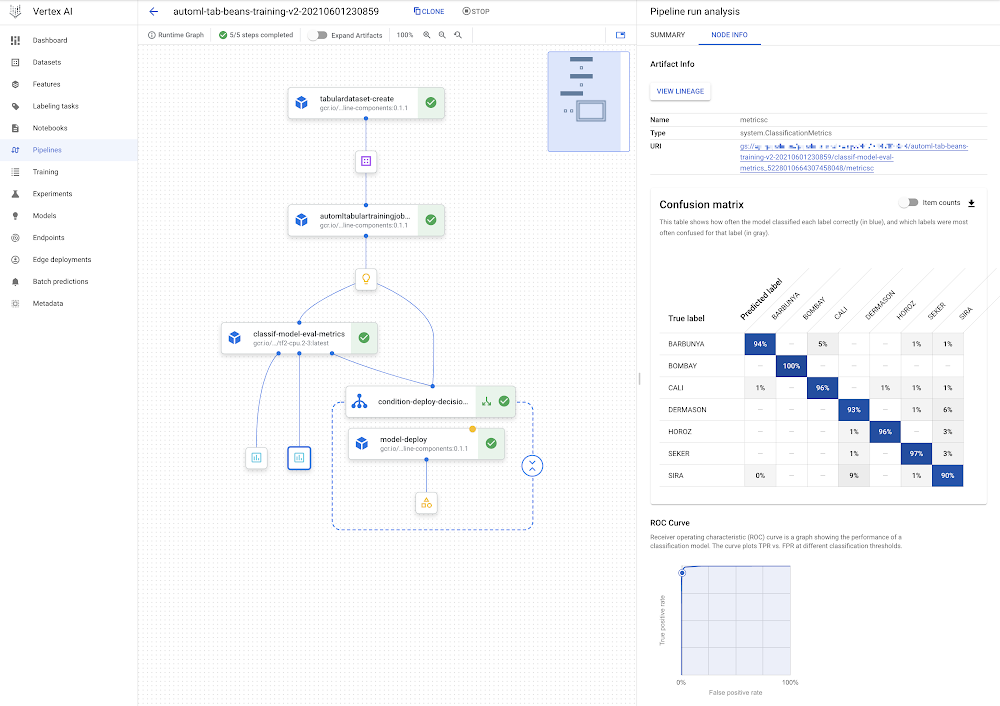
IntroductionThis post shows how you can use Vertex Pipelines to build an end-to-end ML workflow. The workflow trains a custom model using AutoML; evaluates the accuracy of the trained model; and if the model is sufficiently accurate, deploys it to Vertex AI for serving.Vertex AI and Vertex PipelinesThe recently-launched Vertex AI is a unified ML Ops platform to help data scientists and ML engineers increase their rate of experimentation, deploy models faster, and manage models more effectively. It brings AutoML and AI Platform together, with some new ML Ops-focused products, into a unified API, client library, and user interface.Vertex Pipelines is part of Vertex AI. It helps you to automate, monitor, and govern your ML systems by orchestrating your ML workflows. It is automated, scalable, serverless, and cost-effective: you pay only for what you use. Vertex Pipelines is the backbone of the Vertex AI ML Ops story, and makes it easy to build and run ML workflows using any ML framework. Because it is serverless, and has seamless integration with GCP and Vertex AI tools and services, you can focus on building and running your pipelines without worrying about infrastructure or cluster maintenance.Vertex Pipelines automatically logs metadata to track artifacts, lineage, metrics, and execution across your ML workflows, supports step execution caching, and provides support for enterprise security controls like Cloud IAM, VPC-SC, and CMEK.Vertex Pipelines supports two open source Python SDKs: TFX (TensorFlow Extended) and KFP (Kubeflow Pipelines). The example Vertex pipeline highlighted in this post uses the KFP SDK, and includes use of the Google Cloud Pipeline Components, which support easy access to Vertex AI services. Vertex Pipelines requires v2 of the KFP SDK. Soon, it will be possible to use the KFP v2 ‘compatibility mode’ to run KFP V2 examples like this on OSS KFP as well.An end-to-end AutoML workflow with Vertex PipelinesVertex AI’s AutoML Tabular service lets you bring your own structured data to train a model, without needing to build the model architecture yourself. For this example, I’ll use the UCI Machine Learning ‘Dry beans’ dataset. (From: KOKLU, M. and OZKAN, I.A., (2020) “Multiclass Classification of Dry Beans Using Computer Vision and Machine Learning Techniques.”In Computers and Electronics in Agriculture, 174, 105507. DOI.)The challenge is a classification task: predict the type of a bean given some information about its characteristics.Vertex Pipelines makes it very straightforward to construct a workflow to support building, evaluating, and deploying such models. We’ll build a pipeline that looks like this:The DAG for the AutoML classification workflow.You can see that the model deployment step is wrapped by a conditional: the model will only be deployed if the evaluation step indicates that it is sufficiently accurate.For this example, nearly all the components (steps) in the pipeline are prebuilt Google Cloud Pipeline Components. This means that we mostly just need to specify how the pipeline is put together using these building blocks.However, I’ll add one Python function-based custom component for model evaluation and metrics visualization.The pipeline definition looks as follows (with a bit of detail elided):We first create a Dataset from a BigQuery table that holds the training data. Then, we use AutoML to train a tabular classification model. The dataset arg to the training step gets its value from the output of the Dataset step (dataset=dataset_create_op.outputs[“dataset”]).After the model is trained, its evaluation metrics are checked against given ‘threshold’ information, to decide whether it’s accurate enough to deploy.The next section goes into more detail about how this custom ‘eval metrics’ component is defined. One of its inputs is an output of the training step (training_op.outputs[“model”])— which points to the trained model.Then, a KFP conditional uses an output of the eval step to decide whether to proceed with the deployment:If the model is sufficiently accurate, the prebuilt deployment component is called. This step creates an Endpoint and deploys the trained model to that endpoint for serving.Defining a custom componentMost of the steps in the pipeline above are drawn from pre-built components; building blocks that make it easy to construct an ML workflow. But I’ve defined one custom component to parse the trained model’s evaluation metrics, render some metrics visualizations, and determine— based on given ‘threshold’ information— whether the model is good enough to be deployed. This custom component is defined as a Python function with a @kfp.v2.dsl.component decorator. When this function is evaluated, it is compiled to a task ‘factory function’ that can be used in a pipeline specification. The KFP SDK makes it very straightforward to define new pipeline components in this way.Below is the custom component definition, with some detail elided. The @component decorator specifies three optional arguments: the base container image to use; any packages to install; and the yaml file to which to write the component specification.The component function, classif_model_eval_metrics, has some input parameters of note. The model parameter is an input kfp.v2.dsl.Modelartifact. As you may remember from the pipeline specification above, here this input will be provided by an output of the training step.The last two function args, metrics and metricsc , are component Outputs, in this case of types Metrics and ClassificationMetrics. They’re not explicitly passed as inputs to the component step, but rather are automatically instantiated and can be used in the component. For example, in the function below, we’re calling metricsc.log_roc_curve() and metricsc.log_confusion_matrix() to render these visualizations in the Pipelines UI. These Output params become component outputs when the component is compiled, and can be consumed by other pipeline steps.The NamedTuple outputs are another type of component output. Here we’re returning a string that indicates whether or not to deploy the model. When this function is evaluated, we can use the generated factory function to define a pipeline step as part of a pipeline definition, as we saw in the previous section:The example notebook has the full component definition.Sharing component specificationsWhen the component is compiled, we can also request that a yaml component specification be generated. We did this via the optional output_component_file=”tables_eval_component.yaml” arg passed to the @component decorator.The yaml format allows the component specification to be put under version control and shared with others.Then, the component can be used in other pipelines by calling the kfp.components.load_component_from_url function (and other variants like load_component_from_file).Running a pipeline job on Vertex PipelinesOnce a pipeline is defined, the next step is to compile it — which generates a json job spec file— then submit and run it on Vertex Pipelines. When you submit a pipeline job, you can specify values for pipeline input parameters, overriding their defaults.The example notebook shows the details of how to do this.Once a pipeline is running, you can view its details in the Cloud Console, including the pipeline run and lineage graphs shown above, as well as pipeline step logs and pipeline Artifact details.You can also submit pipeline job specs via the Cloud Console UI, and the UI makes it easy to clone pipeline runs. The json pipeline specification file may also be put under version control and shared with others.Leveraging Pipeline step caching to develop and debugVertex Pipelines supports step caching, and this helps with iterating on pipeline development— when you rerun a pipeline, if a component’s inputs have not changed, its cached execution results can be reused. If you run this pipeline more than once, you might notice this feature in action.If you’re running the example, try making a small change to the example notebook cell that holds the custom component definition (the classif_model_eval_metrics function in the “Define a metrics eval custom component” section) by uncommenting this line: # metrics.metadata[“model_type”] = “AutoML Tabular classification”Then re-compile the component, recompile the pipeline without changing the DISPLAY_NAME value, and run it again. When you do so, you should see that Vertex Pipelines can leverage the cached executions for the upstream steps— as their inputs didn’t change— and only needs to re-execute from the changed component. The pipeline DAG for the new run should look as follows, with the ‘recycle’ icon on some of the steps indicating that their cached executions were used.Leveraging step caching with the AutoML classification workflow.Note: Step caching is on by default, but if you want to disable it, you can pass the enable_caching=False arg to the create_run_from_job_spec function when you submit a pipeline run.Lineage trackingIf you click on an Artifact in a pipeline graph, you’ll see a “VIEW LINEAGE” button. This tracks how the artifacts are connected by step executions. So it’s sort of the inverse of the pipeline DAG, and can include multiple executions that consumed the same artifact (this often happens with cache hits, for example). The tracking information shown is not necessarily just for a single pipeline run, but for any pipeline execution that has used the given artifact.Lineage tracking.What’s next?This post introduced Vertex Pipelines, and the prebuilt Google Cloud Pipeline Components, which allow easy access to Vertex AI services. The Pipelines example in this post uses the AutoML Tabular service, showing how straightforward it is to bring your own data to train a model. It showed a pipeline that creates a Dataset, trains a model using that dataset, obtains the model’s evaluation metrics, and decides whether or not to deploy the model to Vertex AI for serving.For next steps, check out other Vertex Pipelines example notebooks as well as a codelab based in part on the pipeline in this post.You can also find other Vertex AI notebook examples here and here.Related ArticleGoogle Cloud unveils Vertex AI, one platform, every ML tool you needGoogle Cloud launches Vertex AI, a managed platform for experimentation, versioning and deploying ML models into production.Read Article
Quelle: Google Cloud Platform